Implications
Data pre-processing receives little attention when compiling or analysing feed data. Generally, it is ignored or, at best, some standard algorithms are used without studying their implications on data mining results. This paper presents a systematic approach to data pre-processing, especially to outlier detection, highlighting its importance to ensure reliable results. We demonstrate the existence of erroneous data that slip through laboratory quality control systems, even reaching scientific papers. In addition, we point out how lack of metadata does not allow full use of data. Feed data producers, compilers and analysts should be aware of these findings to improve their future use.
Introduction
Everyday, animal feed laboratories and research centres all over the world generate countless data of various kinds from the analysis of thousands of samples of raw materials and compound feedstuffs (Gizzi and Givens, Reference Gizzi and Givens2004). These data are generally used for a single purpose, for example, quality control or the publication of research results; they are subsequently discarded or, at best, stored in scattered and unstructured files. However, it is generally accepted that the added value obtainable from these data would more than justify the effort and cost involved in obtaining it. A number of researchers, including Tran and Lapierre (Reference Tran and Lapierre1997) and Maroto-Molina et al. (Reference Maroto-Molina, Gómez-Cabrera, Guerrero-Ginel, Garrido-Varo and Pérez-Marín2011), have developed information systems intended to systematize the collection, storage and management of feed data. These systems hold hundreds of thousands of data; to make full use of them, we need expert analyses on the basis of data mining and meta-analysis tools (Sauvant et al., Reference Sauvant, Tran, Heuzé, Bastianelli and Archimède2010).
However, as real-world data tend to be heterogeneous, noisy and inconsistent (Han and Kamber, Reference Han and Kamber2006), data pre-processing is essential to ensure reliable results. The various stages involved in pre-processing can account for up to 70% of the total time devoted to a data mining project (Pyle, Reference Pyle1999; Molina, Reference Molina2002). Therefore, systematization of the process is one of the major challenges in current data mining research.
Numerous pre-processing techniques have been reported in the scientific literature (Kotsiantis et al., Reference Kotsiantis, Kanellopoulos and Pintelas2006) often accompanied by examples of their application in a wide range of fields (Piramuthu, Reference Piramuthu2006; Wu, Reference Wu2009). Published papers focus mainly on outlier detection. However, very few papers address the specific use of data pre-processing methods with feed databases. In fact, few of the numerous publications dealing with data mining using feed databases (NcDowell et al., Reference NcDowell, Conrad, Thomas, Harris and Fick1977; Sauvant et al., Reference Sauvant, Pérez and Tran2002; Tedeschi et al., Reference Tedeschi, Fox, Pell, Duarte and Boin2002) make any reference to the algorithms used for outlier detection, which are mentioned only tangentially and superficially. Sauvant et al. (Reference Sauvant, Pérez and Tran2002), for example, used a 10% trimmed mean (excluding the highest 5% and the lowest 5%) when calculating the data included in their tables. Tedeschi et al. (Reference Tedeschi, Fox, Pell, Duarte and Boin2002) opted for the elimination of all data that differed by more than 2.5 standard deviations from the mean, or that inflated the variation coefficient by more than 30%. No authors in this specific field have considered the use of multivariate approaches, and no attempt has been made to type the outliers detected.
Therefore, the present study sought to evaluate a number of data pre-processing solutions to improve the data mining results of large feed databases: feed tables and prediction equations. The problems most commonly encountered are explored, and the performance of univariate and multivariate solutions is compared.
Material and methods
Data origin
The database used contained the information on alfalfa (Medicago sativa L.) stored in the data warehouse of the Tables of nutritive values for farm animals in tropical and Mediterranean regions (French acronym: TRC) (Tran et al., Reference Tran, Heuzé, Bastianelli, Archimède and Sauvant2010); it concerned 19 187 samples, together with their corresponding chemical and nutritional values. Data were drawn from a wide range of sources, for example, the French Association of Animal Production (French acronym: AFZ), the Feed Information Service (Spanish acronym: SIA) and the scientific literature. Information came from a total of 230 sources: 217 scientific papers and 13 databases. However, in quantitative terms, published papers accounted for only 8.2% of the samples.
Data integration
In the data warehouse of the TRC, metadata were expressed in English, French, Spanish and Portuguese, and therefore as a first step they were standardized to English. There were different forms of expression (units, descriptors, etc.) that were standardized using the system recommended by Maroto-Molina et al. (Reference Maroto-Molina, Gómez-Cabrera, Guerrero-Ginel and Garrido-Varo2008). In addition, metadata were checked to ensure that each descriptor matched a single reality (e.g. ‘dry’ was found to refer to ‘hay’ or to ‘dehydrated’). ANOVA was used for this purpose. For each descriptor, main chemical components (e.g. crude protein (CP), which is available for most samples) were taken as the response and the source of data as the factor (it is assumed that each source used a single descriptor for each reality). Cases displaying a significant effect (P < 0.05) were checked manually. Finally, an ad hoc strategy for duplicate detection was designed following Hernández and Stolfo (Reference Hernández and Stolfo1998). All the numeric information associated with a sample was synthesized into a key variable (KV) using the equation KV = 1 × (value first variable) +2 × (value second variable) + … + n × (value nth variable). Samples were then ordered by KV value, checking those cases where interstitial linearity (the distance from one case to the next) equaled 0. Sum weighing coefficients in KV equation avoided false positives in samples with missing values for different variables.
Variable selection and transformation
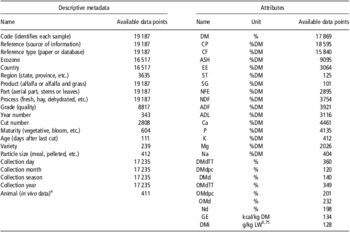
As they store information obtained with different purposes, animal feed databases tend to be quite sparse (loosely coupled). In the alfalfa database, several variables displayed a high rate of missing values being of little value for the objective of this paper. Consequently, variables were excluded a priori wherever <100 data points were available. With a view to enhancing data cleansing and subsequent analysis, the dimensionality of the database was increased as much as possible. To this end, information contained in three metadata called ‘original name’, ‘sample name’ and ‘observations’ in the TRC data warehouse was divided into 10 fields (from ‘product’ to ‘particle size’ in Table 1).
Fields and available data points in the database of alfalfa extracted from the data warehouse of the TRC project

DM = dry matter; CP = crude protein; CF = crude fiber; ASH = ash; EE = ether extract; ST = starch; SG = sugars; NFE = nitrogen-free extract; Ca = calcium; P = phosphorous; K = potassium; Mg = magnesium; Na = sodium; DMdTT = DM digestibility Tilley and Terry; DMdpc = DM digestibility pepsin-cellulase; DMd = DM digestibility in vivo; OMdTT = OM digestibility Tilley and Terry; OMdpc = OM digestibility pepsin-cellulase; OMd = OM digestibility in vivo; Nd = nitrogen digestibility in vivo; GE = gross energy; DMi = dry matter intake; LW = live weight.
aAll data were obtained from ruminants.
Outlier mining
The classical definition of outlier was considered: ‘an observation that deviates so much from other observations as to arouse suspicion that it was generated by a different mechanism’ (Hawkins, Reference Hawkins1980). This does not imply an error or invalid datum (Mendenhall and Reinmuth, Reference Mendenhall and Reinmuth1971). Several common outlier detection tests available in standard statistical software were used. Special attention was paid to the comparison of univariate and multivariate approaches.
Z-score criterion
This is probably the most widely used test. It involves establishing upper and lower limits of an acceptance interval for data. The Z-score was calculated for each data point as Z-score(x i) = (x i – mean(X))/s.d.(X). All cases with |Z-score| >3 were flagged as outliers (0.26% of data in a normal distribution).
Chauvenet's criterion
This test, developed by Chauvenet (Reference Chauvenet1960), uses normal distribution to calculate the probability that the data point furthest from the mean actually has the assigned value, and that probability is multiplied by the number of data points; if the result is <0.5, the suspect data point is flagged as an outlier. The process is then repeated until no further outliers are detected.
Regression residuals (RegR)
As the values for some attributes measured in feedstuff are interrelated, regression can be used as a mean of detecting outliers (Sauvant et al., Reference Sauvant, Tran, Heuzé, Bastianelli and Archimède2010). Therefore, regressions were run for the most closely related pairs of variables (minimum r = 0.5), and the Z-score criterion was applied to the studentized residuals.
Second principal component (PC2)
Jiménez-Márquez et al. (Reference Jiménez-Márquez, Lacroix and Thibault2002) proposed this method. The transformation of data into principal components orthogonalizes the variance associated with data; as a result, the first component may be assumed to represent the general tendency, whereas the remaining ones represent the deviation with respect to that tendency. Principal components were calculated for the most closely related pairs of variables (minimum r = 0.5), and the Z-score criterion was applied to the second component.
Adjusted Wilks’ method (aWilks)
The adjustment of the Wilks (Reference Wilks1963) method developed by Yang and Lee (Reference Yang and Lee1987) and implemented in MATLAB by Trujillo-Ortiz et al. (Reference Trujillo-Ortiz, Hernández-Walls, Castro-Pérez and Barba-Rojo2006) was used. Extreme data points of a normal multivariate sample are flagged as outliers by approximating the squared Mahalanobis distance to a Snedecor ƒ value.
Local outlier factor (LOF)
This algorithm provides a local approach to outlier detection (Breunig et al., Reference Breunig, Kriegel, Ng and Sander2000) on the basis of a comparison of the local density of the neighbourhood of each data point with the local density of its neighbouring MinPts (= 100 in this study). LOF does not view outlierness as a binary property; rather, it focuses on the degree of outlierness, so that LOF values close to 1 represent clear inliers, while increasing values reflect an increasing degree of outlierness. A cut-off value of 2 was selected to flag outliers with a view of comparing the results with those obtained using other algorithms.
When using the multivariate outliers aWilks and LOF, involving the simultaneous analysis of a large number of variables, the sparsity of data in the database meant that the number of variables that could be tested (i.e. those variables with no missing values) was considerably smaller. As a result, optimization of the results required staggered testing, that is, the repetition of calculations for 2, 3, 4, up to n variables. For the purposes of this study, tests were conducted for 4, 6 and 12 variables. Most tests (all except LOF) assume normal distribution. Only those data meeting that requirement using the Anderson and Darling (Reference Anderson and Darling1952) test (P < 0.10) were used. Graphic representations (e.g. qq-graphs and scatter plots) were used to visualize the results of the various tests. Both plots and calculations were carried out using MINITAB (Z-score, RegR and PC2), MATLAB (Chauvenet's criterion and aWilks) and R-project (LOF).
Results
Database
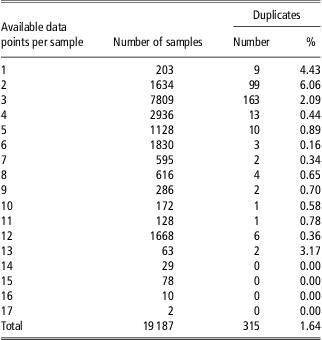
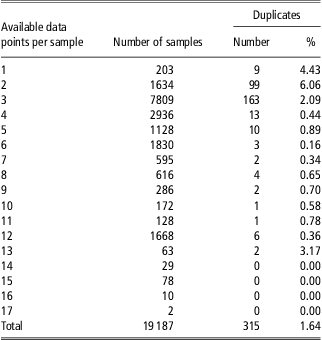
After data integration, selection and transformation as described above, the database used for data cleansing was shown in Table 1. The results for duplicate detection are shown in Table 2.
Duplicates detected in the database of alfalfa extracted from the data warehouse of the TRC project (categorized by number of available data points per sample)
Outlier mining
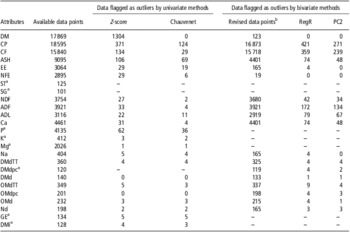
Outliers detected using univariate criteria (Z-score and Chauvenet) and algorithms involving two variables (RegR and PC2) are shown in Table 3. Outliers were detected for 20 variables using Z-score and for 19 using Chauvenet's criterion; the mean percentages of outliers were 2.39% and 0.36%, respectively. Of the 18 variables examined using bivariate methods, RegR detected outliers in 16 and PC2 in 14. Outlier percentages were 2.33% and 1.59%, respectively. Results for aWilks and LOF tests are shown in Table 4.
Outliers detected by univariate and bivariate methods in the database of alfalfa extracted from the data warehouse of the TRC project

DM = dry matter; CP = crude protein; CF = crude fiber; ASH = ash; EE = ether extract; ST = starch; SG = sugars; NFE = nitrogen-free extract; Ca = calcium; P = phosphorous; K = potassium; Mg = magnesium; Na = sodium; DMdTT = DM digestibility Tilley and Terry; DMdpc = DM digestibility pepsin-cellulase; DMd = DM digestibility in vivo; OMdTT = OM digestibility Tilley and Terry; OMdpc = OM digestibility pepsin-cellulase; OMd = OM digestibility in vivo; Nd = nitrogen digestibility in vivo; GE = gross energy; DMi = dry matter intake.
aThese variables were not checked for outliers because they either displayed statistically non-normal probability distributions or were not included in any pair of variables using established correlation criteria (or both).
bThe number of data points revised by bivariate methods for each variable depends on the number of common points and the correlation (must be higher than 0.5) of each variable with the rest.
Outliers detected by multivariate methods in the database of alfalfa extracted from the data warehouse of the TRC project (as a function of number of variables considered by the algorithm)

aWilks = adjusted Wilks; LOF = local outlier factor.
aThe high percentage of missing values in the alfalfa database meant that the number of variables that could be tested with a multivariate method decreased as the number of variables considered by the method increased. For the purposes of this paper, tests were conducted considering 4, 6 and 12 variables (of a total of 25).
bOf a total of 19 187 samples of alfalfa.
Discussion
Heterogeneity
The data integration process highlighted a considerable lack of uniformity in the presentation of feed data. The following were detected:
Synonyms
Especially with regard to units and metadata descriptors, for example, ‘pelleted’ and ‘granulated’ under the metadatum ‘particle size’. The standardization of this information has been widely addressed in the literature (Kalu and Fick, Reference Kalu and Fick1981; Moore et al., Reference Moore, Moser, Vogel, Waller, Johnson and Pedersen1991) but continues to be ignored in practice.
Homonyms
The same descriptors are used to denote different concepts depending on the data source. For example, within the metadatum ‘maturity’, the descriptor ‘first cut’ is used by some sources to denote the cutting carried out for weed control purposes following alfalfa planting; in other sources, this descriptor denotes the first usable harvest of alfalfa, which using the previous scale would be termed ‘second cut’. The same is true for the descriptors of ‘grade’ for dehydrated alfalfa; some sources indicate mean protein content under this heading, whereas other take it to denote guaranteed minimum content.
Overlapping concepts
This is a recurrent issue in metadata descriptors. A good example is the use of ‘bloom’ and ‘early bloom’ under the metadatum ‘maturity’. Overlapping concepts may be encountered in the data themselves, for example, to characterize in vivo digestibility, the concept OM digestibility (OMd) is widely used in Europe, whereas in the United States the different components of the Weende analysis tend to be characterized separately. Integration of all this information in a single scale requires the use of the algorithm OMd = (CP × CPd + CF × CFd + EE × EEd +NFE × NFEd) × 100/(100–ASH). In any case, mining all available metadata and data always entails a certain loss of information, as data always have to be integrated using the less-specific scale. Sometimes, even though data refer to an equivalent concept, they cannot be integrated into a single scale. A good example is provided by the metadata ‘maturity’ and ‘age’, both of which denote the physiological development of the plant, but using incompatible descriptors; a given plant age does not correspond to a single stage of maturity, as many other factors (genetics, soil–climate combinations, etc.) influence plant development (Mueller and Teuber, Reference Mueller and Teuber2007).
Ambiguous concepts
The meaning of some descriptors may be difficult to interpret, for example, the descriptor ‘mature’ within the metadatum ‘maturity’. Abreu et al. (Reference Abreu, Bruno-Soares and Calouro2000) use this term to denote the physiological point at which pods are developed and seeds are milky or soft; yet, as alfalfa is not generally harvested at such an advanced stage, ‘mature’ could be used to denote ‘non-vegetative’, that is, any stage from early bloom onwards.
Duplicates
In samples containing a large number of data points, the exact coincidence of all data points clearly indicates repetition; however, where a sample contains few data points, this may be no more than a chance coincidence, given the size of the database. Although it is not possible to establish a cut-off value for the number of data points per sample, the use of KV and interstitial linearity reduces considerably the number of potential duplicates to manually check.
The duplicates identified did not correspond, as might be expected, to bibliographical information published on more than one occasion or included in more than one database, but rather to laboratory data entered on more than one occasion in databases. Some databases are built up using input from laboratories, few of which operate traceability systems that would prevent the same data being resent to database managers.
Outlier mining
In the case of univariate methods, the Z-score criterion detected more outliers than the Chauvenet's criterion, although when examined variable-by-variable, differences between the two techniques diminished as the number of data points decreased. Differences in the number of outliers detected for the variable dry matter (DM) were particularly large. Graphical analysis showed that most Z-score outliers corresponded to green alfalfa and silage samples, which were less numerous than hay and dehydrated alfalfa samples, the latter displaying much higher DM values (70% to 90% v. 10% to 40%). This highlights the need to take descriptive metadata into account during outlier detection; He et al. (Reference He, Xu, Huang and Deng2004) named this class outlier mining. Regarding multivariate methods, more outliers were detected by RegR than by PC2, and more by LOF than by aWilks.
When selecting a test, other aspects but the number of outliers must be considered, including those relating to algorithm implementation. RegR entails twice as many calculations as PC2, as residuals are not symmetrical, that is, they differ depending on whether each variable is a pair acting as a dependent or an independent variable. On the other hand, calculations using aWM and LOF are simpler than those involved in RegR and PC2: a simple algorithm for the whole database v. different algorithms for each pair of variables. However, the elimination of an outlier detected using a bivariate method entails the loss of two data points, whereas in a test with 12 variables 12 data points will be lost. In addition, as indicated earlier, in this type of test involving the simultaneous analysis of a large number of variables, the sparsity of data in the database meant that the number of variables that could be tested was much smaller. Using bivariate methods, a high percentage of data points were tested for those variables with many common points and a strong correlation with the rest (e.g. ADF), but the number of data points tested for other variables (e.g. DM) was considerably reduced (Table 3). Using aWilks and LOF tests for 12 variables (of a total of 25) meant that barely 8% of samples could be tested (Table 4).
In all cases, the percentage of detected outliers was lower than that reported by other authors (Wang et al., Reference Wang, Reddy and Kon1995; Müller and Freytag, Reference Müller and Freytag2003), usually between 5% and 10%. This is because some of the data in the database had already been cleaned using both formal and non-formal methods. Roughly, 75% of samples were drawn from the AFZ database, for which 10% of data supplied by laboratories had been removed (Tran and Lapierre, Reference Tran and Lapierre1997) before entering the database. Therefore, the outliers detected were additional to that 10%.
Consistency analysis
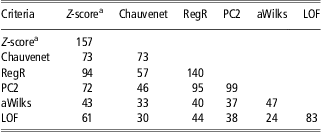
Attention must be paid to the consistency of those data points flagged as outliers by the various methods tested. Table 5 illustrates findings for the subgroup of 1543 samples comprising 12 variables with no missing data. All the outliers detected by the Chauvenet criterion were also detected by the Z-score method; the same is true for PC2 and RegR. Thus, the essential difference between these methods is one of rigor. However, differences between aWilks and LOF were much greater. Although results for aWilks were consistent with those obtained using bivariate methods, LOF detected most of the outliers identified using the other techniques, as well as 14 not detected by them.
Number of samples with common outliers detected by different methods (univariate and multivariate) in the database of alfalfa extracted from the data warehouse of the TRC project
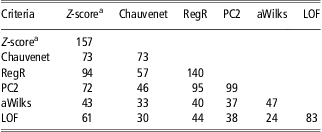
RegR = regression residuals; PC2 = second principal component; aWilks = adjusted Wilks; LOF = local outlier factor.
aOutlier Z-score using class-outlier mining with metadata ‘process’.
The diagonal represents the number of samples in which one or more outliers were detected by each method. The other cells show the number of these samples in which the other tests also detected outliers.
Qualitative characterization of outliers
Analysis of the characteristics of the outliers flagged by the various methods (often involving consultation of the original source) yielded the following classification:
Transcription errors
These are associated with the manual handling of data, the most evident error being the transposition of a decimal point or the use of inappropriate units. Descriptive metadata may also be affected.
Interpretation errors
A good example is related to nutritional attributes, for example, digestibility: often, particularly, if data are collected by inexpert staff, in vivo information is confused with in vitro measurements, or even with data estimated using prediction equations. As most of these errors are not detected by standard outlier tests, ad hoc analysis is required. In this respect, scatter plots can prove to be very valuable (e.g. in Supplementary Figure S1: data from Morocco are calculated, not in vivo), but the systematization of the process requires comparison of general and intra-source correlations.
Procedure issues
The problem sometimes lies in the sampling technique used. Results for ASH, for example, frequently yield a long-tailed distribution in which the highest values are found for soil-contaminated samples. Sometimes, the laboratory procedure itself generates anomalous data. Hatfield and Fukushima (Reference Hatfield and Fukushima2005) listed a range of factors likely to prompt an overestimation of lignin values. Similarly, forage fat content is frequently overestimated because of the inclusion in the ether extract (EE) residue of non-saponifiable substances such as waxes, cutins and chlorophyll (Palmquist and Jenkins, Reference Palmquist and Jenkins2003).
Uncommon values
Not all outliers are errors; sometimes, they merely indicate exceptional data. Outliers of this kind generally appear at the edges of probability distributions. Alfalfa samples (especially hays) with a low leaf-to-stem ratio and very mature samples will appear at the low end of the CP distribution, whereas very young samples, urea-treated silage and high-quality dehydrated alfalfa will appear at the upper end. The anomaly sometimes resides not in the sample itself but in the experimental conditions. In the alfalfa database, for example, low digestibility data points were recorded owing to large intake, and thus faster passage through the digestive system.
Error discrimination
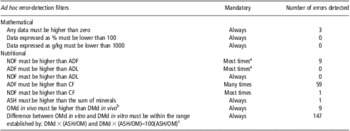
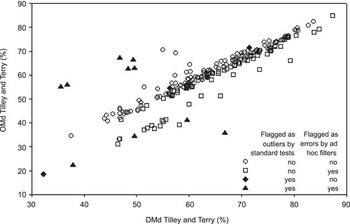
The standard tests evaluated cannot distinguish errors from outliers. However, analysis of the features of the outliers flagged using these tests enabled certain recurring error patterns to be identified. This information plus expert knowledge can be used to design ad hoc filters for the detection and elimination of certain errors. The filters constructed for the studied database are shown in Table 6, indicating the number of errors detected with each filter. These filters represent an improvement with regard to standard outlier tests, as they detect only errors, many of which escape the tests in question: an example is given in Figure 1, regarding the relationship between in vitro OM and DM digestibilities.
Ad hoc error-detection filters designed on the basis of the analysis of the features of outliers flagged by standard methods (univariate and multivariate) in the database containing the information on alfalfa stored in the data warehouse of the TRC project plus expert knowledge of the relationships between variables

CF = crude fiber; OMd = OM digestibility; DMd = DM digestibility.
aIt might be thought that these filters should be set to ‘always’, as these differences represent hemicellulose and cellulose content, respectively, which can never be negative. However, this flexibility seeks to reflect certain constraints affecting Van Soest fractionation: starch retention (solved in part by the addition of amylases), hemicellulose solubilization in NDF residue and pectin/tannin retention in ADF residue. As a result, ADF may be greater than NDF in samples with high pectin and/or tannin content.
bThe difference between the two measurements reflects the in vivo digestibility of ash, which should be very low or non-existent (it may even be negative, because of the mineral supply from endogenous secretions from the digestive tract or to the presence of a mineral source other than the feedstuff evaluated, e.g. a mineral–vitamin corrector).
cThe range is determined by the fact that, for in vitro digestibility, the digestibility of ash may vary between 0 and 100.
Comparison of data points flagged as outliers using standard tests and as errors using ad hoc filters. Many data points are not flagged as outliers by standard tests, but they are flagged as errors by ad hoc filters. Some of these data have a strong influence in the relationship between OMdTT and DMdTT.

Effects on database outputs
Feed tables normally include mean values calculated from the information stored in feed databases. The deletion of errors detected by standard tests and ad hoc filters has little effect on mean values, even in those variables having a high rate of errors. For example, for OM digestibility Tilley and Terry (OMdTT) (25% of errors), the mean value calculated with all data was 62.05%, whereas the mean value for cleaned data was 63.33%. However, deletion of errors may have an important effect on range and s.d. values, especially because of the elimination of extreme data (detected by univariate tests). Prediction equations are another important output of feed databases. In this case, erroneous data may influence the relationships between variables as was shown in Figure 1. Selection of outlier tests should be made according to data use. If data are used only for description purposes (feed tables), univariate outlier tests may be enough. However, if data are used to build models (prediction equations), they must be tested by multivariate and ad hoc approaches.
Heuristic diagram
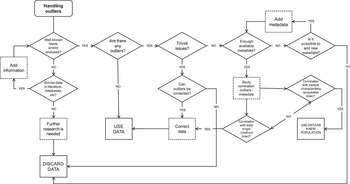
Using the information described in this paper, a heuristic diagram was designed for outlier detection and management (Figure 2). Owing to the space limitations, a single block has been used to represent all the outlier finding tests described in the present study: univariate, multivariate and ad hoc. Outlier detection is not a linear process but algorithms should be run multiple times and their results compared with each other.
Heuristic diagram for the management of outliers and errors in feed databases.

Conclusions
The heterogeneous descriptions of feed data and metadata limits their potential for data mining and meta-analysis purposes, as sometimes it is not possible to integrate all the available data and when possible, it normally implies loss of information.
A wide range of outliers and errors tend to be detected in animal feed databases. Outlier interpretation is often hindered by the lack of metadata, and thus requires consultation of the original data sources, which are not always available. Thus, metadating is of particular importance for the interpretation of exceptional data. In this field, there is a need of comprehensive and well-defined metadata, as well as proper domain ontologies.
The standard outlier tests are unable, used alone, to detect all kinds of outliers: univariate tests are more effective when addressing problems allocated at either end of the probability distribution, whereas multivariate tests focus on the relationships between variables. In addition, the supplementary use of multivariate methods proved effective for locating recurring error patterns, which can be used as a basis for designing ad hoc error-detection filters.
The choice of an outlier test is dictated by the purpose of subsequent analysis. When selecting a test, issues such as rigor and process implementation should be taken into account. Feed data pre-processing cannot be based on a single method, but instead it should consist in a heuristic approach relying on a combination of general-purpose formal statistical methods, experience-based ad hoc algorithms and feedback loops.
Acknowledgements
The help of Alejandro Argamentería-Gutierrez, PhD (Regional Service for Agri-food Research and Development, Asturias) in the interpretation of the characteristics of laboratory measurements is gratefully acknowledged. The authors are also grateful to the Spanish Ministry of Science and Innovation for a technical assistant grant to the Feed Information Service.