Shifts in the pronunciation of individual phonemes often occur in relation to other shifts, indeed on occasions in a causal relationship. The Great Vowel Shift of EnglishFootnote 1 is a canonical example not only of sets of vowels moving in a “procession,” a chain shift, but also of parallel behavior shown by both front and back vowels. Or again, the very well-known parallelism of the centralization of (ay) and (aw) in Martha's Vineyard (Labov, Reference Labov1965). Arguably similar phenomena can be sometimes found in consonant shifts. Harlow (Reference Harlow and Ahlqvist1982) and Grace (Reference Grace, Acson and Leed1985) drew attention to what looks like a drag-chain of the shape: t → k → ʔ → Ø, which occurred at least three times independently in Polynesian languages. Some languages, like Māori, show loss of Proto-Polynesian *ʔ and have retained earlier *p, *t, *k. Others, for example, Samoan, having also lost Proto-Polynesian *ʔ, subsequently shift *k to /ʔ/, and yet others, such as Hawaiian, which have undergone both these changes, then shift *t to /k/.
In this article, we examine a pair of changes in Māori that seem to relate to each other in an analogous manner. These are the progressive fronting of /u/ and /u:/ and increasing aspiration of /t/. Each in itself is not particularly remarkable, and each has parallels in New Zealand English. However, though affecting different subsystems of the Māori phonology, their parallel progress throughout the observable phonetic history of the language suggests an interdependence. In essence, we will demonstrate that contact with English produced a perturbation in the hitherto stable Māori phoneme system. The Māori system has unaspirated stop consonants with no voicing contrasts, whereas English has consonant voicing contrasts and plosive aspiration. Aspiration first increased in /t/ preceding the high front vowels /i:/ and /i/. The high back vowel /u:/ first fronted in English for speakers of Māori and about a generation later in Māori. The front production of /u:/ and /u/ then facilitated aspiration in preceding /t/. Because of the high tongue positions of both /i:/ and /u:/, the aspiration lengthened and became fricative, which in turn further fronted /u:/ and /u/.
BACKGROUND
Māori is the indigenous language of New Zealand, the most southerly language of the Polynesian subgroup of the vast Austronesian language family (Harlow, Reference Harlow2007). It is spoken now, at least to some extent, by some 150,000 people, with 9% of the total Māori population of 565,329 (Statistics New Zealand, 2007) claiming to “speak Māori very well” (Te Puni Kōkiri, Reference Te Puni2007:28). After about 600 years of isolation, Māori has been in increasingly intense contact with English since the end of the eighteenth century, contact that has led, especially in recent decades, to massive language shift.Footnote 2 Although the timing and detail of this shift differed from one area to another, a good, if blunt, summary of the process is that the Māori population was largely monolingual in Māori during the nineteenth century, was largely bilingual throughout the first half of the twentieth century, and is now largely monolingual in English.
The realization that retention of the language was by no means ensured has led, since the 1970s, to wide-ranging and energetically pursued measures for revitalization of the language, especially in the areas of education and media (Harlow, Reference Harlow2007:196–216). The most important of these initiatives have been the kōhanga reo (language nest), preschool education in an environment that is linguistically and culturally Māori, and immersion schooling especially at primary level. A result of these moves has been that, although intergenerational transmission has been almost entirely broken, a large proportion of younger speakers of the language have acquired it as a second language, or at best in parallel with English.
MĀORI PHONOLOGY
The phoneme inventory of Māori is very straightforward.Footnote 3 In most dialects, 10 consonants, /p, t, k, m, n, ŋ, f, w, r, h/, and five vowel qualities, /i, e, a, o, u/ are distinguished. Vowel length is phonemic, though it is only the distinction /a/~/a:/ that bears a considerable functional load. More abstractly, the phonetically long vowels are usually analyzed as sequences of like short vowels, thus [a:] = |aa|. Bauer (Reference Bauer1993:543–545) provides the fullest account of this analysis. Arguments in favor of this view include, for instance, the fact that phonetically long vowels, which are the result of two short vowels coming into contact through morphological processes such as reduplication and derivation, are indistinguishable phonetically from long vowels within morphemes.
In addition, at least within morphemes, sequences of any vowel plus a higher one, as well as the sequence /oe/, form diphthongs. Thus /ai, ae, au, ao, ou, ei, . . . / are all phonemically distinct. There are also a few long diphthongs, combinations of /a:/ and any other vowel, as well as /e:i, o:u, o:i/. Māori does not have a voicing contrast in its stop consonants, which have traditionally been regarded as unaspirated (Bauer, Reference Bauer1993:530; Harlow, Reference Harlow2001:12).
In common with many other Polynesian languages, Māori has very simple syllable structure. Taking V as a variable over the five short vowels, the corresponding long monophthongs, and the diphthongs, syllable structure can be stated simply as (C)V.
THE MAONZE PROJECT
The MAONZE (Māori and New Zealand English [NZE], see Harlow, Keegan, King, Maclagan, & Watson, Reference Harlow, Keegan, King, Maclagan, Watson, Stanford and Preston2009) project has been studying changes in the pronunciation of Māori and the relationship of these changes to NZE through the detailed comparison of three groups of informants, all of whom were recorded speaking in both English and Māori:Footnote 4
MU: A group of seven male speakers of Māori, who were recorded speaking both English and Māori by the Mobile Disc Recording Unit of the New Zealand Broadcasting Service between 1946 and 1948 (see Gordon, Campbell, Hay, Maclagan, Sudbury, & Trudgill, Reference Gordon, Campbell, Hay, Maclagan, Sudbury and Trudgill2004 for details).Footnote 5 These speakers all were born in the late 1800s and had Māori as their first language. For the most part, the recordings are in narrative style, the speakers recounting local history or personal experiences. The speakers were all around 70 years old.
K: Ten male kaumātua (elders) born in the 1920s and 1930s and recorded between 2004 and 2006. All of these have Māori as their first language, and most acquired English only when they started school. The speakers were all around 70 years old.
Y: Ten younger male speakers born in the 1970s and 1980s and recorded between 2004 and 2006. Five of these have Māori as their first language, usually with English acquired simultaneously. The other five are first-language speakers of NZE who acquired Māori from their teenage years onward, achieving a high degree of fluency. The speakers were all around 20–30 years old. We have not separated the first- and second-language speakers of Māori for the work presented here, because their behavior in the variables reported in this study are not significantly different.
METHODOLOGY
The MU data were recorded on equipment used by the New Zealand Army in the Second World War, which had only limited frequency response. Accordingly the data were band-limited to 5 kHz, and subsequently digitized for analysis at 16 kHz.
The K and Y group informants were all interviewed by members of the project or research assistants, and at least 45 minutes of speech in each language were recorded in interview style. Recordings were made on digital recorders (Sony DAT Walkman TCD-D8 with lapel microphones, Sony ECM-T145); the original signal was resampled to 20 kHz or 22.05 kHz for analysis.
The non-Māori speakers used for comparison were taken from the Canterbury Corpus, which is part of the Origins of New Zealand English Project (ONZE, see Gordon, Maclagan, & Hay, Reference Gordon, Maclagan, Hay, Beal, Corrigan and Moisl2007). Those data were collected on Sony analog recorders (TCM-5000 EV) and digitized in the same way as the other modern recordings.
Interviews were transcribed using Transcriber (Boudahmane, Manta, Antione, Galliano, & Barras, Reference Boudahmane, Manta, Antione, Galliano and Barras1998–2008) and acoustic analysis was carried out in Praat (Boersma & Weenink, Reference Boersma and Weenink2009). Vowel formants (for both Māori and English) were calculated using the default settings (25 ms analysis frame, Gaussian window, 10 pole linear predictive coding filter). The formant analysis was visually checked and the parameters changed as necessary. Measurements were taken during the steady state of the vowel. If there was no steady state, formant readings were taken at the F2 maximum (and F1 minimum) for front vowels, the F1 maximum (and F2 minimum) for central vowels, and the F2 minimum (and F1 minimum) for back vowels. Thirty tokens of each vowel were analyzed for each speaker. It was not always possible to obtain 30 tokens of the less common vowels, particularly /i:/. All vowels were chosen from stressed syllables with no audible reduction. For the English analysis, all tokens of /u/ before dark /l/ were removed from the analysis. The voice onset time (VOT) in milliseconds is the interval from the release of the stop to the periodic onset of the following vowel. The plosive release was measured from the start of the burst of fricative noise on the spectrogram and the time waveform, and the voicing onset was determined by the start of the vertical striations in the spectrogram, and periodicity in the waveform. Where possible, 30 tokens of /t/ were analyzed for each speaker before the vowels /u:/, /u/, /i:/, /i/, /a:/, and /a/. It was rarely possible to find 30 tokens of /t/ before /i:/. All analyzed tokens were word-initial in stressed syllables. Vowel analyses were carried out for all 7 MU speakers, 10 K speakers, and 10 Y speakers. The /t/ analysis was carried out for 4 MU speakers, 6 K speakers, and 9 Y speakers.
PREVIOUS RESULTS
Among the aspects of the phonetics of Māori on which the project has concentrated in trying to trace shifts over the period covered by the data are monophthongs and aspiration of stops.Footnote 6
Monophthongs
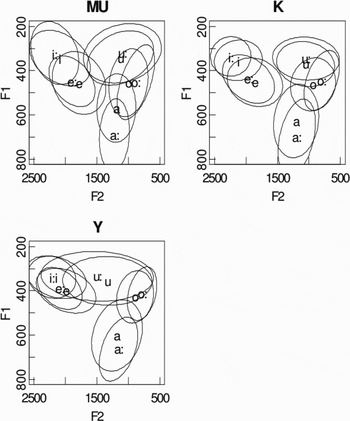
Over the period under study, there have been significant shifts in the pronunciation of the 10 monophthongs. Figure 1 shows the centroid vowel plots and ellipses (containing 95% of the data) for these vowels in the speech of the MU, K, and Y speaker groups.
Centroid and ellipse plots of the F1–F2 values in hertz for the short and long vowels for MU, K, L1Y, and L2Y speaker groups. Adapted, with permission, from Harlow et al. (Reference Harlow, Keegan, King, Maclagan, Watson, Stanford and Preston2009).

Comparison of the three groups of speakers in Figure 1 reveals a number of differences. Particularly in the front vowels, the short vowels become more peripheral and thus approach their long congeners in quality. In fact, this movement is accompanied by a reduction in the quantitative distinction as well, which is found in all cases except between /a:/ and /a/ (Harlow et al., Reference Harlow, Keegan, King, Maclagan, Watson, Stanford and Preston2009). At the same time, both /e:/ and /e/ are raised toward the high front vowels. Most salient and important for the present discussion is the marked fronting of /u:/ and /u/, with /u:/ actually “overtaking” the shorter vowel.
Aspiration of stops
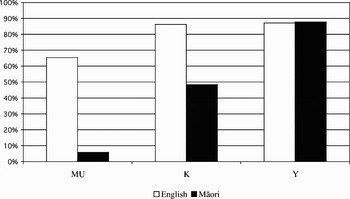
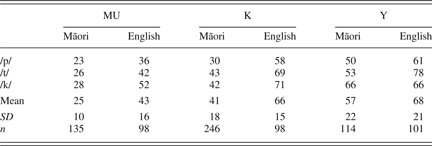
An earlier study (Maclagan & King, Reference Maclagan and King2007) analyzed the VOT and the percentage of audibly aspirated stops for /p, t, k/, the three stops of Māori, in the speech of one speaker from each of our MU, K, and Y groups. The three speakers were typical of their groups and of the appropriate group in the population as a whole. The average VOTs were determined by an acoustic analysis of 792 tokens (see Table 1) and the degree of aspiration was estimated via auditory analysis carried out on 8193 tokens (see Figure 2).
Percent aspirated tokens for /p, t, k/ for one representative speaker from the MU, K, and Y groups when speaking in English and in Māori (based on Maclagan & King, Reference Maclagan and King2007).

Voice onset time (VOT) in milliseconds for /p/, /t/, and /k/ in English and Māori for one speaker from the MU, K, and Y groups (from Maclagan & King, Reference Maclagan and King2007)
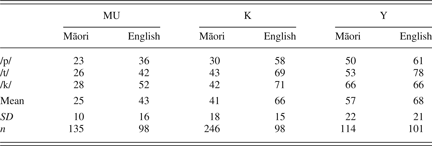
Table 1 compares the VOT of the Māori stops across all vowels with the corresponding English voiceless phonemes in the speech of three representative speakers (Maclagan & King, Reference Maclagan and King2007). The English VOT is always significantly greater than the Māori VOT (except for /k/ for the Y speaker). In addition, the VOT across time increases for both languages. Increasing VOT can be seen as an indication of increasing aspiration (e.g., see the study by Cho & Ladefoged [Reference Cho and Ladefoged1999] of 18 languages that showed that the longer the VOT time, the greater the degree of aspiration).
Aspiration, if it occurs in a voiceless stop, happens after the plosive burst. Figure 2 shows the results of Maclagan and King's (Reference Maclagan and King2007) auditory analysis of the percentage of the three speakers' voiceless stops that were audibly aspirated. A comparison of the speakers showed a progressive increase for all three stops from very little in the Māori of the MU speaker to a level comparable with contemporary NZE in the Y speaker. Although the MU speaker clearly has markedly different degrees of aspiration with these consonants across his two languages, the Y speaker's pronunciations are much closer to each other, most likely reflecting influence from his English on his Māori.
Maclagan and King (Reference Maclagan and King2007) did not make a distinction between aspiration and affrication. Although we similarly do not make such a distinction in the acoustic analysis presented in the present article, we noted auditorily that as VOT increased, the sound became audibly affricated. We have not yet made any attempt to determine the VOT value at which sounds become perceived as affricated rather than simply aspirated.
THE PRESENT STUDY
VOT for Māori speaker groups
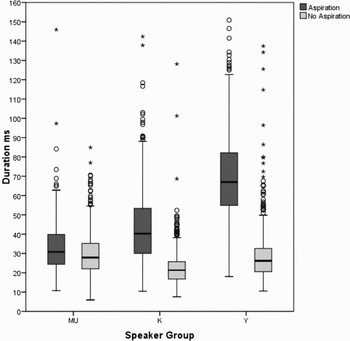
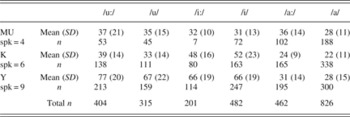
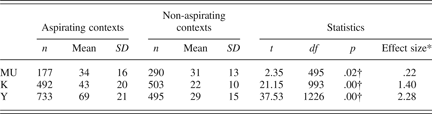
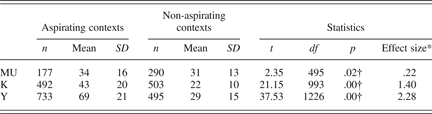
For the present study, tokens of /t/ occurring word-initially before, respectively, /u:/, /u/, /i:/, /i/, /a:/, and /a/, were collected from four MU, six K, and nine Y speakers. These vowels were chosen on the basis of the different VOT values found in Maclagan and King (Reference Maclagan and King2007) and shown in Table 1. Table 2 shows the means, standard deviations, and number of tokens for each of the six environments across the three groups.Footnote 7Table 3 is a summary of these data, collapsing sequences of /t/ followed by /i:/, /i/, /u:/, and /u/, as “aspirating contexts” and /t/ followed by /a:/ or /a/ as “nonaspirating contexts.” Table 3 shows VOT increasing steadily across aspirating contexts from the MU to the Y speakers, and Figure 3 shows the same data in graph form. From Table 2, however, we note that the VOT increase for the K speakers is carried by /i:/ and /i/, and that VOT values for /t/ before /u:/ and /u/ remain similar for the K and MU groups.
The VOT values for /t/ in milliseconds before Māori vowels that promote aspiration (dark gray) and vowels that do not promote aspiration (light gray). The lines in the centers of the boxes represent the median duration values in milliseconds, the boxes enclose the upper to the lower quartiles, and the circles represent tokens beyond the 95th and 5th percentiles.

VOT values in milliseconds for /t/ before different vowels for the three groups of speakers (spk is the number of speakers in each group, and n is the number of tokens)

VOT values in milliseconds for /t/ before vowels that promote aspiration and vowels that do not promote aspiration for the three groups of speakers
*Cohen's d; †statistically significant.
The difference in VOT in the two contexts is significant for all three groups of speakers, but the effect sizes (Cohen's d) show that the VOT is considerably longer for /t/ in aspirating contexts in the speech of the two more recent groups. Notably, although the difference is significant for the two contexts, the effect size for the MU speakers is very small. This increasing VOT duration, though already evident in the K group, accelerates between that group and the younger one, and indicates increasing aspiration. Figure 3 shows this result clearly.Footnote 8
Fronting of /u:/ and /u/
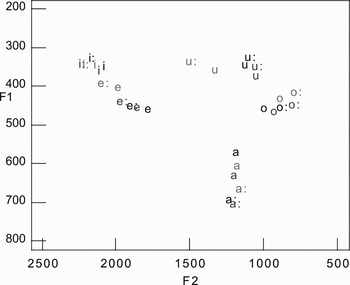
At the same time (as already noted briefly), the phonemes /u:/ and /u/ are increasingly fronted. Figure 4 displays the means of the three speaker groups for the 10 long and short vowels. Among the other shifts visible in this figure, perhaps the most salient is the very much fronter pronunciation of these two sounds in the younger speakers than in the K and MU groups.Footnote 9
Centroid plots of the F1–F2 vowel spaces in hertz of the MU (black), K (dark gray), and Y (light gray) speakers.

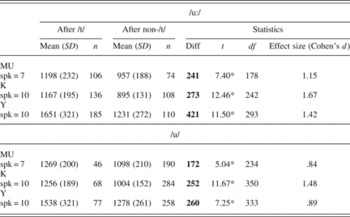
In all three groups, the fronting is more advanced after /t/. Table 4 reports the mean F2 values in hertz for the two phonemes following /t/ and following all other consonants. In addition to the overall /u:/~/u/ fronting shown in Figure 4, it can be seen from Table 4 that the fronting is more advanced following /t/. The differences, which are all significant (with p < .001 and large effect sizes in each case), increase across the speaker groups and are most marked for the younger speakers.
Mean F2 frequencies in hertz for each speaker group for /u:/ and /u/ following /t/ and following other consonants

*All t tests are significant (p < .001) and all effect sizes are large.
Summary of Māori data
The observations so far reported show the following developments over time:
the VOT of /t/ increases before the phonemes: /i:/, /i/, /u:/, /u/;
the difference in VOT before these sounds and /a:/~/a/ is significant for all groups;
/u:/ and /u/ increase in F2 frequency and therefore move forward;
/u:/ and /u/ move further forward after /t/ than in other environments;
this further advancement after /t/ is significant in all groups.
NEW ZEALAND ENGLISH
As was adumbrated previously, similar shifts are observable in the variety of English spoken in New Zealand (NZE) over the same time period. However, the details differ to the extent that the developments in Māori cannot simply be regarded as just interference. The existence of the Mobile Unit tapes, of our own recordings of our informants speaking English, and of the Canterbury Corpus (which is part of the ONZE Project [Gordon et al., Reference Gordon, Maclagan, Hay, Beal, Corrigan and Moisl2007]) allows the comparison not only of the two languages spoken by our informants, but also of their English with that of contemporary non-Māori speakers.
Fronting of /u:/, goose, in New Zealand English
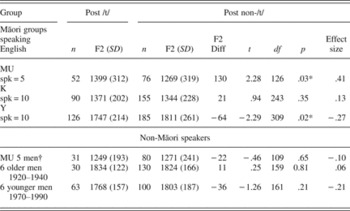
The NZE vowel phonetically closest to Māori /u:/ and /u/ is /u:/, the one usually labeled goose in the Wells (Reference Wells1982) system. To make it clear which language is being referred to, we will use goose for the NZE vowel and /u:/ and /u/ for the Māori vowels in this section. Table 5 displays the mean F2 values for this vowel in the English of our Māori informants and in corresponding groups of monolingual English speakers.Footnote 10 Two environments are compared in parallel with the Māori data: instances of goose following /t/, and instances of goose elsewhere. We focus on the F2 values, because these are relevant to the fronting observed in both languages. From this table it will be seen that in both sets of speakers, goose has become increasingly fronted over time, though the Māori K speakers seem to be about a generation behind their monolingual contemporaries. Strikingly, however, there is no significant difference in the frontness of goose in the two environments for the non-Māori speakers. For the Māori MU speakers only, goose is significantly more fronted after /t/ than other consonants (p < .03), and for Y speakers, goose is actually more fronted after other consonants than after /t/.
Mean F2 frequencies in hertz of goose/u/ vowels after /t/ and non-/t/ for English (all tokens preceding dark /l/ have been removed)

*Significant, p < .05. †The formant values for the non-Māori MU speakers have been normalized. Other formant values are not normalized.
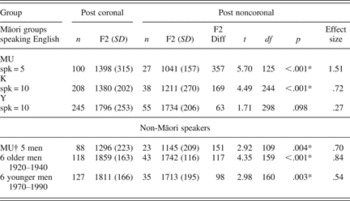
From the numbers of tokens analyzed in Tables 4 and 5, it is clear that there are many more examples of /u:/ and /u/ after /t/ in Māori than there are of goose after /t/ in English. In addition, the phonetic context where /u:/ is most likely to be fronted in English, after /j/, is not included in the data in Table 5. For both languages, we redid the analysis with the tokens divided between coronal and noncoronal environments. In Māori, the results were not significantly different for /u:/ and /u/ from those shown in Table 4 for any of the Māori speaker groups. That is, F2 values of /u:/ and /u/ do not differ significantly when tokens after /t/ are compared with tokens after all coronal consonants (/t/, /n/, /r/). Table 6 shows the results for the English data when goose vowels are divided between coronal and noncoronal environments. A comparison of Tables 5 and 6 shows that for all speaker groups except the MAONZE MU speakers, goose is fronter after all coronals than after /t/ alone. For all speaker groups, goose is farther back after noncoronal consonants than after all consonants except /t/. For all speaker groups, the differences between goose F2 after coronals and noncoronals is greater than the differences after /t/ and non-/t/. These differences are significant for all groups. A comparison of the F2 frequencies of goose after /t/ in Table 5 with goose F2 frequencies after noncoronals in Table 6 shows that goose is fronted after /t/. However, whereas /t/ is the most fronting context for /u:/ and /u/ in Māori and for the Māori MU speakers' goose in English, other coronals front goose more than /t/ in English for the other speakers.
Mean F2 frequencies in hertz for goosefollowing coronal and noncoronal sounds For English (all tokens preceding dark /l/ have been removed)

* p < .01. †The formant values for the non-Māori MU speakers have been normalized. Other formant values are not normalized.
Aspiration of /t/
We have not carried out VOT measurements for the non-Māori speakers reported on here. Nor, apart from the data presented in Table 1 and Figure 2, have we analyzed the VOT in English for the Māori speakers. Previous research suggests that VOT is greater in English before high vowels than before mid or low vowels with vowel duration not explaining this effect (Klatt, Reference Klatt1975).
DISCUSSION
Both aspiration of voiceless stops and increasing fronting of high rounded vowels occur in NZE and can be observed in Māori. However, although these phenomena appear quite independent of each other in English, in Māori there is a mutual relationship: fronting of /u:/ and /u/ is markedly greater after /t/ than in other environments, but fronting of goose shows no such relationship. Conversely, increasing aspiration of Māori /t/ over the period under study occurs significantly more often before high vowels than elsewhere.
The MU and K speakers were recorded when they were considerably older than the Y speakers. Therefore, it is necessary to eliminate age as a source of the observed changes in VOT. It has been noted that both VOT mean (Morris & Brown, Reference Morris and Brown1987) and variability (Morris & Brown, Reference Morris and Brown1994) increase with speaker age. However age can be ruled out as a source of the observed VOT changes across the speaker groups because the MU and K speakers have considerably shorter mean VOT than the Y speakers do, and the standard deviations in Tables 1 and 2 show their VOT variability is similar to that of the younger speakers. The observed VOT differences between the older and younger speakers are thus even more notable because they are the reverse of what would be expected from the effects of aging.
The observation that the two developments in Māori are mutually dependent in ways that are not found in the English of parallel groups of speakers suggests that what is seen for Māori is not simply a case of English interference over the generations of speakers who saw increasingly intense contact between the two languages. However, the current results suggest that the general increase in VOT seen in Māori may indeed reflect influence from NZE. From Tables 2 and 3, it can be seen that VOT times for /t/ hardly differ according to the following vowel for the MU group of MAONZE speakers. For the K speakers, VOT has increased for /t/ when it is followed by /i:/ and /i/, but not when it is followed by /u:/, /u/, /a:/, or /a/. This indicates that aspiration increased first in Māori when /t/ was followed by high front vowels.
Tables 5 and 6 show that the English of the MU and younger speakers, both Māori and non-Māori, have similar F2 frequencies overall for goose, with the younger speakers' goose much more fronted. However the K speakers lag behind their non-Māori age contemporaries. This would seem to indicate that non-Māori speakers of the K generation are leading with goose fronting, and that /u:/~/u/ fronting in Māori potentially reflects influence from NZE. However, the K speakers, who significantly front /u:/ and /u/ after /t/ in Māori, do not show similar goose fronting after /t/ in their English (see Tables 4 and 5).
Labov's Principle III of vowel change indicates that in chain shifts, back vowels move to the front (Labov, Reference Labov1994:116) with the high back vowel being particularly subject to such movement.Footnote 11 Labov (Reference Labov1994:139) referred to a shift in Parisian vernacular French, in which /u/ is fronted after dentals (e.g., tout ‘all’). Ohala and Feder (Reference Ohala and Feder1994) and Harrington, Kleber, and Reubold (Reference Harrington, Kleber and Reubold2008) showed that /u/ following alveolar stops can be considerably fronted without being perceptually confused with /i/. The alveolar tongue position of /t/ attracts the following vowel forward (Stevens & House, Reference Stevens and House1963:119, 120). Stevens (Reference Stevens, Hardcastle and Laver1997) argued that a constriction in the alveolar region causes a raising of F2 and F3, and therefore, when an alveolar stop precedes a back vowel, the tongue has a long transition from the alveolar to the back vowel. Stevens (Reference Stevens1998:572) indicated that if a front consonant is followed by a back vowel, 100 ms is required before the tongue will reach the appropriate position for the vowel. All Māori short vowels are less than 100 ms in duration, and for the Y speakers many “long” vowels are also less than 100 ms (Harlow et al., Reference Harlow, Keegan, King, Maclagan, Watson, Stanford and Preston2009). Fronting of /u/ following alveolar consonants can therefore be considered at least partly a natural articulatory process.Footnote 12 Because the MU and K speakers still have relatively back /u/ in Māori even after /t/, the fronting process is clearly not inevitable. The question raised is what was the trigger that caused the K and Y speaker groups to front /u:/ and /u/ after /t/ in Māori.
The basic Polynesian five vowel systemFootnote 13 is regarded as particularly stable over time (Krupa, Reference Krupa1982:2, 15). However the changes in Māori over the last 100 years have led to a system that is potentially unstable (see Harlow et al., Reference Harlow, Keegan, King, Maclagan, Watson, Stanford and Preston2009). With the introduction of English, the Māori people became bilingual, bringing into contact one language where there are only voiceless stops, and one where there are voiced and voiceless stops (as well as fricatives and affricates). This resulted in an abrupt perturbation in the system. The Māori speakers now needed to distinguish between voiced and voiceless consonant pairs for their English, and presumably used aspiration to do this. We see that even the MU speakers produced their English goose vowels farther forward than their Māori /u:/~/u/ vowels. Perhaps with the increased speaker load of having to make the voiced/voiceless distinction in English, it was too much speaker effort to also produce a back /u/ vowel and so /u/ fronted in the alveolar context in their English.
For the MU speakers, VOT values remain similarly short for /t/ with all following vowels in Māori. The K speakers show similar fronting of goose compared with /u:/~/u/ as do the MU speakers (but much less fronting than their monolingual English speaking contemporaries). The K speakers do not show increased aspiration of /t/ with /u:/~/u/, but they do show increased aspiration with the Māori high front vowels /i:/ and /i/. This also can be considered a natural articulatory process. With high front vowels, there is a small articulatory space into which the /t/ is released, so that the burst frequency is higher in frequency and more sibilant than for other vowels (Ohala, Reference Ohala2005:420). Once goose is fronted in English and aspiration is introduced into Māori when /t/ is followed by high front vowels, the stage is set for the fronting of Māori /u:/ and /u/ together with increased aspiration/affrication when /t/ precedes them. As the /u/ vowel is fronted in both English and Māori, the articulatory space into which the /t/ is released is decreased, and the burst frequency will raise in frequency and become more sibilant (Ohala, Reference Ohala2005:420). In addition, the close front tongue position of /i:/~/i/ and of fronted /u:/~/u/, with the highest point of the tongue raised close to the hard palate, will facilitate a more [ʃ]-like quality to the affricate.Footnote 14 Krupa (Reference Krupa1982:21) noted that plosives in Polynesian languages can be somewhat palatalized when followed by the vowel /i/. As /u/ fronts in Māori, even though speakers will still be able to distinguish it from /i/ (Harrington et al., Reference Harrington, Kleber and Reubold2008), the aspiration will become more palatalized, requiring the tongue to be in an even more /i/-like position. Once this happens, the palatalized affrication will help to pull the /u:/ and /u/ vowels even farther forward, leading to the observed relationship between increase in aspiration/affrication and fronting of the /u:/ and /u/ vowels in Māori.
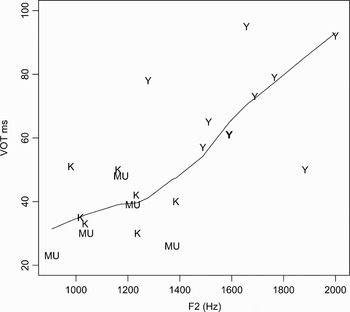
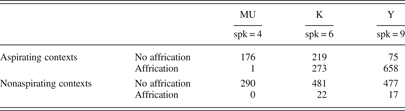
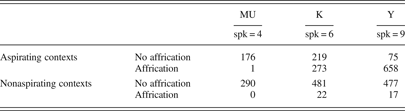
We indicated earlier that we did not attempt to distinguish between /t/ tokens that were aspirated and those that were affricated for the acoustic VOT analysis. However, as we took VOT measurements, we noted auditorily whether we perceived the stop as aspirated [th] or affricated [tʃ]. All speakers' plosives were overwhelmingly heard as [th] before /a:/ and /a/ in the “nonaspirating” contexts, whereas in the “aspirating contexts” before /i:/, /i/, /u:/, and /u/, there was a steady increase across time from only one token heard as affricated [tʃ] for the MU speakers to the vast majority heard as [tʃ] for the Y speakers (see Table 7). The quality of the affrication changed somewhat over time with more [ts]-like affrication for the K speakers and more [tʃ]-like for the Y speakers. Figure 5 summarizes the results analyzed here by showing the relationship between /u:/ fronting and VOT for the individual speakers. There is a significant correlation between the mean F2 frequency of /u:/ after /t/ and mean VOT (ρ = .706, p = .0003).
Correlation between VOT in milliseconds of /t/ and F2 frequency in hertz of /u:/ after /t/ for individual speakers. The line is a parametric scatter plot smoother. The correlation is significant (ρ = .706, p = .0003).

Number of /t/ tokens in Māori that were audibly affricated for all speaker groups
CONCLUSIONS
The two shifts discussed in this paper, /u/ fronting and /t/ aspiration/affrication, are now prominent features of modern Māori pronunciation, to the point that other Polynesians, such as Hawaiians, whose languages have not undergone analogous changes, occasionally remark on them. We have tried to show that though the shifts parallel features and contemporary developments in NZE, the details of their progress in Māori and their simultaneity point to a mutual reinforcement and interdependence rather than simple interference from NZE. Natural articulatory accounts are available for the position that these two shifts have facilitated each other. Māori, like other Polynesian languages, had retained back /u:/ and /u/ vowels, even after alveolar consonants, as is seen in the oldest group of speakers analyzed. Alveolar consonants facilitate fronting of high back vowels, and the oldest group of speakers show some fronting of these vowels after alveolar consonants in both their Māori and their English. This study suggests that, once Māori speakers produced aspirated and unaspirated stops in English, aspiration increased in the previously unaspirated Māori stops, especially with high front vowels. Once the high back vowels front, this in turn narrows the space into which the /t/ is released and thus facilitates aspiration that, with greater length and the tongue being closer to the hard palate for front /i:/ and fronted /u:/, is now heard as affrication. The fronting of the Māori high back vowels and the increasing aspiration/affrication of /t/ in Māori are thus mutually interdependent processes, which, though triggered by interaction with English, are not simply imported from English.