Clays are among the most important raw materials used in the fabrication of ceramic products (Norton, Reference Norton1970; Burst, Reference Burst1991; Kamseu et al., Reference Kamseu, Leonelli, Boccaccini, Veronesi, Miselli, Giancarlo and Chinje Melo2007; Vieira et al., Reference Vieira, Sánchez and Monteiro2008). The oldest method of making terracotta objects is simply using one's hands and clay; this technique is still used today in many pottery sites worldwide. After being formed and dried, the pottery is fired to obtain a hard and rigid material. Without the chemical transformations that occur during firing the piece would disintegrate upon contact with water. Firing is usually performed in gas-, coal- or wood-burning kilns. The maximum temperature of the kiln and the duration of firing influence the final characteristics of the object obtained. Thus, the maximum temperature in a kiln is often kept constant for a certain period of time to ensure that the required consolidation in the terracotta is obtained. Due to their complex mineralogical and chemical compositions and the physical characteristics, clays have unique properties that characterize their deposits (e.g. Saikia et al., Reference Saikia, Bharali, Sengupta, Bordoloi, Goswamee, Saikia and Borthakur2003; Vieira et al., Reference Vieira, Sánchez and Monteiro2008; Mitrović et al., Reference Mitrović, Komljenović and Ilić2009; Boussen et al., Reference Boussen, Sghaier, Chaabani, Jamoussi and Bennour2016). By determining the mineralogical, chemical, granulometric and rheological properties of clays, an assessment of the potential industrial applications of these raw materials is achievable (Dondi et al., Reference Dondi, Raimondo and Zanelli2014).
Morocco's pottery is recognized internationally for the specific artistry of the pieces produced in its various regions. The five production centres of Moroccan pottery are Fez, Safi, Sale, Marrakech and Tetouan. In most traditional ceramic sites in Morocco, the quality of the clay raw material and its availability are the guiding factors in the development of this activity. Some pottery sites have high-quality clay, which is reflected in the quality of their products (El Halim et al., Reference El Halim, Daoudi, El Ouahabi, Amekrane and Fagel2018; El Ouahabi et al., Reference El Ouahabi, El Boudour, Daoudi, El Halim and Fagel2019). In other sites, the raw clay material is composed of heterogeneous sedimentary and residual clays with very different colours and textures, in which case potters use mixtures of several types of clay to obtain an appropriate formulation for their manufacture (Daoudi et al., Reference Daoudi, El Boudour El Idrissi, Saadi, Albizane, Bennazha and Waqif2014; El Boudour El Idrissi et al., Reference El Boudour El Idrissi, Daoudi, El Ouahabi and Fagel2018; Hosni et al., Reference Hosni, Daoudi, Remmal, El Boudour El Idrissi, El Ouahabi and Fagel2021). However, in most of these sites, traditional methods of ceramic production that do not take into account these chemical and mineralogical characteristics are still practiced. With the exception of some recent studies on clays from the Tetouan and Meknes areas (El Ouahabi et al., Reference El Ouahabi, Daoudi, De Vleeschouwer, Bindler and Fagel2014) and Marrakech sites (Daoudi et al., Reference Daoudi, El Boudour El Idrissi, Saadi, Albizane, Bennazha and Waqif2014; El Boudour et al., Reference El Boudour El Idrissi, Daoudi, El Ouahabi, Balo Madi, Collin and Fagel2016, Reference El Boudour El Idrissi, Daoudi, El Ouahabi and Fagel2018), very few studies have been conducted on the quality and potential use of Moroccan clays in the manufacture of ceramics. This is true particularly for the site at Fez, which is classified as the earliest site for the manufacture of pottery in Morocco (El Halim et al., Reference El Halim, Daoudi, El Alaoui El Fels, Rebbouh, El Ouahabi and Fagel2020). This site represents the main supplier of clays to other regions in Morocco because its clays are used in several fields such as pottery production, zellige production, the restoration of historical buildings, construction and decoration.
The potters of Fez use a mixture of two types of clays in their pottery manufacture: the so-called smooth clay ARFS and the sandy clay ARFR, both taken from the same Miocene facies from the Benjlikh quarry. Several brief studies have been conducted on these Fez clays, with their characterization differing from one study to another. For example, some studies state that the Fez clays are composed of illite, chlorite, kaolinite and smectite (El Ouahabi et al., Reference El Ouahabi, Daoudi, De Vleeschouwer, Bindler and Fagel2014; Achiou et al., Reference Achiou, El Omari, Bennazha, Albizane, Daoudi and Saadi2016), while other studies have reported that these clays are devoid of smectite and chlorite (Mesrar et al., Reference Mesrar, Lakrim, Akhrif, Raouf and El Aroussi2012, Reference Mesrar, Akdim, Akhrif, Lakrim, El Aroussi, Chaouni and Jabrane2013).
In this work, we have undertaken a detailed study of the sedimentary series of the Fez region; systematic sampling was carried out on a complete geological section of the Miocene series, which is considered as a reference section for the whole region. The aim of this work is therefore to: (1) determine the physical, chemical and mineralogical characteristics of these clays and highlight possible vertical variations in their composition; (2) clarify the geological position of the exploited clays in the sedimentary series of the Fez basin; and (3) determine the ceramic properties of these clays and their potential suitability for various ceramic applications.
Materials and methods
Materials
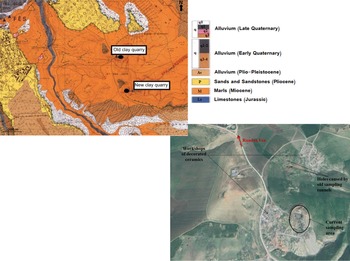
The pottery site of Benjlikh is located in the south-eastern part of the city of Fez. The area consists of sedimentary rocks of Triassic to Quaternary ages overlying a Palaeozoic basement composed mainly of shales, marls, quartzites and limestones (Achiou et al., Reference Achiou, El Omari, Bennazha, Albizane, Daoudi and Saadi2016). The outcrops of the Benjlikh quarry (the main source of the raw material used in the manufacture of Fez ceramics) are located in the eastern part of the Saïss basin. This sedimentary sequence is of Mio-Pliocene to Quaternary age (Fig. 1).
Geological map and panoramic view of the Benjlikh pottery site.

Benjlikh potters use a mixture of two clayey materials to manufacture ceramics both for decoration and for practical utility: upper Miocene marls (ARFS) and marls that mark the basement of the same facies and have different properties (ARFR). These two materials are prepared using traditional methods, being mixed with the feet, hand sieved and fired in traditional wood-burning kilns.
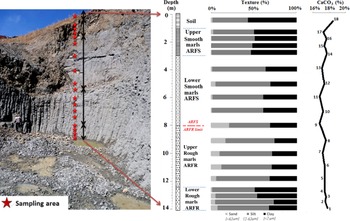
To understand the origin of the variation in the facies in the Benjlikh Miocene marls deposit, 18 samples were collected for study from the most complete section located at the centre of the site (34°01′738′′N, 04°56′655″W), which is considered as a reference section of the Miocene sedimentary series (Fig. 2). Three samples of the raw clay material that is prepared for use in the manufacture of ceramics in the Benjlikh centre were also collected from artisan potters of the Fez site: a sample of smooth grey marl (ARFS), a sample of rough marl (ARFR) and a sample of a mixture of these two materials (ARFM) ready to be used in the preparation of decorative ceramics. The goal of this procedure was to compare the compositions of these samples with those of the samples collected directly from the clay quarry.
Grain-size distribution and CaCO3 content in the marls of the Miocene series of Benjlikh.

Methods
The clay materials were sorted to provide statistically valid samples. First, all samples were dried at 40°C for 48 h, and these were then characterized using X-ray diffraction (XRD), Fourier-transform infrared (FTIR) spectroscopy, particle-size distribution analysis, plasticity measurement and X-ray fluorescence (XRF) chemical analysis.
The mineralogical composition was determined using XRD with a Bruker D8 Advance powder diffractometer with a copper anticathode producing Cu-Kα radiation (λ = 1.5418 Å) bound to a high-voltage generator (40 kV, 30 mA) and coupled with EVA software (Bruker). The lines of the XRD traces obtained were compared with the American Society for Testing and Materials (ASTM) database. The clay fraction (<2 μm) was analysed sequentially under air-dried conditions (N), after solvation with ethylene glycol for 24 h (EG) and after heating at 500°C for 4 h (H). A semi-quantitative analysis was performed according to Cook et al. (Reference Cook, Johnson, Matti, Zemmels, Hayes and Frakes1975) for the total crystalline phases and clay fraction with an estimated uncertainty of ±5%.
The FTIR spectra were collected using a Nicolet NEXUS FTIR spectrophotometer in the wavelength range of 400–4000 cm–1 with a spectral resolution of 4 cm–1. The samples were mixed with KBr in proportions of 1–2 mg of clay material per 150 mg of KBr before analysis.
The particle-size distribution of the samples was measured on bulk sediments using a Malvern Mastersizer 2000 laser diffraction particle analyser coupled with a HydroS wet dispersion unit with a 2000 rpm stirrer. The samples were introduced into 100 mL of deionized water and then placed on a magnetic stirrer for disaggregation. Three measurements were taken for each sample to ensure accuracy. The amount of clay fraction was estimated using methylene blue tests according to standard NF P94-068 and confirmed according to the laser grain-size distribution.
Chemical analysis of the major elements was conducted using XRF with a Panalytical Axios spectrometer equipped with an Rh tube and using argon/methane gas. To determine the loss on ignition (LOI), the samples were heated to 1000°C for 2 h.
Plasticity was determined from the Atterberg limits: liquid limit (LL), plastic limit (PL) and plasticity index (PI). The PI was calculated from the difference between the LL and PL. These tests were conducted using a Casagrande apparatus according to standard NF P94-051.
Results and discussion
Characterization
Description of the section. The studied section belongs to a Miocene sequence of the Saïss basin. The sedimentary series is organized into three sedimentary units separated by regional-scale discontinuities. The lower unit is 5.5 m thick; it is composed of a coarse-grained grey marl. The intermediate unit is composed of a 6 m-thick fine-grained grey marl. The upper unit with a thickness of ~2 m is composed of fine-grained yellow marls.
Particle distribution. The grain-size distribution results are illustrated in Fig. 2. The Miocene sedimentary series of Benjlikh can be subdivided into three clearly distinct levels: a lower sedimentary unit of smooth marls devoid of sand (sand content <2%) that consist, on average, of 35% clays and 63% silts; a middle unit of rough marls composed of 15–20% sand, 55% silt and 25% clay; and an upper unit composed of yellowish marly clay for which the sand content remains negligible (<2%) but the clay content is greater than that of the lower unit, as it represents ~55% of the samples, while the silt content is ~45%.
The data collected from the particle-size analysis were plotted on a McManus ternary diagram (Fig. 3; McManus, Reference McManus and Tucker1988). This diagram depicts the relationship between the three sand, silt and clay components and their impacts on porosity and soil permeability. The ARFS sample was collected at the Benjlikh pottery site, which is part of the smooth marls of the Miocene series, and the samples are plotted in the area of low porosity and permeability due to their high silt and clay contents. The ARFR, ARFM and rough marl samples plot close to the area of moderately high porosity and permeability due to their moderate sand fraction content.
Ternary diagramof the studied marl samples according to McManus (Reference McManus and Tucker1988).

The CaCO3 content in the Benjlikh clays ranges from 16 to 20%, reflecting the abundance of carbonate minerals in the Miocene marls. The upper part is relatively rich in carbonates, which imparts to the soil and the yellow marls specific physical and chemical characteristics and influences their biological activity.
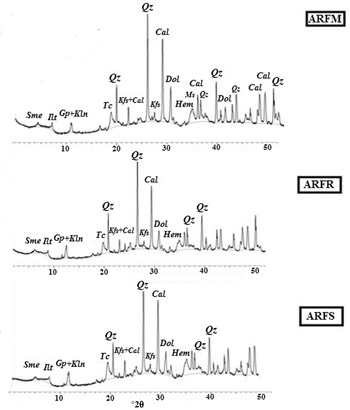
Mineralogical composition. The mineralogical compositions of ARFR, ARFS and ARFM samples show an abundance of quartz (23%) with moderate feldspar contents (9–12%). The calcite and dolomite contents are ~20% and 8%, respectively. Accessory minerals include muscovite, hematite and gypsum (Fig. 4).
Bulk mineralogical composition obtained using XRD. Cal = calcite; dol = dolomite; Gp = gypsum; Hem = hematite; Ilt = illite; Kfs = K-feldspars; Kln = kaolinite; Ms = muscovite; Qz = quartz; Sme = smectite; Tc = total clay.

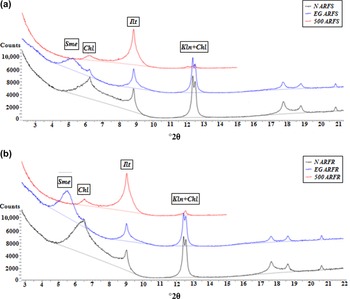
The XRD traces of the orientated clay fractions show that the ARFS and ARFR samples contain illite, smectite and kaolinite with diffraction maxima at 10.1, 17.1 and 7.1 Å, respectively, after EG solvation. These samples also contain small proportions of interstratified illite-smectite (10–14 Å) with traces of chlorite which appears at 14 Å under natural, glycolated and heated conditions (Fig. 5).
XRD traces of orientated clay fractions (air-dried (N), ethylene glycol-solvated (EG) and heated to 500°C) of (a) ARFS and (b) ARFR samples. Chl = chlorite; Ilt = illite; Kln = kaolinite; Sme = smectite.

The FTIR spectra show the presence of Si-O groups at 1008 cm–1 in the ARFM sample (Fig. 6). The absorption band at 873.6 cm–1 corresponds to carbonate bending. The band at 798 cm–1 is related to Si–O–Al stretching and quartz, and the band at 3651 cm–1 is attributed to OH stretching vibrations.
FTIR spectra of the ARFM sample.

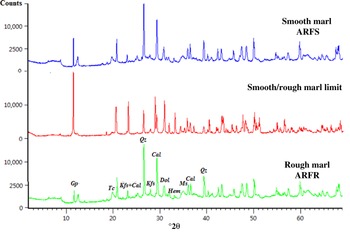
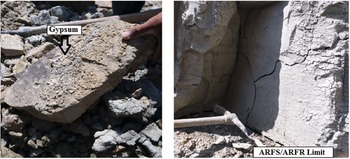
The boundary between the rough and smooth marl facies is characterized by a gypsum bed that was highlighted in the XRD traces (Fig. 7), which attests to a cessation of sedimentation in a marine environment during a period of evaporation (Fig. 8; Auvray et al., Reference Auvray, Homand, Hoxha and Didier2004). The abundance of quartz decreases in this part of the section and then increases in the smooth marly deposits; this indicates the change in facies from the rough marls that are relatively rich in quartz and poor in gypsum compared to the smooth marls. The proportion of dolomite also changed in proportion to that of calcite at this limit, whereas the abundances of these two calcareous minerals are similar in the other levels.
XRD traces showing the transition from rough grey marls to smooth marls in the Benjlikh quarry. Cal = calcite; dol = dolomite; Gp = gypsum; Hem = hematite; Kfs = K-feldspars; Ms = muscovite; Qz = quartz; Tc = total clay.

Gypsum layer at the limit of the smooth and rough marls in the Benjlikh quarry.

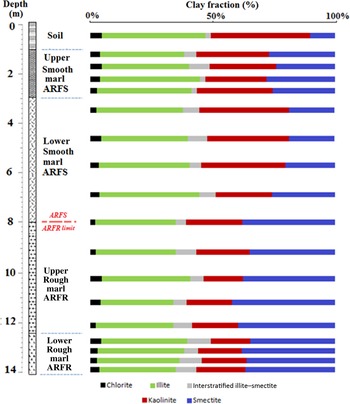
The vertical evolution in the section indicates that there are two levels: a lower level composed of rough marls, characterized by a relatively large smectite content (12–16%) and small kaolinite (5–7%) and illite (11–13%; Fig. 9) contents, and an upper level composed of smooth marls that are characterized by a smaller smectite content (6–10%) and greater illite (9–14%) and kaolinite (12–16%) contents. Chlorite and interstratified clays are present in low concentrations at both levels.
Vertical distribution of the clay fraction in the Benjlikh quarry.

The present study has shown that inside each level the mineralogical and granulometric characteristics are similar. However, the transition from the rough to the smooth level shows clear granulometric and mineralogical differences. The granulometric difference is expressed by relatively small clayey and silty fractions and considerable proportions of sands in the rough marls. The sand fraction decreases clearly in the smooth marls in proportion to the increased silt fraction. On the other hand, the mineralogical difference is expressed by slight variations in the smectite, kaolinite and illite contents between the two levels, in addition to quartz being relatively abundant in the rough compared to the smooth marls.
Chemical composition. The most abundant oxides in the three samples are SiO2, Al2O3, CaO and Fe2O3, while K2O, MgO, Na2O, TiO2 and P2O5 are minor constituents (Table 1).
Elemental composition (%; determined using XRF) of the samples studied.

The predominance of SiO2 and Al2O3 is associated with the presence of illite and kaolinite. The SiO2/Al2O3 mass ratios are 3.3, 4.7 and 4.4 in ARFS, ARFR and ARFM, respectively, indicating the presence of the free quartz in the clay fraction (Konan et al. Reference Konan, Soro, Andji, Oyetola and Kra2010). The SiO2/Al2O3 ratio can provide information regarding the moisture permeability of the samples (Besq et al., Reference Besq, Malfoy, Pantet, Monnet and Righi2003). This ratio is small in all samples and does not exceed 0.3, explaining the low permeability of these materials.
Atterberg limits. The Atterberg limits are represented in the diagram of Holtz & Kovacs (Reference Holtz and Kovacs1981). All samples have high to moderate plasticity (28 < PI < 34; Fig. 10). The mixture of ARFS and ARFR materials tends to have reduced plasticity, so the ARFM sample is placed at the boundary between the moderately plastic and very plastic field (PI = 28). The diagram also shows that the natural clay fraction controls the plasticity of the samples. Samples with larger smectite and illite contents are the most plastic (Hajjaji et al., Reference Hajjaji, Hachani, Moussi, Jeridi, Medhioub and López-Galindo2010).
Representation of the ARFS, ARFR and ARFM samples in the diagram of Holtz & Kovacs (Reference Holtz and Kovacs1981).

Evolution of the mineralogical composition during firing
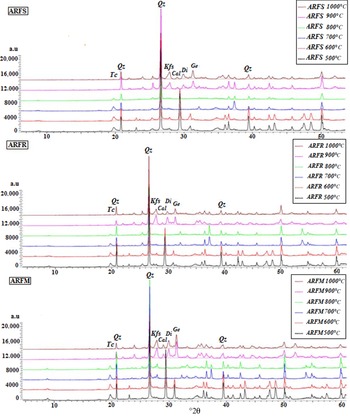
The clay minerals undergo thermal modifications during firing that determine the final properties of the ceramic product (Cultrone et al., Reference Cultrone, Rodriguez-Navarro, Sebastian, Cazalla and De La Torre2001; Hubert et al., Reference Hubert, Caner, Meunier and Lanson2009; El Ouahabi et al., Reference El Ouahabi, Daoudi, Hatert and Fagel2015). The mineralogical changes observed for each firing temperature from 500 to 1000°C differ among the various materials. In carbonate-rich samples such as our three samples, calcite and phyllosilicates disappear at 800 and 950°C, respectively. The first mineral to form at 800°C was gehlenite, followed by diopside and spinel at 900°C. The peak of hematite increases gradually until it reaches a maximum at 1000°C (Fig. 11).
XRD traces of the ARFS, ARFR and ARFM samples at various firing temperatures. Cal = calcite; Di = diopside; Ge = gehlenite; Kfs = K-feldspars; Qz = quartz; Tc = total clay.

Potential of the Fez raw material in the ceramics industry
The pottery produced by the artisans of Fez has both utilitarian (e.g. dishes, vases, pots) and decorative applications (e.g. zellige). Neither of the ARFR and ARFS raw materials is used in isolation. Utilitarian ceramics require a plastic raw material with a mineralogical composition that limits shrinkage after firing and reduces cracking. On the other hand, decorative ceramics must have sufficient compactness that allows artisans to cut zellige tiles using percussion techniques with sharp metal tools to the desired shapes before assembling the final product. The ARFM clays of Fez are suitable for pottery and several domains of traditional ceramics due to their moderate content of minerals with high plasticity, especially smectite.
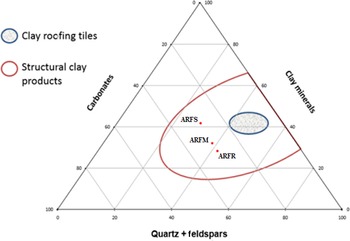
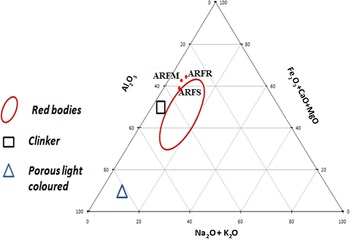
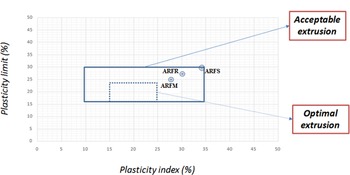
The ternary diagrams (Fiori et al., Reference Fiori, Fabbri, Donati and Venturi1989) show that the ARFR, ARFS and ARFM samples are composed of a mixed aggregate of quartz, carbonates and clays (Figs 12 & 13). Based on the criteria of Fiori et al. (Reference Fiori, Fabbri, Donati and Venturi1989), these samples are most suitable for clay-based structural ceramics, without the requirement of any additives. However, for pottery applications, extrusion is possible (Fig. 14). The PI is related to the difference between the consistency of the plastic behaviour and the LL. In practice, this index should exceed 10%. Clay materials with PI values <10% are not suitable for the production of structural ceramics due to difficulties during their extrusion. Only the ARFS sample is located at the limit of the acceptable extrusion area. This suggests that this sample is unsuitable for extrusion due to its high PI. Therefore, mixtures of ARFS and ARFR clays are necessary to avoid such problems and to obtain adequate ARFM raw materials for ceramics manufacture.
Ternary diagram of Fiori et al. (Reference Fiori, Fabbri, Donati and Venturi1989) based on carbonates, quartz + feldspars and clay mineral composition of the ARFS, ARFR and ARFM samples.

Ternary diagram of Fiori et al. (Reference Fiori, Fabbri, Donati and Venturi1989) based on the Al2O3, Na2O + K2O and Fe2O3 + CaO + MgO composition of the ARFS, ARFR and ARFM samples.

Expected extrusion performance of the ARFS, ARFR and ARFM samples based on the Atterberg boundaries (Marsigli & Dondi, Reference Marsigli and Dondi1997).

Conclusions
The raw materials used in the ceramics industry of Fez are mixtures of two clay marls (ARFS and ARFR) taken from the Miocene grey marl deposits in the Benjlikh quarry. The ARFS clay produces hard specimens after firing that artisan potters would find difficult to handle in order to produce desired shapes and sizes of decorative ceramics (zellige) and pottery. By contrast, the specimens obtained using the ARFR clay are fragile. The ARFM mixture consisting of 75% ARFR and 25% ARFS seems to be the most suitable for meeting the requirements of the Benjlikh potters because of its intermediate characteristics and its stability during firing.
The most abundant minerals in these marls are illite, kaolinite and smectite, with traces of chlorite and of interstratified 10–14 Å clays. Two clay levels can be distinguished: a lower level composed of rough marls, characterized by a relatively large smectite content and small abundances of kaolinite and illite; and an upper level composed of smooth marls characterized by smaller smectite and greater illite and kaolinite contents, while chlorite and interstratified minerals in both levels are present in small concentrations. These two levels are separated by a gypsum layer that marks the transition between the smooth and sandy marl facies.
In the light of these results, the differences in reports regarding the composition of the Benjlikh clays can be considered to be either linked to the level of sampling (smooth or rough) or to the methods of quantification of the mineral phases and the particle-size distribution of these clays.
Financial support
Financial support was provided by the PPR-CNRST program (Grant PPR1/2015/63) and by the ‘Bilateral Cooperation Project Wallonie BruxellesMaroc’ (Grant 2.7) and is gratefully acknowledged. The first author acknowledges the financial support provided by Erasmus+ and Centre Jacques-Berque.