Implications
A study comparing upland and lowland grazing by beef-origin and dairy-origin cattle showed that, as a consequence of lower dry matter intake and fewer animals stocked per hectare, the BW gain of cattle grazing upland grassland was only 15% of those grazing intensively managed lowland pasture, but with 25% more methane emitted per kg of BW produced. Policies that encourage greater use of upland grassland for beef production may be counterproductive, through sacrificing animal production potential and increasing greenhouse gas emissions per kg of product. However, using dairy steers in upland grazing opportunities has potential to enhance ecosystem services.
Introduction
Methane (CH4) emissions represent important losses of ingested dietary energy in ruminant livestock and have been studied in considerable detail for well over 50 years, commencing with a decade of technically challenging and pioneering work at the Rowett Institute as summarised by Blaxter and Clapperton (Reference Blaxter and Clapperton1965), and added to by other research groups (Johnson and Johnson, Reference Johnson and Johnson1995; Beauchemin and McGinn, Reference Beauchemin and McGinn2006; Hart et al., Reference Hart, Martin, Foley, Kenny and Boland2009; Clark, Reference Clark2013). Methane losses account for between 2% and 12% of the gross energy (GE) intake of cattle, as dictated by the type, quality and quantity of feed consumed (Johnson et al., Reference Johnson, Huyler, Westberg, Lamb and Zimmerman1994; Yan et al., Reference Yan, Agnew, Gordon and Porter2000; Yan et al., Reference Yan, Porter and Mayne2009). More recently, the focus of interest in CH4 has shifted towards its contribution to global greenhouse gas (GHG) emissions and, thence, to climate change (Clark, Reference Clark2013). Agricultural systems (particularly those for milk and red meat production) produce ∼17% of overall global anthropogenic GHG emissions with cattle, alone, accounting for 15% of the CH4 emissions (FAO, 2006). Clearly, this is of considerable importance as CH4, when compared on an equal mass basis, is at least 20 times more potent than carbon dioxide as a GHG (Parry et al., Reference Parry, Canziani, Palutikof, van der Linden and Hanson2007).
Accurate CH4 emission data for cattle and sheep are obtainable, albeit at some expense, using whole animal calorimeters (respiration chambers), in which the environment, feeding regime and animal behaviour are all tightly controlled. However, the appropriateness of extrapolating respiration chamber data to cattle grazing outdoors has, rightly, been questioned (Johnson et al., Reference Johnson, Huyler, Westberg, Lamb and Zimmerman1994; Johnson and Johnson, Reference Johnson and Johnson1995). The concern is especially relevant for marginal upland sites where topography, forage availability and its variable botanical and chemical composition, the energy cost of free-ranging foraging behaviour, grazing selection preferences, interactions between animals and fluctuating environmental conditions (warm v. cold; wet v. dry) all influence the quantity of CH4 emitted by an animal.
Marginal land in temperate grassland regions (e.g. United Kingdom and Ireland) includes areas of upland semi-improved and semi-natural grassland. The productivity of semi-natural grasslands is constrained by factors such as climate, soil type, aspect and altitude but such areas are valued also, nationally and internationally, for their biodiversity. It is recognised that cattle have a role in the ecological management of these areas (Wright et al., Reference Wright, Pakeman, Dennis, Dalziel and Milne2006; Dawson et al., Reference Dawson, O'Kiely, Moloney, Vipond, Wylie, Carson and Hyslop2011). Anecdotally, traditional early-maturing breeds of cattle are better adapted to survive and utilise vegetation on the uplands because of their perceived hardiness relative to other beef breeds, but evidence for this is inconclusive (Rook et al., Reference Rook, Dumont, Isselstein, Osoro, Wallis De Vries, Parente and Mills2004). Dairy-origin beef cattle are a significant ‘by-product’ of dairy herds and currently deliver 36% of the carcass output from the Northern Ireland beef industry (Titterington and Morrison, Reference Titterington and Morrison2013) and these cattle could find use also as ‘grazing agents’ to maintain biodiversity in natural upland plant communities.
Typically, semi-natural grasslands are species rich (Pinares-Patino et al., Reference Pinares-Patino, D'Hour, Jouany and Martin2007) with an abundance of plant species with higher cell wall and lignin contents, and lower digestibility, than those species more commonly found in improved grassland (e.g. perennial ryegrass). This suggests that CH4 production by cattle grazing these contrasting grassland types is likely to differ.
The United Kingdom Climate Change Act, 2008 set a target of reducing UK GHG emissions by at least 80% of 1990 levels (baseline) by 2050. To audit progress towards meeting this target, construction of a UK-wide inventory of GHG emission rates (the Agricultural UK GHG platform, 2013) was instigated by the UK Department for Environment, Food and Rural Affairs (Defra) and the governments of the United Kingdom devolved administrations. This inventory will cover a comprehensive range of ruminant production systems including both cattle (dairy and beef) and sheep. The development of the intraruminal SF6 tracer technique by Johnson et al. (Reference Johnson, Huyler, Westberg, Lamb and Zimmerman1994) provided a comparatively inexpensive method by which to estimate CH4 emissions from a large number of grazing animals concurrently. The objective of the current study was to compare CH4 emissions estimated using the SF6 tracer technique, from beef cattle of different origins (dairy v. suckler) grazing on semi-natural upland grassland, with those from similar cattle grazing improved lowland grassland.
Material and methods
The study was conducted on an upland (UG) site at the College of Agriculture, Food and Rural Enterprise (CAFRE) Hill Farm, Glenwherry, Co Antrim, UK (54°50′N, 5°59′W; 312 m a.s.l.), and on a lowland (LG) site at the Agri-Food and Biosciences Institute (AFBI) farm at Hillsborough, Co. Down, UK (54°27′N, 6°4′W; 112 m a.s.l.). The study had the approval of the AFBI Hillsborough Ethical Review Committee.
Experimental sites and animals
The study involved concurrent measurements on similar groups of cattle at the two sites between June and August 2011. The UG site covered 16.7 ha of semi-natural and botanically diverse upland grassland consisting of native species such as Holcus lanatus, Carex spp., Juncus effusus, Cynosurus cristatus, Agrostis capillaris, Deschampsia flexuosa, Phleum pratense, Anthoxanthum odoratum, Nardus stricta and Molinia caerulea, together with patches of Lolium perenne and Trifolium repens. The LG site comprised 3.6 ha of predominantly perennial ryegrass (L. perenne L.). Each of the two sites was divided into four equal-sized paddocks of 4.2 ha (UG) and 0.9 ha (LG). Both sites received nitrogen (N) fertiliser applications in line with good agricultural practice (LG: 220 kg N/ha; UG: 30 kg N/ha).
Forty-eight spring-born beef cattle (year 2010), comprising 24 Holstein–Friesian (HF) steers, 14 Charolais-sired×Limousin×Holstein–Friesian steers (CHM) and 10 Charolais-sired×Limousin×Holstein–Friesian heifers (CHF) of mean initial BW 407 kg (s.d. 29), 475 kg (s.d. 36) and 422 kg (s.d. 50), respectively, were used in the study. The stocking rate (number of animals per hectare) at the UG and LG sites was 1.4 and 6.7, respectively. Cattle were balanced across the two sites (n=24 per grassland type) according to BW, age, breed and gender and were then assigned across the four paddocks at each site, that is, two paddocks for HF (n=6 per paddock), one paddock for CHM (n=7) and one paddock for CHF (n=5). Grazing commenced on 1 June 2011 and continued until 29 September 2011, during which there were three 12-day experimental periods: 20 June to 1 July (E1), 18 to 30 July (E2) and 15 to 27 August (E3). At the end of each period, cattle were re-allocated to another paddock, which they had not previously grazed. During each experimental period, the cattle were weighed on days 2, 3, 4, 9, 10, 11 and 12. A mean BW was calculated for each period and the BW gain (BWG) of each animal over the grazing season was calculated from the slope of the linear regression of BW against time.
The SF6 tracer technique
Methane emissions were estimated using the SF6 tracer technique developed by Johnson et al. (Reference Johnson, Huyler, Westberg, Lamb and Zimmerman1994). Brass permeation tubes (45-mm long, 11-mm diameter and 71 mm2 permeation surface area; P and T Precision Engineering Ltd, Naas, Ireland) were individually imprinted with a unique and indelible identification number. A circular Teflon© membrane (thickness: 0.27 mm) within the screw cap ensured containment of SF6 while affording an essentially constant SF6 release rate (Wills D. personal communication). The rate of SF6 release from each filled permeation tube was determined, before ruminal insertion, by placing each tube in an incubator for 8 weeks at 39°C (to mimic intraruminal temperature) and weighing every 4 days (to 0.1 mg accuracy). The slope of the linear regression of weight against time was the SF6 release rate (mg/day). Tubes with an R 2 of regression <0.995 were rejected. Acceptable tubes were allocated randomly to cattle (one per animal) and placed in the rumen on 26 May using a standard bolus dosing gun. The overall mean SF6 release rate (all tubes) was 2.64 mg/day (s.d. 0.596). Mean release rates for UG and LG cattle were 2.642 (s.d. 0.567) and 2.635 (s.d. 0.636) mg/day, respectively.
Breath sampling
Exhaled and eructated gases were sampled at a point just above the animal’s nostrils through use of a sampling tube connected to an evacuated 2.3-l plastic canister, suspended from a halter fitted to the animal’s head (Supplementary Figure S1). In previous work at this Institute, a filter installed within the sampling line was identified as a cause of troublesome blockages in wet conditions and, accordingly, the nose piece arrangement used in the current study (Supplementary Figure S2) was modified from the original design of Johnson et al. (Reference Johnson, Huyler, Westberg, Lamb and Zimmerman1994), and did not contain a filter.
Sample collection canisters were evacuated to −900 mbar using an oil-vacuum pump, at least 24 h before intended use. Each was tested for vacuum tightness using a Digitron 2022p digital manometer (RS Components, Corby, UK) before deployment. Canisters showing a significant loss of vacuum (>−870 mbar) were rejected. The rest were re-evacuated and their vacuum pressure recorded again, immediately before deployment. They were suspended from a halter on the animal’s head to hang below the jawbone by ∼20 to 30 cm. The time of canister deployment was noted.
Sample flow to the vacuum canister was restricted to 0.35 to 0.45 ml/min by crimping a short section (∼40 mm) of 1/16″×I.D. 0.004 stainless steel tubing (Alltech, Hillsborough, UK) installed within the sampling line. Flow rate was checked during and after crimping using a Model Rz 32908-51 gas flow meter (Cole-Parmer Instruments Ltd, London, UK) with a flow measurement range of 0.1 to 1.0 ml/min. The crimped capillary also helped ensure that collection canister vacuums remained above half of their initial pressure (−900 mbar) until replaced 24 h later.
For each animal, gaseous emissions (diluted in surrounding air) were sampled from days 1 to 4 and from days 8 to 12 of each experimental period. Ambient CH4 and SF6 concentrations were measured in air samples captured in two evacuated canisters installed at each site on an elevated scaffold ∼20 m upwind from the paddocks (to minimise contamination by emissions from the experimental animals). These ‘ambient’ canisters also were replaced every 24 h. At disconnection, the pressure remaining in a canister, and the time of disconnection, were recorded. Canisters that did not have a residual pressure between −750 and −300 mbar were treated as suspect and the sampling equipment was checked for blockages or leaks. Patent canisters were pressurised with N to ~500 mbar, the end pressure recorded and the contents analysed for SF6 and CH4 concentrations within 36 h.
Canister contents were analysed using a Varian 3800 gas chromatograph fitted with a Varian 200 6-port valve and connected to a Varian 1041 auto-injector (all from JVA Analytical, Dublin, Ireland). The instrument was calibrated weekly against three gas standards; low (10 ppt SF6 and 10 ppm CH4), medium (150 ppt SF6 and 100 ppm CH4) and high (300 ppt SF6 and 300 ppm CH4) supplied by Scott-Marrin Inc. (Riverside, CA, USA). The medium standard was run as an additional calibration check at the beginning and end of each day of measurement. At the laboratory, a sample from the canisters was directly injected through a 1-ml sample loop at a flow rate of 30 ml/min, with N as carrier gas, to determine the CH4 and SF6 concentrations simultaneously. This process was and replicate values were deemed acceptable if within a 3% tolerance limit. The CH4 analysis column was a 1.2 m length and 2 mm i.d. stainless steel Porapak N 80-100 mesh column (Varian Inc., Walnut Creek, CA, USA) operated at 70°C. The SF6 analysis column (Varian Inc.) was 1.8 m length×2 mm i.d. and contained a 5 Å (45 to 60 mesh) molecular sieve. It was operated at 120°C. Methane was detected using a flame ionisation detector (FID) maintained at 250°C, whereas SF6 was detected by an electron capture detector set at 300°C (both JVA Analytical). Account was taken of the N dilution factor in the canisters, and CH4 (ppm) and SF6 (ppt) were converted to µg/m3 and CH4 emissions (g/day) per animal were calculated as below (Lassey, Reference Lassey2013):
 $$\eqalign {{\rm CH}_{{\rm 4}}\,\left( {{\rm g}/{\rm day}} \right)=\,&\left( {{\rm CH}_{{\rm 4}} {\rm C}-{\rm CH}_{{\rm 4}} {\rm B}} \right)/\left( {{\rm SF}_{{\rm 6}} {\rm C}-{\rm SF}_{{\rm 6}} {\rm B}} \right){\times}{\rm SF}_{{\rm 6}} {\rm Q}\cr &{\times}{\rm MW\ CH}_{{\rm 4}} /{\rm MW\ SF}_{{\rm 6}} $$
where CH4C=CH4 concentration in the sample canister (µg/m3); SF6C=SF6 concentration in the sample canister (µg/m3); CH4B=CH4 concentration in ambient canister (µg/m3); SF6B=SF6 concentration in ambient canister (µg/m3); SF6Q=SF6 release rate from permeation tube (g/min); MW CH4=molecular weight of CH4; MW SF6=molecular weight of SF6.
Feed intake measurement
Dry matter (DM) intake (DMI) was estimated for each animal during each experimental period using the n-alkane technique essentially as described by Mayes et al. (Reference Mayes, Lamb and Colgrove1986) but with alkanes dosed only once daily (Richmond et al., Reference Richmond, Wylie, Laidlaw and Lively2014). During days 1 to 11 of each experimental period, all 48 animals were intraruminally dosed once daily with two 500 mg C32 alkane impregnated paper boluses.
Alkane bolus preparation
Boluses were prepared in batches of 50 before commencement of the study. Briefly, 50 g n-dotriacontane (C32; Minakem Corp., Beuvry-la-Forêt, France) were dissolved in 450 ml of warmed (60°C) heptane and 5 ml portions of the solution were quickly pipetted into each of 50 pre-dried Rotilabo® cellucotton stoppers measuring 18 mm (bottom)×22 mm (top)×32 mm length (Karl Roth GmbH, Karlsruhe, Germany). During the dispensing process, the n-alkane solution was kept warm. Treated boluses were left upright in a fume hood for ∼30 min before being placed in an oven at 100°C for 20 min, to ensure maximal dispersion of the n-alkane throughout each bolus and the removal of residual heptane. Five boluses from each freshly prepared batch were taken for quality assurance (QA) testing using the same preparation and test protocol as outlined for the herbage and faeces samples (see later). Mean bolus C32 content was 497 mg (s.d. 40.8).
Faecal sampling
A faeces sample (∼200 g fresh weight) was taken per rectum from each animal, concurrently with administration of the n-alkane boluses, during days 8 to 12 of each experimental period. Faeces samples were stored at 4°C and later bulked to provide a 5-day composite sample for each animal, pending analysis for n-alkanes.
Vegetation sampling and analysis
Daily samples of vegetation (∼200 g each and considered representative of the vegetation consumed, based on visual observation of grazing behaviour), were hand plucked from each paddock between days 5 and 9 of each experimental period for n-alkane analysis (Dove and Mayes, Reference Dove and Mayes2006) and for forage quality analysis. Some contamination of vegetation with C32 by faeces deposited during grazing is inevitable and is accepted as ‘background’. However, to eliminate the risk of further contaminating vegetation samples with alkanes, staff involved in dosing C32 boluses and sampling of faeces were not permitted to also sample vegetation on the same day. GE concentrations (MJ/kg DM) were determined by isoperibol bomb calorimetry (Parr Instruments Co., Moline, IL, USA) according to Porter (Reference Porter1992). Nitrogen (N) concentration was determined by the high temperature Dumas combustion technique using a Vario MAX CN analyser (Elementar Analysensysteme GmbH, Hanau, Germany), and CP concentration (g/kg DM) was then calculated as N concentration×6.25. Ash (g/kg DM) was determined after combustion of samples at 550°C for 10 h. Vegetation DM concentration was determined by NIRS using a Foss 5000 scanner (Foss, Warrington, UK) through the AFBI Hillsborough Feeding Information System. Concentrations of NDF and ADF were determined as described by Cushnahan and Gordon (Reference Cushnahan and Gordon1995) using a Fibertec M 1020 hot extractor and 1021 cold extractor (Tecator AB, Hoganas, Sweden).
Determination of n-alkane concentrations
Vegetation and faeces samples were freeze-dried or oven-dried (60°C), respectively, and then hammer-milled to pass a 0.8-mm screen before saponification (at 70°C) and subsequent extraction with heptane at room temperature (modified from Dove and Mayes, Reference Dove and Mayes2006). The concentration of each alkane was determined in 0.5 µl of heptane extract by capillary gas chromatography (Dove and Mayes, Reference Dove and Mayes2006) on a Varian 3800 GC equipped with a Varian CP-8400 auto-sampler (both JVA Analytical) and ZB-1 (30 m, 0.25 mm i.d., 0.25-µ film thickness) coated capillary column (Phenomenex, Macclesfield, UK) and using a FID and 1079 split/splitless injector in split mode (split ratio 50 : 1), both maintained at 310ºC. Helium was the carrier gas (1 ml/min constant flow rate) and the oven temperature was maintained at 290ºC. The GLC was calibrated using a standard solution of synthetic C27 to C34 n-alkanes (Sigma-Aldrich, St Louis, MO, USA) to determine detector response factors. One in every 20 samples was an internal QA sample to ensure that the extraction and chromatographic procedures were thorough and quantitative.
Calculation of feed intake
Feed DMI (kg/day) was estimated using C32 and C33 n-alkane concentrations in the herbage (vegetation) and in faeces, according to the simplified equation of Mayes et al. (Reference Mayes, Lamb and Colgrove1986) below:
 $$\scale91%{{\rm DMI}\,\left( {{\rm kg}/{\rm day}} \right)=\left[ {{\rm D}_{{{\rm 32}}} {\times}\left( {{\rm FC}_{{{\rm 32}}} /{\rm FC}_{{{\rm 33}}} } \right)} \right]/\left[ {{\rm HC}_{{{\rm 33}}} {\minus}\left( {{\rm FC}_{{{\rm 32}}} /{\rm FC}_{{{\rm 33}}} } \right){\times}{\rm HC}_{{{\rm 32}}} } \right]}$$
where FC33 is the faecal C33 alkane concentration, FC32 the faecal C32 alkane concentration, HC33 the herbage C33 alkane concentration, HC32 the herbage C32 alkane concentration (all mg/kg DM) and D32 the dose of C32 alkane (mg/day).
Statistical analysis
All data relating to treatment effects (site and experimental period) for DM, ADF, NDF, GE, ash and CP were tested for normality before statistical analysis by REML repeated measures. Mean DMI and CH4 were calculated for each animal during each period (E1 to E3). After passing a normality test, DMI, CH4 and BWG data were statistically analysed using an auto-regressive model (order 1) in REML repeated measures. All data were also subjected to Fisher’s Protected Least Significant Difference test. All statistical analyses were performed using GenStat 14.2 (VSN International Ltd, Hemel Hempstead, UK) for PC/Windows 7.
Results
Vegetation analysis
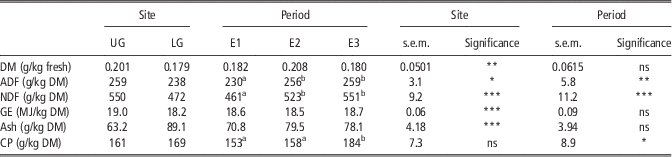
Concentrations of DM, ADF, NDF and GE, when averaged over all experimental periods (E1, E2 and E3) were significantly higher in UG than LG vegetation, whereas ash concentration was lower in UG than LG and CP concentration was similar in each (Table 1). Both ADF and NDF concentrations were lower in both UG and LG during E1 than in E2 or E3 while CP concentrations were lower in both UG and LG during E1 and E2 than in E3 (Table 1). There was no significant difference in DM or ash concentrations between experimental periods, and there were no significant interactions between site and period for any proximate constituent.
Mean proximate chemical composition of the upland (UG) and lowland (LG) vegetation for each experimental period (E1 – June; E2 – July and E3 – August)

DM=dry matter; GE=gross energy; ns=not significant.
a,bE1, E2 and E3 values within a row with different superscripts differ significantly at P<0.05.
*P<0.05; **P<0.01; ***P<0.001.
DM intake
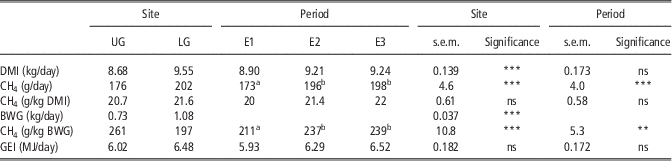
Table 2 shows that estimated DMI (kg/day) when averaged over E1, E2 and E3 all experimental periods, was 10% higher from the LG than UG site. There were no significant differences or interactions in DMI (P>0.05) between breeds, genders or experimental periods.
Mean n-alkane estimated DMI (kg/day), SF6 estimated methane (CH4) emissions (g/day), CH4 emissions as g/kg DMI, daily BW gain (BWG kg/day), daily CH4 expressed as g/kg BWG and GEI g/day of cattle at both sites (UG and LG) over the experimental periods (E1 – June, E2 – July and E3 – August)

DMI=dry matter intake; BWG=BW gain; GEI=gross energy intake; UG=upland pasture; LG=lowland pasture; ns=not significant.
*P<0.05; **P<0.01; ***P<0.001.
Methane emissions
The mean rate of CH4 emission (g/day) was 15% higher at the LG than the UG site (Table 2), with mean emissions across both sites significantly (P<0.001) lower during E1 than in the later periods (173, 196 and 198 g/day for E1, E2 and E3, respectively). There were no significant differences in CH4 g/day (P>0.05) between breeds or genders and there were no significant interactions. Mean within-animal coefficient of variation (CV) for CH4 emissions was 20.3%, whereas between-animal variation in CH4 emissions was greater for cattle grazing on UG than LG (30.8% and 24.2%, respectively).
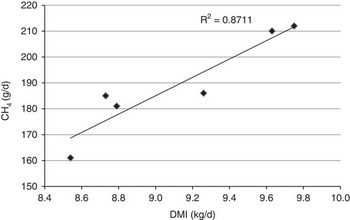
Mean daily CH4 emissions, expressed as g/kg DMI, were not significantly different between the UG and LG sites. Furthermore, there were no significant differences between experimental periods, genders or breeds and no significant interactions for these parameters. The between-animal CVs for CH4 emissions (g/kg DMI) were 21.1% and 20.1% for cattle grazing the upland and lowland grassland sites, respectively. Figure 1 shows a strong linear relationship (R 2=0.8711) between mean DMI (kg/day) and mean CH4 (g/day) emission when treating the mean values for both sites, and over all three experimental periods, as one dataset.
The relationship between mean n-alkane estimated dry matter intake (DMI; kg/day) and mean SF6 estimated CH4 emissions (g/day) by cattle grazing upland and lowland grasslands (n=24 each) during all three experimental periods (June, July and August).

There was no significant difference (P>0.05) between the UG and LG sites in the mean percentage of estimated daily GEI (MJ/day) lost as CH4 (Table 2). Furthermore, there were no significant differences between experimental periods, genders or breeds, and no significant interactions for these parameters.
Animal performance and CH4 emissions
The effect of grassland type on the BWG of cattle within each of the experimental periods could not be tested because BWG was calculated by linear regression of data across the grazing season (as changes in BW were determined only between, rather than within, experimental periods). Comparisons between sites are reported in Table 2, which shows that the mean BWG of animals at the UG site was 48% lower than that of their contemporaries at the LG site. There was no significant effect of breed on performance (P>0.05) at either site. Mean daily CH4 emissions expressed as g/kg BWG were 25% lower in cattle grazing the LG site than for those grazing the UG site (Table 2) but there was no significant breed difference (P>0.05) in CH4 emissions (expressed as g/kg BWG) at either site.
Discussion
Cattle that grazed on LG had greater daily DMI (by 10%), emitted more CH4 per day (by 15%) and had greater BWG (by 48%) over the grazing season than counterparts grazing UG, but origin of cattle (dairy v. suckler) did not influence the measured traits.
The vegetation types identified in the current study differed in fibre content. Although the digestibility of the vegetation grazed at each site was not determined, it is well established that forage digestibility is inversely related to NDF concentration (Jung and Allen, Reference Jung and Allen1995; Bruinenberg et al., Reference Bruinenberg, Valk, Korevaar and Struik2002) so that the greater NDF concentration in the upland vegetation suggests that its digestibility was lower than that of the more intensively managed lowland grassland throughout the grazing period. This is likely to have contributed to the lower DMI by cattle on upland vegetation (Jung and Allen, Reference Jung and Allen1995; Beauchemin and McGinn, Reference Beauchemin and McGinn2006; Decruyenaere et al., Reference Decruyenaere, Buldgen and Stilmant2009).
Non-animal factors known to affect grassland intake include site topography, location of water, sward structure and climatic conditions (Rook et al., Reference Rook, Dumont, Isselstein, Osoro, Wallis De Vries, Parente and Mills2004; Decruyenaere et al., Reference Decruyenaere, Buldgen and Stilmant2009). In the current study, cattle on the UG site were observed to selectively graze predominantly grassy areas within the paddocks. This was reflected in the consistently low sward heights measured in these areas relative to other areas in which sedge, rush and upland grasses predominated (data not presented). Wallis de Vries and Daleboudt (Reference Wallis de Vries and Daleboudt1994) suggested that cattle are more likely to graze patches of short grass because of an inherently higher nutritional value. The contrast in animal performance between the LG and UG sites supports the predictions of Bruinenberg et al. (Reference Bruinenberg, Valk, Korevaar and Struik2002) that a beef animal, initially weighing 300 kg and consuming 6 kg DM/day, would gain 1.05 kg/day if grazing on perennial ryegrass but only 0.85 kg/day if grazing H. lanatus/Agrostis spp., and only 0.65 kg/day if grazing on N. stricta.
Methane emissions (g/day) were lower during E1 than during E2 or E3 but DMI did not differ between periods. However, over the entire grazing season, NDF and ADF concentrations were lower in E1 than in E2 or E3. Several studies have suggested that level of intake rather than digestibility is the main determinant of absolute CH4 emissions (DeRamus et al., 2003; Beauchemin and McGinn, Reference Beauchemin and McGinn2006; Pinares-Patino et al., Reference Pinares-Patino, D'Hour, Jouany and Martin2007; Hart et al., Reference Hart, Martin, Foley, Kenny and Boland2009; Pelve et al., Reference Pelve, Olsson, Spörndly and Eriksson2012; Boland et al., Reference Boland, Quinlan, Pierce, Lynch, Kelly and Purcell2013; Clark, Reference Clark2013).
However, the difference in absolute CH4 emissions between experimental periods in the current work cannot be explained solely by differences in DMI. McCaughey et al. (Reference McCaughey, Wittenberg and Corrigan1999) found significant differences in DMI among cattle grazing swards of contrasting quality, but not between sampling periods, while corresponding absolute CH4 emissions (L/day) differed significantly between sampling periods. In that study, differences in CH4 emissions were explained by changes in nutritive value of the herbage. In contrast, Pinares-Patino et al. (Reference Pinares-Patino, D'Hour, Jouany and Martin2007) associated low CH4 emissions by cattle grazing semi-natural grassland in spring with a lower DMI, but not with NDF intake. In a previous study, in which cattle grazed swards of Timothy of a range of digestibilities over a grazing season, intake of NDF (a partially digestible fraction of the cell wall) was identified as the most important factor in determining CH4 production (Pinares-Patino et al., Reference Pinares-Patino, Baumont and Martin2003). In the current study, mean daily NDF intakes were 4.09 kg (E1), 4.78 kg (E2) and 5.08 kg (E3) across the two grassland types, following the trend in CH4 (g/day) emissions. In the absence of determined values for NDF digestibility, no reliable conclusions can be drawn to explain the commonly observed lower CH4 emissions in late spring and early summer.
Although significant treatment differences for CH4 emissions and DMI did not follow the same pattern, CH4 emissions per unit DM did not differ significantly between grassland types or experimental periods, suggesting that DMI is the primary determinant of CH4 production (Figure 1), followed by quality factors. The absence of a significant difference in CH4 emissions per unit DMI between cattle consuming vegetation differing in nutritive value supports this view. In a study of housed cattle fed herbage of either high or relatively low digestibility (Hart et al., Reference Hart, Martin, Foley, Kenny and Boland2009), CH4 emissions per kg DMI or energy lost in CH4 as a proportion of GE intake did not differ significantly between high and low quality grass (25.6 v. 25.7 g CH4/kg DMI and 9.8% v. 9.9% GEI, respectively), although these authors had hypothesised that the lower digestibility herbage would emit more CH4 relative to intake.
The CH4 emission rates in the current study were lower than those reported by Hart et al. (Reference Hart, Martin, Foley, Kenny and Boland2009) but lie within a range (∼19.0 to 29.0 CH4 g/kg of DMI) collated from an extensive range of other published work (McCaughey et al., Reference McCaughey, Wittenberg and Corrigan1999; DeRamus et al., 2003; Beauchemin and McGinn, Reference Beauchemin and McGinn2006; Ellis et al., Reference Ellis, Kebreab, Odongo, McBride, Okine and France2007; Hart et al., Reference Hart, Martin, Foley, Kenny and Boland2009; Pelve et al., Reference Pelve, Olsson, Spörndly and Eriksson2012); (Boland et al., Reference Boland, Quinlan, Pierce, Lynch, Kelly and Purcell2013; Clark, Reference Clark2013; Jiao et al., 2013). The percentage of GEI lost as CH4 was also within the ranges commonly seen in the literature: 5.9% to 6.7% (Pinares-Patino et al., Reference Pinares-Patino, Baumont and Martin2003), 6.0% to 7.0% (Pinares-Patino et al., Reference Pinares-Patino, D'Hour, Jouany and Martin2007) and 5.6% to 6.1% (Boland et al., Reference Boland, Quinlan, Pierce, Lynch, Kelly and Purcell2013).
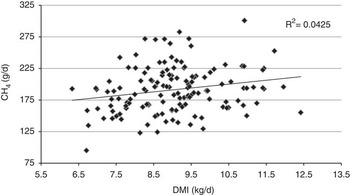
Within-animal and between-animal variation in CH4 emissions is often greater when estimated by the SF6 tracer technique than when measured in respiration chambers (McGinn et al., Reference McGinn, Beauchemin, Iwaasa and McAllister2006; Grainger et al., Reference Grainger, Clarke, McGinn, Auldist, Beauchemin, Hannah, Waghorn, Clark and Eckard2007; Pinares-Patino and Clark, Reference Pinares-Patino and Clark2008). In the current study, between-animal variation in absolute CH4 emissions was greater than within-animal variation, in line with several other studies, for example, Grainger et al. (Reference Grainger, Clarke, McGinn, Auldist, Beauchemin, Hannah, Waghorn, Clark and Eckard2007) and Pinares-Patino and Clark (Reference Pinares-Patino and Clark2008), but overall CVs of 30.8% and 24.2% (for emissions from animals grazing UG and LG, respectively) were greater than the range of 6.0% to 19.6% reported by others (McGinn et al., Reference McGinn, Beauchemin, Iwaasa and McAllister2006; Grainger et al., Reference Grainger, Clarke, McGinn, Auldist, Beauchemin, Hannah, Waghorn, Clark and Eckard2007). The longer experimental period and the more variable diets used in the current study are likely to each have contributed to the higher CVs but when CH4 emissions were expressed as g/kg DMI, the CVs were reduced to about 20% for cattle on each site, indicating that DMI is responsible for some of the variation in CH4 emissions (Cottle et al., Reference Cottle, Nolan and Wiedemann2011; Clark, Reference Clark2013). However, the association between DMI (kg/day) and CH4 emissions (g/day) for each animal in each period was poor (Figure 2; R 2=0.043). This contrasted with the strong relationship between mean DMI (kg/day) and mean CH4 emission (g/day) over all three experimental periods (Figure 1) and suggests that other factors, such as variable weather conditions (wind, rain, etc.) may affect the efficiency of capture of breath samples and thereby contribute to a greater variance in the determination of methane emissions by the SF6 tracer technique.
The relationship between n-alkane estimated dry matter intake (DMI; kg/day) and SF6 estimated CH4 emissions (g/day) for individual cattle grazing upland and lowland grassland (n=24 per site) during all three experimental periods (June, July and August).

The current study found no significant difference between the performance of dairy origin cattle (Holstein–Friesian steers) and suckler origin cattle (Charolais crossbred steers and heifers) on either the upland or lowland grasslands and lends support to the conclusions of Fraser et al. (Reference Fraser, Davies, Vale, Nute, Hallett, Richardson and Wright2009) that pasture type has a greater impact than breed on beef cattle performance.
On a per unit area basis, the UG site produced only 15% of the BWG achieved from the LG site (128 v. 870 kg/ha, respectively), resulting in 25% greater CH4 emission intensity from UG than LG. This apparent advantage of LG may be diminished when fuller account is taken of all environmental impacts and all ecosystem services and inputs. Intensive lowland systems require higher inputs than upland systems, such that the carbon footprint of their product is usually greater than from an upland system (Edward-Jones et al., Reference Edward-Jones, Plassmann and Harris2009). In any case, and irrespective of breed, cattle provide beneficial ecosystem services while grazing upland semi-natural vegetation, and this must also be taken into account (Wright et al., Reference Wright, Pakeman, Dennis, Dalziel and Milne2006; Dawson et al., Reference Dawson, O'Kiely, Moloney, Vipond, Wylie, Carson and Hyslop2011).
This study provides baseline data on CH4 emissions from beef cattle grazing on upland grassland relevant to UK beef production systems (Agriculture UK GHG platform; Projects AC0114 and AC01115). The information provided will contribute to life cycle assessments of upland grazing scenarios on which judgements can be made, balancing sacrificed beef production, ecological benefits and contribution to emissions, all relative to lowland conditions.
Acknowledgements
This work was funded by the UK Department for Environment, Food and Rural Affairs (Defra), the Scottish Government, the Northern Ireland Department for Agriculture and Rural development (DARD) and the Welsh Government, as part of the UK’s Agricultural GHG Research Platform (www.ghgplatform.org.uk). Financial support for a postgraduate student (A.S.R.) was provided by AgriSearch.
Supplementary material
To view supplementary material for this article, please visit http://dx.doi.org/10.1017/S1751731114002067