Introduction
Epidemiological studies have reported that higher education (HE) is associated with a reduced risk of incident Alzheimer's disease (AD) (Letenneur et al., Reference Letenneur, Commenges, Dartigues and Barberger-Gateau1994; Stern et al., Reference Stern, Gurland, Tatemichi, Tang, Wilder and Mayeux1994; Evans et al., Reference Evans1997; Qiu et al., Reference Qiu, Backman, Winblad, Aguero-Torres and Fratiglioni2001), suggesting that education may provide protection against the onset of the disease (Stern et al., Reference Stern, Gurland, Tatemichi, Tang, Wilder and Mayeux1994). This protective effect of education is supported by the cognitive reserve (CR) hypothesis (Stern, Reference Stern2002; Scarmeas and Stern, Reference Scarmeas and Stern2004). CR refers to the ability of the brain to compensate for damage by using pre-existing cognitive processing approaches or by recruiting compensatory approaches (Stern, Reference Stern2002, Reference Stern2009). Therefore, an individual with HE should cope better with an equivalent level of pathology than an individual with lower education (LE), which in turn, should delay the clinical expression of AD.
Once AD clinically manifests, brain pathology is already quite advanced in AD patients with HE (HE-AD), more so than those with LE (LE-AD) (Wilson et al., Reference Wilson, Bennett, Gilley, Beckett, Barnes and Evans2000; Stern et al., Reference Stern, Albert, Tang and Tsai1999; Scarmeas et al., Reference Scarmeas, Albert, Manly and Stern2006). Specifically, previous cross-sectional studies demonstrated that HE-AD exhibited higher amyloid burdens as measured by the Pittsburgh Compound B retention ratio (Kemppainen et al., Reference Kemppainen2008), lower cerebral blood flow and glucose metabolism (Alexander et al., Reference Alexander1997; Scarmeas et al., Reference Scarmeas2003; Liao et al., Reference Liao2005; Kemppainen et al., Reference Kemppainen2008), and more severe cortical atrophy (Seo et al., Reference Seo2011; Liu et al., Reference Liu2012). Moreover, after the clinical onset of AD, HE-AD experienced more rapid cognitive decline than LE-AD (Stern et al., Reference Stern, Albert, Tang and Tsai1999; Andel et al., Reference Andel, Vigen, Mack, Clark and Gatz2006; Scarmeas et al., Reference Scarmeas, Albert, Manly and Stern2006; Bruandet et al., Reference Bruandet2008). To our knowledge, however, the topography of structural changes according to education level has not been compared longitudinally.
Pathologic changes in AD occur predominantly in cortical gray matter, resulting in cortical atrophy (Mirra et al., Reference Mirra1991). Cortical thickness analysis using surface-based morphometry analysis of magnetic resonance imaging (MRI) (Lerch and Evans, Reference Lerch and Evans2005) has been used in AD studies as a marker of disease progression (Querbes et al., Reference Querbes2009; Julkunen et al., Reference Julkunen2010). In the present study, we hypothesized that education might influence brain structural changes in AD, specifically, cortical thinning. The aim of this study was to longitudinally investigate the topography of cortical thinning between the HE-AD and LE-AD.
Methods
Participants
This study was approved by the Institutional Review Board of Samsung Medical Center. We obtained informed consent from all patients and control participants.
Patients
We prospectively recruited 36 patients with AD to participate in the Alzheimer Disease and Positron Emission Tomography (ADAPET) study, which was described in detail previously (Cho et al., Reference Cho2013a; Reference Cho2013b). The patients fit the criteria of the Diagnostic and Statistical Manual of Mental Disorders, 4th Edition (DSM-IV) (American Psychiatric Association, 1994), and they also fit the criteria for probable AD proposed by the National Institute of Neurological and Communicative Disorders and Stroke and the Alzheimer's Disease and Related Disorders Association (NINCDS-ADRDA) (McKhann et al., Reference McKhann, Drachman, Folstein, Katzman, Price and Stadlan1984). For this longitudinal study, only the patients who had early-stage AD with a Clinical Dementia Rating (CDR) = 0.5 or 1 were enrolled. The patients were voluntary candidates for this study and had caregivers. None of the patients had a family history suggestive of an autosomal dominant disease. We excluded patients with other structural lesions found by brain MRI, such as territorial infarction, intracranial hemorrhage, brain tumor, hydrocephalus, or severe white matter hyperintensities.
At the initial visit, patients underwent clinical interviews, a neurological examination, a battery of neuropsychological tests called the Seoul Neuropsychological Screening Battery (SNSB), and conventional brain MRI scans. Potential secondary causes of cognitive deficit were ruled out by laboratory tests including complete blood count, blood chemistry, vitamin B12 levels, folate levels, syphilis serology, and thyroid function tests.
Controls
We recruited 14 healthy volunteers to serve as normal controls (NC). The NC was spouses of the AD patients, had no history of neurological or psychiatric illness, and had no abnormalities upon neurological examination. The NC exhibited normal cognition on the Mini-Mental State Examination (MMSE) and neuropsychological tests.
Education
To thoroughly evaluate the level of education achieved by participants, we gathered detailed information about their educational background, including whether or not they had completed each step of education (elementary school, middle school, high school, college, and graduate school). We confirmed the history of education with patient caregivers. We organized participants into two groups: those with more than 9 years of education and those with less. This 9-year cut-off criterion (HE-AD cut-off > 9 years) was used because it corresponds to the duration of schooling that precedes the beginning of high school in South Korea. Overall, 23 AD patients were in the HE group (education > 9 years) and 13 AD patients were in the LE group (education ≤ 9 years).
Neuropsychological tests
The AD patients and NC underwent a standardized neuropsychological battery of tests called the SNSB (Kang and Na, Reference Kang and Na2003; Ahn et al., Reference Ahn2010). The battery contains tests for attention, language, praxis, four elements of Gerstmann syndrome, visuoconstructive function, verbal and visual memory, frontal/executive function, and the MMSE.
Image acquisition and processing and cortical thickness measurement
We acquired 3D T1 turbo field echo MR images with the following imaging parameters: sagittal slice thickness, 1.0 mm, over contiguous slices with 50% overlap; no gap; repetition time (TR) of 9.9 msec; echo time (TE) of 4.6 msec; flip angle of 8°; and matrix size of 240 × 240 pixels, reconstructed to 480 × 480 over a field of view of 240 mm. The following parameters were used for the 3D FLAIR images: axial slice thickness of 2 mm; no gap; TR of 11000 msec; TE of 125 msec; flip angle of 90°; and matrix size of 512 × 512 pixels. A detailed description of the cortical thickness analysis is provided in Supplementary Method 1.
Follow-up evaluations with neuropsychological tests and neuroimaging
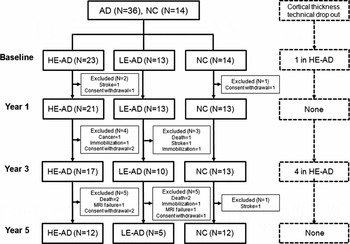
In the ADAPET study, patients were scheduled to undergo a high resolution T1-weighted volume MRI scan at baseline along with follow-up evaluations at Year 1, Year 3, and Year 5. Of the 36 AD patients, 34 completed the Year 1, 27 completed the Year 3, and 17 completed the Year 5. Nineteen patients were excluded, which included six due to withdrawal of consent, two due to stroke, one due to the detection of newly developed breast cancer, five due to death, three due to immobilization arising from progression of AD, and two due to MRI failures resulting from issues with cooperation. Of the 14 NC, 13 completed the Year 1 and Year 3, and 12 completed the Year 5. Two NC were excluded due to consent withdrawal and stroke. The total number of subjects (HE-AD, LE-AD, and NC) that participated in cortical thickness analysis is illustrated in Figure 1.
Study flow diagram. Abbreviations: AD = Alzheimer's disease; HE = higher education; LE = lower education; NC = normal controls.

Statistical analysis
Demographic and neuropsychological data was analyzed using Mann–Whitney U test or Kruskal–Wallis test with Dunn's method for continuous variables and Fisher's exact tests with Bonferroni corrections for categorical variables.
In order to compare the baseline differences between groups, we performed an analysis using the General Linear Model. Each subject's native-space cortical thickness at every vertex or mean cortical thickness was a dependent variable. Variables, including age, gender, duration of disease, and intracranial volume were entered as independent variables. In order to assess the relationships between participants group and longitudinal changes in the cortical thickness over 5 years, we applied the Linear Mixed Models, which provides a flexible and powerful statistical framework for the analysis of longitudinal data (Verbeke and Molenberghs, Reference Verbeke and Molenberghs2000; Fitzmaurice et al., Reference Fitzmaurice, Laird and Ware2012). The cortical thickness at each evaluation was a dependent variable. Variables, including age, gender, duration of disease, intracranial volume, participants groups (HE-AD, LE-AD, and NC), follow-up time (years) from baseline assessment, and the interaction between participants group and follow-up time (group-by-time) were entered as fixed effects (independent variable). The interaction between participants group and follow-up time provided an estimate of whether there was a statistically significant difference in the cortical thickness in the group according to time. The cortical surface model contained 81,924 vertices; therefore, a correction for performing multiple comparisons was made using the false discovery rate (FDR) theory (Genovese et al., Reference Genovese, Lazar and Nichols2002) at a q value of 0.05 after pooling the p values.
Demographic data and mean cortical thickness analyses were performed using Predictive Analysis Software (PASW) 18.0 (SPSS, Chicago, IL, USA). In order to compare the topography of cortical thickness, we used the Surfstat package created by Dr. Keith Worsley (http://www.math.mcgill.ca/keith/surfstat).
Results
Demographic and clinical characteristics
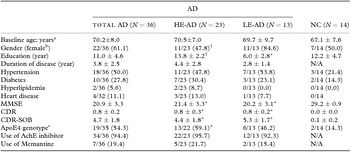
Demographic and clinical data are presented in Table 1. There were no differences between the HE-AD and LE-AD in any measure of dementia severity, including the MMSE, CDR, or Clinical Dementia Rating sum-of-boxes (CDR-SOB). There were fewer females in the HE-AD than LE-AD. Baseline and longitudinal comparisons from baseline to Year 5 of cognitive functions between the HE-AD and LE-AD were presented in Supplementary Tables S1 and S2.
Demographic and clinical characteristics at baseline

aValues represent the mean ± SD or bnumbers of cases with percentages in parentheses.
cAPOE4 genotyping was performed in 49 participants; one AD patient refused the test.
*p < 0.05 between the NC and HE-AD or between the NC and LE-AD.
† p < 0.05 between the HE-AD and LE-AD.
Abbreviations: AchE inhibitor = acetylcholinesterase inhibitor; AD = Alzheimer's disease; APOE4 = apolipoprotein E4; CDR = Clinical Dementia Rating; CDR-SOB = Clinical Dementia Rating sum-of-boxes; HE = higher education; LE = lower education; MMSE = Mini-Mental State Examination; N/A = not applicable; NC = normal controls.
Comparison of baseline difference in cortical thickness
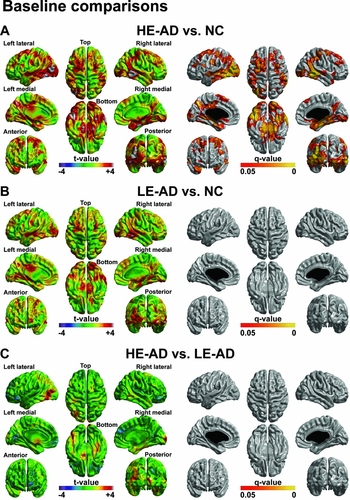
At baseline, compared to the NC, the AD patients showed decreased cortical thickness in the bilateral prefrontal, medial and lateral temporal, precuneus, and temporo-parietal regions (Supplementary Figure S1). Compared to the NC, the HE-AD showed decreased cortical thickness in the bilateral prefrontal, medial and lateral temporal, precuneus, and fusiform regions. Compared to the NC, the LE-AD showed no significant regions of decreased cortical thickness. When the HE-AD and LE-AD were directly compared, there were no regions of significant difference in topography of the cortical thickness (Figure 2).
Statistical maps of baseline difference in regional cortical thickness (T-map, FDR corrected Q value < 0.05). Regional difference at baseline was analyzed by general linear model with adjusting for age, gender, duration of disease, and intracranial volume: (A) HE-AD vs. NC, (B) LE-AD vs. NC, and (C) HE-AD vs. LE-AD. Abbreviations: AD = Alzheimer's disease; FDR = false discovery rate; HE = high education; LE = low education; NC = normal controls.

Comparison of longitudinal decline in cortical thickness from baseline to year 5
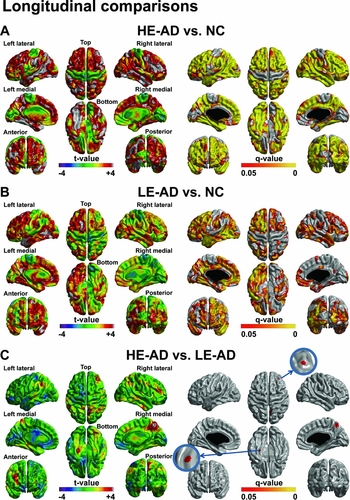
Compared to the NC, the AD patients showed significant group-by-time interaction throughout the cortex, sparing the primary motor and sensory, and cuneus regions (Supplementary Figure S1). Figure 3 provides statistical maps of vertices that showed significant group-by-time interactions in cortical thickness from baseline to Year 5. Compared to the NC, the HE-AD showed significant group-by-time interaction throughout the cortex, sparing the primary motor cortex. Compared to the NC, the LE-AD showed significant group-by-time interaction in the bilateral prefrontal, medial and lateral temporal, fusiform, the left medial frontal, posterior cingulate, and precuneus regions. When the HE-AD and LE-AD were directly compared, the HE-AD showed significant group-by-time interaction in the right dorsolateral prefrontal and precuneus, and the left parahippocampal regions than did the LE-AD. The LE-AD did not show any regions with a significant group-by-time interaction compared to the HE-AD.
Statistical maps of longitudinal decrease (group-by-time interaction) in cortical thickness from baseline to Year 5 (T-map, FDR corrected Q value < 0.05). The group-by-time interaction was analyzed by linear mixed models after controlling for age, gender, duration of disease, and intracranial volume: (A) HE-AD vs. NC, (B) LE-AD vs. NC, and (C) HE-AD vs. LE-AD. Abbreviations: AD = Alzheimer's disease; FDR = false discovery rate; HE = high education; LE = low education; NC = normal controls.

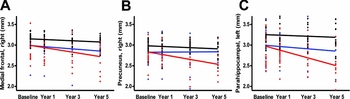
To further illustrate the magnitude of the cortical thinning rate that occurred from baseline to Year 5 follow-up, cortical thickness data as representative vertex points from the right dorsolateral prefrontal cortex, the right precuneus, and the left parahippocampal gyrus are presented in Figure 4. The HE-AD shows significantly accelerated cortical thinning in the right dorsolateral prefrontal cortex (group-by-time interaction p = 0.013), the right precuneus (group-by-time interaction p = 0.001), and the left parahippocampal gyrus (group-by-time interaction p = 0.036) compared to the LE-AD.
Cortical thickness data in representative vertex points from baseline to Year 5 follow-up in (A) the right dorsolateral prefrontal cortex, (B) the right precuneus, and (C) the left parahippocampal gyrus. HE-AD shows significantly accelerated cortical thinning in (A) the right dorsolateral prefrontal cortex, (B) the right precuneus, and (C) the left parahippocampal gyrus, when compared to LE-AD. (Black line = NC, Blue line = LE-AD, Red line = HE-AD). Abbreviations: AD = Alzheimer's disease; HE = high education; LE = low education; NC = normal controls.

To address an arbitrary cut-off level of education of 9 years, we conducted the same analysis in the AD group using educational years as a continuous variable instead of a group comparison. As shown in Supplementary Figure 2(A), the AD group revealed that a higher level of education was associated with rapid cortical thinning in the right dorsolateral prefrontal and precuneus, and the left parahippocampal regions at an uncorrected level of significance with P < 0.01, which is generally consistent with the previous findings (using a cut-off of 9 years). However, the statistical significance disappeared after correction for multiple comparisons, which might be related to the small number of subjects enrolled. We also performed longitudinal analysis between the HE-AD and LE-AD groups using higher educational cut-off values of eight and 10 years. As shown in Supplementary Figure 2(B), relative to LE-AD (N = 11), HE-AD (N = 25) using a cut-off > 8 years showed a significant group-by-time interaction in the bilateral dorsolateral prefrontal and medial frontal, the right posterior cingulate and precuneus, and the left parahippocampal regions after FDR correction. In addition, in Supplementary Figure 2(C) relative to LE-AD (N = 14), HE-AD (N = 22) using a cut-off > 10 years showed a significant group-by-time interaction in the right dorsolateral prefrontal area and precuneus, and the left parahippocampal regions at an uncorrected level of significance with P < 0.005, which is generally consistent with our original findings.
Pairwise comparisons of the HE-AD and LE-AD were conducted at each time point (baseline – Year 1, Year 1 – Year 3, and Year 3 – Year 5) (Supplementary Figure S3). Significant findings were observed at Year 3 – Year 5 in terms of change in cortical thickness between the HE-AD and LE-AD in the bilateral parahippocampal and precuneus, the left temporo-parietal, and the right prefrontal regions after FDR correction.
Discussion
We reported novel findings about the longitudinal effects of education on cortical thinning over 5 years. The major finding of this 5-year prospective study was that as AD progressed, the HE-AD showed accelerated cortical thinning in the right dorsolateral prefrontal and precuneus, and the left parahippocampal regions than did the LE-AD, which may be related to the CR theory.
Recent cross-sectional studies reported that HE-AD had widespread cortical thinning in the frontal, temporo-parietal, precuneus, and occipital cortices compared to LE-AD (Seo et al., Reference Seo2011; Liu et al., Reference Liu2012). They explained these results by the CR theory. Since HE-AD have more CR than LE-AD, by the time AD clinically manifests in HE-AD, brain pathology is already quite advanced. Thus, more widespread atrophy in the brain must occur in HE-AD before AD is clinically manifested. However, we did not find that, at baseline, there were differences in the topography between the HE-AD and LE-AD.
Our major finding was that the HE-AD exhibited more accelerated cortical thinning than did the LE-AD. The present study is the first to investigate the longitudinal effect of education level on cortical degeneration in patients with AD. Our findings are consistent with one longitudinal study that used functional imaging with single photon emission computed tomography (SPECT) to show that HE-AD had a more rapid reduction in regional cerebral blood flow than LE-AD (Hanyu et al., Reference Hanyu, Sato, Shimizu, Kanetaka, Iwamoto and Koizumi2008). Like the functional study, our longitudinal findings might be explained by the CR hypothesis. That is, since pathology in HE-AD is more severe than in LE-AD after AD has developed, there is much less substrate remaining to function as a reserve (Stern, Reference Stern2009; Reference Stern2012). Therefore, the insufficient reserve in HE-AD contributes towards accelerated deterioration of AD (Stern et al., Reference Stern, Albert, Tang and Tsai1999; Wilson et al., Reference Wilson, Bennett, Gilley, Beckett, Barnes and Evans2000; Scarmeas et al., Reference Scarmeas, Albert, Manly and Stern2006). Indeed, the topography of longitudinal cortical thinning observed in HE-AD in the current study was similar to that observed in several cross-sectional studies (Seo et al., Reference Seo2011; Liu et al., Reference Liu2012), although in the present study there were no differences between the two groups (HE-AD versus LE-AD) at baseline.
Accelerated cortical thinning was seen in the right dorsolateral prefrontal and precuneus, and the left parahippocampal regions in the HE-AD compared to the LE-AD. These findings are consistent with the longitudinal SPECT findings, which showed a significant regional cerebral blood flow reduction in the frontal, parietal, temporal, and limbic lobes of HE-AD group (Hanyu et al., Reference Hanyu, Sato, Shimizu, Kanetaka, Iwamoto and Koizumi2008). Also, our findings may be supported by previous neuropsychological studies. Frontal thinning was accelerated in HE-AD compared to LE-AD, which corresponds to quicker progression of AD in terms of executive function (Scarmeas et al., Reference Scarmeas, Albert, Manly and Stern2006). Similarly, cortical thinning in the parahippocampal gyrus and precuneus is consistent with the reports of memory impairment shown in previous longitudinal studies (Stern et al., Reference Stern, Albert, Tang and Tsai1999; Scarmeas et al., Reference Scarmeas, Albert, Manly and Stern2006).
This study has some limitations. First, our patients were selected from a single center, and since this was a longitudinal study, there was attrition during the 5-year study period, resulting in a relatively small number of patients. Therefore, there may be limitations in the ability to generalize these findings. Second, when recruiting AD patients, we did not use any specific biomarkers for amyloid deposition such as cerebrospinal fluid amyloid beta levels or amyloid positron emission topography, although we did measure hippocampal atrophy and temporo-parietal hypometabolism. Moreover, at baseline and 5 years later, none of our subjects met the revised consensus criteria for dementia with lewy bodies (McKeith et al., Reference McKeith2005), none had frontotemporal dementia (Neary et al., Reference Neary1998) and none had vascular dementia (Roman et al., Reference Roman1993). Finally, we could not obtain patient's information on the socio-demographic variables such as occupation or premorbid intelligence quotients that were frequently used proxies reflecting CR.
In conclusion, our study reveals that the preliminary longitudinal effect of HE accelerates cortical atrophy in AD patients over time, which underlines the importance of education level for predicting prognosis. This is noteworthy for a more comprehensive prognosis of AD patients, which is essential for the design of disease-modification strategies and the development of new AD treatments.
Conflict of interest
None.
Description of authors’ roles
HC and SWS designed the study; all authors contributed to the acquisition of data and carrying out of the study; statistical analyses and interpretation of data were performed by DRK, SJ, CK, J-HK, J-ML, HC, and SWS. HC and SWS prepared the first draft; all authors revised the content critically for important intellectual content and approved the final version.
Acknowledgments
This study was supported by Basic Research Program through the National Research Foundation of South Korea (NRF) funded by the Ministry of Education (NRF-2013R1A1A2065365), the Korean Healthcare Technology R&D Project, Ministry for Health and Welfare Affairs (HI10C2020 & HIC120713), a Korean Science and Engineering Foundation (KOSEF) NRL program grant funded by the Korean government (MEST; 2011-0028333), a Samsung Medical Center Clinical Research Development Program grant (CRL-108011 & CRS 110-14-1), IN-SUNG Foundation for Medical Research (CA68421) and the Converging Research Center Program through the Ministry of Science, ICT and Future Planning, South Korea (2013K000338).
Supplementary material
To view supplementary material for this article, please visit http://dx.doi.org/10.1017/S1041610214001483