Implications
Methane (CH4) is a potent greenhouse gas that arises from feed fermentation in the rumen and large intestine of ruminant animals. The quantity of CH4 depends on daily feed intake, feed chemical composition and feed rumen digestibility. Therefore, the present paper was an attempt to calculate CH4 production from digestion of individual nutrients (carbohydrates, protein and fat) or from digestion of carbon and from the rumen fermentation profile and to find factors, apart from feed intake, that determine CH4 production. Furthermore, diurnal curves of CH4 and CO2 production and rumen fermentation parameters are presented.
Introduction
Enteric methane (CH4) emitted from ruminant production systems has received much attention in recent decades due to its important contribution to greenhouse gas emissions (Johnson and Johnson, Reference Johnson and Johnson1995). The quantification of CH4 from animals is both laborious and expensive. Several attempts have been made to estimate CH4 in dairy cows from feed composition and feed intake (e.g. Mills et al., Reference Mills, Dijkstra, Bannink, Cammell, Kebreab and France2001) or by making use of methods such as spot breath sampling using CH4 to CO2 ratio (Madsen et al., Reference Madsen, Bjerg, Hvelplund, Weisbjerg and Lund2010) as an indication of daily CH4 production.
The CH4 emission from livestock is the end product of the anaerobic fermentation in the digestive tract. It may be possible to predict CH4 emission if the breakdown and flow of nutrients in the system is known. Feed entering the rumen can follow three pathways: (1) outflow from the rumen as undegraded feed nutrients, (2) microbial utilization to generate metabolic energy for growth and maintenance with volatile fatty acids (VFA) and hydrogen (H2) as end products or (3) microbial utilization for microbial biosynthesis. The distribution between the different pathways depends not only on the chemical composition of the feed but also on other factors such as physical structure of the diet and feed intake level (Hoover, Reference Hoover1986; Nozière et al., Reference Nozière, Ortigues-Mary, Loncke and Sauvant2010). The most common approach to estimate the amount of VFA produced in the rumen is to estimate the amount of individual nutrients (protein, carbohydrates (CHO) and glycerol of fat origin) that is truly digested in the rumen, and subsequently calculate glucose units available from these nutrients for fermentation to VFA. Specific coefficient values are derived from the literature to estimate the proportion of individual VFA from fermented nutrients (Murphy et al., Reference Murphy, Baldwin and Koong1982). It is widely accepted that rumen fermentation pattern is closely related to CH4 production due to changes in the H2 balance such that high acetate and butyrate production enhance CH4 production, whereas high propionate production reduces CH4 emission (e.g. Johnson and Johnson, Reference Johnson and Johnson1995; Moss et al., Reference Moss, Jouany and Newbold2000). A number of studies reported both CH4 production and rumen fermentation pattern (e.g. Soliva et al., Reference Soliva, Meile, Cieslak, Kreuzer and Machmüller2004; Chung et al., Reference Chung, He, McGinn, McAllister and Beauchemin2011; Doreau et al., Reference Doreau, van der Werf, Micol, Dubroeucq, Agabriel, Rochette and Martin2011; Brask et al., Reference Brask, Lund, Hellwing, Poulsen and Weisbjerg2013a and Reference Brask, Lund, Weisbjerg, Hellwing, Poulsen, Larsen and Hvelplund2013b). However, the diet effect on CH4 production appears not always to be consistent with the observed shift in rumen fermentation pattern. The most detailed mechanistic models of CH4 production (Baldwin, Reference Baldwin1995; Benchaar et al., Reference Benchaar, Rivest, Pomar and Chiquette1998; Mills et al., Reference Mills, Dijkstra, Bannink, Cammell, Kebreab and France2001) predicted rumen fermentation pattern based on VFA coefficients that were derived from surveys of literature data on rumen digestion, and under the assumption of consumption of all surplus H2 for CH4 production. However, there is a lack of a combination of these data. This combination was available in three experiments by Brask et al. (Reference Brask, Lund, Hellwing, Poulsen and Weisbjerg2013a), Brask et al. (Reference Brask, Lund, Weisbjerg, Hellwing, Poulsen, Larsen and Hvelplund2013b) and Hellwing et al. (Reference Hellwing, Brask, Lund and Weisbjerg2012a), which to our knowledge delivers a unique data set to evaluate the presumptions on the relationship between rumen digestion, fermentation pattern and CH4 production.
The objective of this paper was to analyse if the variation in enteric CH4 production per kg dry matter intake (DMI) in lactating cows could be predicted from data on nutrient digestion and fermentation pattern in the rumen and large intestine using two different approaches: a balance calculation for organic matter (OM) digestion in the rumen and large intestine with calculations in terms of glucose units that are converted into VFA (DOM), and a calculation of carbon (C) balance in the rumen and large intestine in terms of C converted into VFA, CH4 and CO2 (DCARB). Furthermore, the presumed causal relationship between CH4 production and rumen fermentation parameters were evaluated in more detail with observations of their diurnal variation.
Material and methods
Data
A data set was constructed from three experiments that were conducted with lactating rumen, duodenal and ileal cannulated Danish Holstein dairy cows and reported by Brask et al. (Reference Brask, Lund, Hellwing, Poulsen and Weisbjerg2013a; experiment A), Brask et al. (Reference Brask, Lund, Weisbjerg, Hellwing, Poulsen, Larsen and Hvelplund2013b; experiment B) and by Hellwing et al. (Reference Hellwing, Brask, Lund and Weisbjerg2012a; experiment C). Experiment A had a 6×4 incomplete Latin square design with six cows, six diets and four periods and experiments B and C had a 4×4 Latin square design with four cows, four treatments and four periods. One cow was omitted from period 4 in experiment B and therefore the final data set included 55 observations and 14 diets.
Spot samples of rumen liquid and duodenal and ileal chyme and faecal grab samples were taken at every 2nd hour of the day (12 samples per day); chromic oxide was used as the flow marker. Feed samples were taken on days 15 to 19 in every period. Each period lasted for 4 weeks. Samples for digestibility measurements (rumen liquid, duodenal and ileal chyme, faecal grab samples) were taken on days 15 to 19 in every period; CH4 was measured on days 21 to 28 in experiment A and on days 22 to 25 in experiments B and C. Feed and digesta samples were pooled by cow and period. Rumen liquid samples were analysed per cow per sampling time (i.e. 12 observations per cow per period) for pH, VFA and NH3.
Individual observations per cow per period were used for random regression. The CH4 production was calculated from feed intake and digesta flows as cow times period (in total 55 observations).
The diurnal VFA production and rumen pH was calculated as the average per sampling time over cows, periods and experiments, and used for evaluating the diurnal variation in VFA production and rumen pH (55 observations per sampling time, in total 660 samples). The experimental set-up, the procedures for determining rumen, intestinal and total tract digestibility and the measurement of enteric CH4 production are further described in detail in Brask et al. (Reference Brask, Lund, Hellwing, Poulsen and Weisbjerg2013a). Facilities and procedures followed to measure enteric CH4 are described by Hellwing et al. (Reference Hellwing, Lund, Weisbjerg, Brask and Hvelplund2012b).
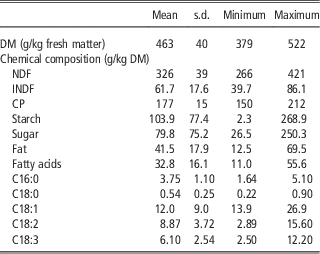
A summary of the chemical composition of the 14 different diets is given in Table 1. The chemical composition for each of the 14 diets is given in Supplementary Table S1.
Diets chemical composition

DM=dry matter; INDF=indigestible NDF.
Liquid-associated bacteria were isolated from rumen liquid. One litre of rumen liquid was sampled and filtered through a double-layer of cheesecloth. Small particles and protozoa were removed by centrifugation of the filtrate twice at 500×g for 5 min (3°C). The bacteria were harvested from the supernatant by centrifugation at 17 300×g for 20 min (3°C), and purified by dissolving the precipitate in 200 ml saline and then re-centrifuged at 17 300×g for 20 min (3°C).
Total rumen evacuation was conducted on day 28 of each period at 1200 h. The rumen was emptied manually and separated into a liquid and solid phase. Each phase was weighed and compiled to representative 500 g subsamples for DM determination and chemical analyses.
Carbon was analysed by dry combustion using a Vario Max CN (Elementar Analysesysteme GmbH, Hanau, Germany). Purines in rumen microbes and duodenal samples were analysed by spectrophotometry according to Zinn and Owens (Reference Zinn and Owens1986) with modifications according to Thode (Reference Thode1999).
Calculations
Truly digested organic matter approach (DOM)
A summary for feed intake and digestibility is given in Supplementary Table S2. Assumptions made for the DOM approach are given in the following section.
Flow of nutrients from rumen to duodenum
The fractional passage rate of digestible NDF (DNDF)/h was calculated as [duodenal DNDF flow kg/d / rumen DNDF pool kg] / 24 h/d. Indigestible NDF (INDF) was calculated accordingly. The fractional degradation rate of DNDF/h was calculated as [(DNDF intake kg/day−DNDF duodenal flow kg/day)/rumen DNDF pool kg]/24 h/day. Rumen retention times h were calculated as 1/passage rate.
To reduce variation, the duodenal DM flow of individual cows and periods was derived as feed DM intake minus rumen digestion estimated using the least square means (LSM) of rumen digestibility for treatments. Nutrient flow was calculated using individual cow observations on nutrient composition in the duodenal digesta.
The true rumen digestibility was calculated by partitioning duodenal nutrient flow into the flow of feed, microbial matter and endogenous matter, respectively. Microbial OM and protein synthesis were calculated from the chemical composition of the isolated rumen bacteria using the content of purines in microbes and duodenal chyme as marker. Duodenal flow of endogenous protein was calculated as endogenous amino acid N×6.25 where the duodenal flow of endogenous amino acids was estimated according to Larsen et al. (Reference Larsen, Madsen, Weisbjerg, Hvelplund and Madsen2000). Duodenal flow of microbial fat was assumed to be 12% of the duodenal microbial OM flow (Weisbjerg et al., Reference Weisbjerg, Børsting and Hvelplund1992). It was assumed that no feed fatty acids (FA) were fermented in the rumen, that is, that duodenal feed FA flow was identical to feed FA intake. Glycerol was estimated as 10% of feed fat according to the molar weights of FA, as feed FA mainly consisted of C16 and C18. It was assumed that all glycerol was fermented. Consequently, duodenal flow of feed fat was assumed to equal crude fat from feed minus glycerol. Endogenous fat at the duodenum was estimated as total fat flow minus duodenal flow of feed fat and duodenal flow of microbial fat. Duodenal fat flow was calculated as the intake of crude fat minus glycerol plus microbial fat.
Duodenal CHO flow was calculated as duodenal OM flow (kg/day) minus duodenal flow of CP and crude fat (kg/day). Accordingly, the duodenal microbial CHO flow was calculated as microbial OM minus duodenal flow of microbial fat and protein. Endogenous CHO was assumed to be zero, and endogenous OM was therewith assumed to be the sum of endogenous protein and endogenous fat. The dietary CHO were divided into polymer (starch and cell wall) and sugar (assumed disaccharides). It was assumed that all sugar was fermented in the rumen (Weisbjerg et al., Reference Weisbjerg, Hvelplund and Bibby1998; Huhtanen et al., Reference Huhtanen, Ahvenjärvi, Weisbjerg and Nørgaard2006), which meant that duodenal CHO flow was assumed to consist of CHO polymer only.
VFA production
The amounts of feed nutrients truly digested in the rumen (kg/day; protein, CHO, glycerol) and not used for microbial synthesis were assumed to be fully converted into VFA, and they were divided by their molar weight (g/mol) in order to obtain the moles of glucose units that were available for VFA production. It was assumed that 1 mol CHO polymer weighs 162 g, 1 mol disaccharides 171 g and 1 mol protein 116 g. Glycerol was assumed to have a molar weight of 92 g. From available glucose units (mol/day), the production of acetate (Ac), propionate (Pr), butyrate (Bu) and other VFA (assuming that this is mainly valerate, Va) (mol/day) was calculated from the diurnal means of the measured proportion of individual VFA of total VFA. According to fermentation pathways (Baldwin, Reference Baldwin1995), it was assumed that 1 mol glucose unit delivered either 2 mol of Ac or Pr, or 1 mol of Bu or Va and 1 mol of protein delivered 0.55 mol of glucose unit (Bannink et al., Reference Bannink, Kogut, Dijkstra, France, Kebreab, Van Vuuren and Tamminga2006). Protein was considered independently of positive or negative rumen protein balance, that is, it was assumed that the same amount of glucose units delivered by feed protein degradation was used for microbial protein synthesis.
Truly digested carbon approach (DCARB)
CH4 production based on truly digested carbon (DCARB) was calculated as the difference between C intake and duodenal C flow, which was assumed to be the amount of C available for VFA production, similar to the approach based on glucose units used in the DOM calculation. Endogenous C flow was estimated from endogenous CP and fat flow using the C content of bacterial fat and protein according to Reichl and Baldwin (Reference Reichl and Baldwin1975). Possible bicarbonate flow at the duodenum was not considered as it was assumed that all bicarbonate is converted into CO2 in the abomasum (Aschenbach et al., Reference Aschenbach, Penner, Stumpff and Gäbel2011; Dijkstra et al., Reference Dijkstra, Ellis, Kebreab, Strathe, López, France and Bannink2012).
According to glucose fermentation stoichiometry, 3 mol C are used for 1 mol Ac (2 mol C for Ac, 1 mol C for CO2) and for 1 mol Pr, and 6 mol C for 1 mol Bu (4 mol C for Bu, 2 mol C for CO2) and for 1 mol Va.
Surplus hydrogen and CH4
Hydrogen was assumed to be produced when OM was fermented to Ac and Bu, and used during production of Pr and Va. Since two of the three trials used high-fat diets and the FA concentration varied substantially between diets, the amount of H2 available for CH4 production was corrected for biohydrogenation, assuming hydrogenation rates of 75% for C18:1, 80% for C18:2 and 92% for C18:3 (Weisbjerg et al., Reference Weisbjerg, Børsting and Hvelplund1992; Doreau and Chilliard, Reference Doreau and Chilliard1997). After this correction, it was assumed that all residual H2 was converted to CH4 (i.e. a 100% recovery rate). It is known that some H2 is exhaled as H2 gas (Hammond et al., Reference Hammond, Burke, Koolaard, Muetzel and Pinares-Patiño2013). However, observations of H2 production in the respiration chambers during the last two periods of experiment A and for all periods in experiment C of the present data, showed that even if all H2 exhaled was converted to CH4 instead, daily CH4 production would theoretically be increased by on average just 0.42% (s.d. 0.45, Hellwing, unpublished data). Such a small and variable impact of H2 on CH4 yield made assumption of a 100% recovery rate reasonable. CH4 production was calculated from VFA production and biohydrogenation as
 $$\ \,\eqalign{{\rm CH}_{\rm 4} &( {\rm mol}/{\rm day} )=\,({\rm 2}{\times}{\rm Ac}( {\rm mol}/{\rm day} )-{\rm Pr}({\rm mol}/{\rm day}) {\plus}{\rm 2}\cr &{\times}{\rm Bu}( {\rm mol}/{\rm day} )-{\rm Va}( {\rm mol}/{\rm day} ) -{\rm H}_{\rm 2} {\rm used}\,{\rm for}\,\cr &\,{\rm biohydrogenation}\,({\rm mol}/{\rm day}))/4\ \ \ \ \ \ \ \ \ \ \ \ \ \ \ \ \ \ \ \ \ (1)}}$$
A molar weight for CH4 of 16 g/mol was used and 1 g CH4 corresponds to 1.4 l at standard temperature and pressure (0°C and 1013 mbar).
The difference (DIF_CH4) between measured and calculated CH4 production (l CH4/kg DMI) was used to analyse sources of variation for biased prediction of CH4 using DOM or DCARB. Rumen hydrogen balance (RHB) was calculated as 2×(Ac+Bu)/(Pr+Va), reflecting the ratio between H2 produced and H2 utilized in relation to VFA production during fermentation.
Hind gut fermentation
Besides rumen fermentation, hind gut fermentation also results in CH4 emission. The amount of CP and CHO polymer digested in the hind gut was calculated as the difference between ileal and faecal flow. It was assumed that all sugar and glycerol was digested before entering the hind gut (Huhtanen et al., Reference Huhtanen, Ahvenjärvi, Weisbjerg and Nørgaard2006). Digested CP was handled as in the calculations for VFA production in the rumen. The amount of glucose units was calculated similar to rumen fermentation (Baldwin, Reference Baldwin1995) and the amount of CH4 was calculated assuming that diet composition would not affect the fermentation pattern in the hindgut because of intensive digestion in the forestomachs and small intestine and therefore less variable type of digesta flowing into the hindgut. Therefore, the average VFA composition of all 55 rumen observations was considered representative for the hind gut. Furthermore, an H2 recovery of 65% was assumed for the hind gut (Demeyer, Reference Demeyer1991). The same hind gut CH4 production was assumed for both DOM and DCARB model.
CH4 and carbon dioxide production per hour
CH4 and carbon dioxide (CO2) concentrations were measured every 12.5 min in the respiration chambers as well as background (inlet) air, and production was calculated from air flow and chamber concentration changes. Hourly production was calculated assuming that the production between measuring times was constant (l gas/s). For measuring 12.5 min intervals, which spanned the change from 1 h to the next, the calculated gas production was partitioned between the 2 h according to the time differences between the measuring time and hour change, for example, a measuring time from 0855 to 0907 h was divided into 0855 to 0900 and 0900 to 0907 h. Missing observations for gas production during handling of the animals (feeding, collecting orts and milking) were assumed to be equal to gas production (l gas/s) during the rest of the respective hour. Milking and feeding took place at 0600 and 1700 h in experiments A and C and at 0500 and 1700 h in experiment B. Each milking time included about 20 min of missing observations. Rumen samplings covered every 2nd hour of the day and were compared with the corresponding hourly CH4 production values as averages of 1 h before till 1 h after sampling.
Statistical analysis
A simple regression using the REG procedure in SAS (SAS 9.2 version, SAS Institute Inc., Cary, NC, USA) was conducted using measured CH4 (l/day) as the dependent variable and DMI as the independent variable. Further, simple regressions were conducted comparing CH4 (l/kg DMI) calculated by DOM or DCARB with measured CH4 (l/kg DMI) as the dependent variable and the calculated amount of CH4 (l/kg DMI; calculated either by the DOM or DCARB approach) as the independent variable. The difference between measured and calculated CH4 production, DIF_CH4, was analysed, in first place with simple regression with DIF_CH4 as the dependent variable and calculated CH4 (l/kg DMI) for DOM and DCARB, respectively, as the independent variable. Furthermore, DIF_CH4 was analysed using a multiple regression (SAS REG procedure) with the STEPWISE option to identify variables that explained the DIF_CH4 as the dependent variable and the intake of DM, OM and individual nutrients, the digestibility at the rumen, hind gut and total tract level and rumen parameters (VFA, NH3, pH, rumen retention times and passage rate of DNDF and INDF as well as the degradation rate of DNDF) as the independent variables, using a threshold for selection in the model of P<0.05. Finally, a multiple regression was performed, resulting in a regression equation that included the calculation with DOM or DCARB, and additional explanatory variables based on the outcome of the stepwise analysis of DIF_CH4.
The hourly CH4 production was analysed by random regression with an unstructured covariance matrix with the SAS MIXED procedure for total rumen VFA concentration, rumen pH, RHB and CH4 to CO2 production ratio using each cow-period observation as the subject (n=55). The model was
 $${\rm CH}_{{\rm 4}} \,{\rm production}\,({{{\rm l}/{\rm h}}} )=\beta _{0} {\plus}\beta _{{\rm 1}} x{\plus}D_{i} {\plus}{\varepsilon}$$
where β 0 is the intercept, β 1 the regression coefficient, x the total rumen VFA concentration, rumen pH, RHB or CH4 to CO2 production ratio, D the diet effect; i the diet 1 to 14 and ε the random error. Both β 0 and β 1 were assumed random. The diurnal pattern of CH4 and CO2 production, VFA production and fermentation pattern and rumen pH was analysed using simple means of all cow-period observations for every time point (every 2nd hour of the day).
Results
Regression of CH4 production
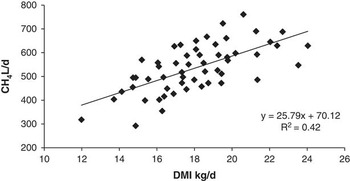
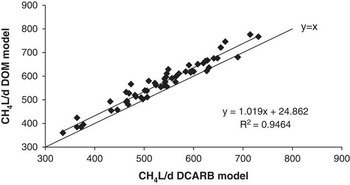
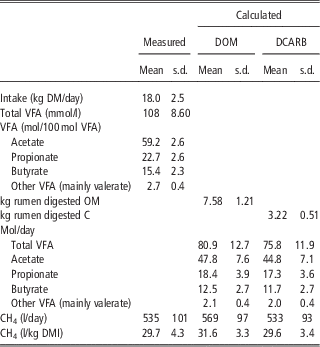
All results refer to calculations, which account for rumen biohydrogenation and hindgut fermentation. A simple regression of CH4 measured against DMI resulted in an R 2 of 0.42 (Figure 1). The amount of CH4 calculated by DOM was 6.7% higher than the amount calculated by DCARB (R 2=0.95, Figure 2). Regressing CH4 calculated by DOM against CH4 calculated by DCARB resulted in a positive intercept of 25 l/day. The calculated production rates of VFA and CH4 production were highly correlated. Statistics of measured values for VFA and CH4 and results of the DOM and DCARB model are presented in Table 2, showing 6.7% higher values for both total VFA production and CH4 production for the DOM approach compared with the DCARB approach.
CH4 production l/day v. DMI kg/day. Regression equation: CH4 l/day=70.12+25.79×DMI kg/day; R 2=0.42. CH4=methane; DMI=dry matter intake.

CH4 l/day calculated by DOM v. CH4 l/day calculated by DCARB. Regression equation: CH4 DOM l/day=24.86+1.02×CH4 DCARB l/day; R 2=0.95. CH4=methane; DOM=digested organic matter; DCARB=digested carbon.

Measured CH4 and fermentation pattern and results from calculations based on DOM and DCARB models

DOM=rumen digested organic matter model; DCARB=rumen digested carbon model; VFA=volatile fatty acid; OM=organic matter; C=carbon.
Stepwise regression on differences between measured and calculated CH4
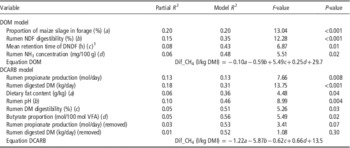
The results of the stepwise regression of DIF_CH4 against different parameters are presented in Table 3. For the DOM model, the highest partial R 2 was found for the proportion of maize silage in the forage (%), followed by rumen NDF digestibility (%), mean retention time of DNDF (MRT DNDF, h) and the rumen NH3 concentration (mg/100 g). The total R 2 was 0.48.
Stepwise regression analysis of factors explaining the differences between measured and calculated CH4 production (l/kg DMI)

DM=dry matter.
1 DNDF=digestible NDF calculated as NDF−indigestible NDF.
For the DCARB model, the stepwise regression revealed the following parameters (in the order from high to low partial R 2): rumen pH, dietary fat concentration (%), molar proportion of butyrate (mol/100 mol) and rumen DM digestibility (%). The total R 2 was 0.52.
Multiple regressions including parameters found in the stepwise regression
DOM model
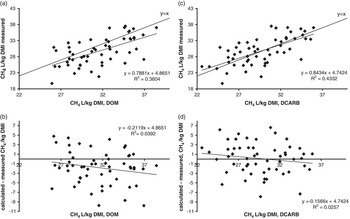
The initial simple regression of measured CH4 against calculated CH4 resulted in an R 2 of 0.36 (Figure 3a). CH4 production (l/kg DMI) was overestimated by 6.1% compared with the measured CH4 production (Figure 3b). Adding the parameters that the stepwise regression revealed as most important in explaining the differences between calculated and measured CH4 to the regression model resulted in the following equation (R 2=0.66; r.m.s.e. 2.61):
 $$\eqalignno{ {\rm CH}_{{\rm 4}} &\,{\rm production}\,{\rm rate}\,\left( {{{{\rm l} / {{\rm kg}\,{\rm DMI},\,{\rm measured}}}}} \right)= {\rm 29}.{\rm 7}{\plus}0.{\rm 87} \cr & {\times}{\rm calculated}\,{\rm CH}_{{\rm 4}} \,({\rm l}/{\rm kg \,DMI) } -{\rm }0.0{\rm 9}{\times}{\rm proportion}\,{\rm maize} \, \cr &{\rm silage}\,{\rm in}\,{\rm forage}\,(\,\%\,)-0.{\rm 52} {\times}{\rm ruminal}\,{\rm NDF}\,{\rm digestibility} \cr &(\,\%\,){\plus}{\rm 4}.{\rm 54}{\times}{\rm rumen}\,{\rm DNDF} {\rm retention}\,{\rm time}\,({\rm h}){\plus}0.{\rm 24} \cr &{\times}{\rm rumen}\,{\rm NH}_{{\rm 3}} \,{\rm concentration} {\rm (mg}/{\rm 1}00\:{\rm mg)} $$
Simple regression of CH4 measured against CH4 calculated by (a) DOM, CH4 l/kg DMI measured=0.79×CH4 calculated by DOM+4.87 (R 2=0.36); and calculated by (c) DCARB, CH4 l/kg DMI measured=0.84×CH4 calculated by DCARB+4.74 (R 2=0.43). Difference between measured and calculated CH4 (DIF_CH4) and calculated CH4 for (b) by DOM, regression equation: DIF_CH4 (DOM)=−0.21× CH4 l/kg DMI calculated by DOM+4.87 (R 2=0.04); and for (d) by DCARB, regression equation: DIF_CH4 (DCARB)=−0.16×CH4 l/kg DMI calculated by DCARB+4.74 (R 2=0.03). CH4=methane; DOM=digested organic matter; DMI=dry matter intake; DCARB=digested carbon.

DCARB model
An initial simple regression of measured v. calculated CH4/kg DMI resulted in an R 2 of 0.43 (Figure 3c). The CH4 production/kg DMI was underestimated by 0.4% by the DCARB model (Figure 3d). Adding the parameters that the stepwise regression revealed as most important to explain the differences between calculated and measured CH4 to the regression resulted in the following equation (R 2=0.72; r.m.s.e. 2.38):
 $$\eqalignno{ {\rm CH}_{{\rm 4}} \,&{\rm production}\,{\rm rate}\,( {{{\rm l} / {{\rm kg}\,{\rm DMI},\,{\rm measured}}}} \right)= {\rm 51}.{\rm 7}{\plus}0.{\rm 98 } \cr & \!{\times}{\rm calculated}\,{\rm CH}_{{\rm 4}} \,\left( {{\rm l}/{\rm kg \,DMI}} \right) -{\rm 1}.{\rm 23} {\times}{\rm dietary}\,{\rm fat}\,{\rm content}\,\cr &\!(\,\%\,) {\minus}{\rm 5}.{\rm 7}{\times}{\rm rumen}\,{\rm pH}-0.{\rm 61} {\times}{\rm rumen}\,{\rm DM}\,{\rm digestibility}\,\cr &\!{\rm (}\,\%\,{\rm )} {\plus}0.{\rm 66} {\times}{\rm butyrate}\,{\rm proportion}\,({\rm mol}/{\rm 1}00\:{\rm mol}) $$
Diurnal pattern in VFA concentration and CH4 production
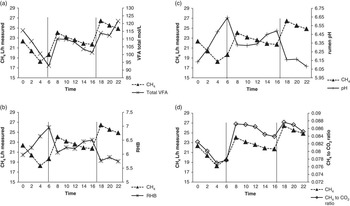
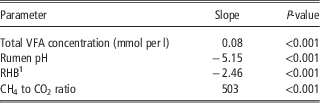
The diurnal pattern in CH4 production (Figure 4) matched that of the concentration of total VFA in the rumen fluid (and of individual VFA; not shown), that of the ratio between CH4 and CO2 production, and that of rumen NH3 concentration (not shown). Acetate molar proportion, RHB and rumen pH showed a reverse pattern but with similar dynamics. The random regression analysis of CH4 showed a significant effect of all tested variables (P<0.001) with estimates shown in Table 4.
Diurnal variation of CH4 production in relation to total rumen VFA concentration (mmol/l) in the rumen, rumen pH, rumen H2 balance (RHB, calculated as 4×(acetate+butyrate)/2×(propionate+valerate) and CH4 to CO2 ratio. Vertical lines indicate feeding times. CH4=methane; VFA=volatile fatty acid; RHB=rumen hydrogen balance.

Relationship between CH4 production (l/h) and rumen fermentation parameters based on 12 diurnal rumen observations

VFA=volatile fatty acid.
Relationship given as slope estimates.
1 RHB=rumen hydrogen balance calculated as 2×(acetate+butyrate)/(propionate+valerate).
Discussion
Digestibility calculations
A simple regression of CH4 production against DMI resulted in an R 2 of 0.42 (Figure 1). This stresses the importance of DMI, in agreement with Hammond et al. (Reference Hammond, Burke, Koolaard, Muetzel and Pinares-Patiño2013) who found that DMI was the main factor explaining observed variation in CH4 production. Earlier modelling studies achieved considerably higher R 2 with DMI as a parameter. However, the aim in the present study was not to achieve the highest possible R 2 but to describe factors other than DMI explaining variation in CH4 production. Therefore, the comparison between measured and calculated CH4 was conducted on the basis of CH4/kg DMI instead of CH4/day in an attempt to exclude variation caused by DMI.
When the individual duodenal flow data (by cow by treatment) were used, rumen DM digestibility explained most of the difference between observed and predicted CH4 production in the stepwise analysis. This indicated a potential bias in the measurements as the digestibility should have been accounted for already in the calculation of rumen digested nutrients or C digested. The duodenal flow for individual animals was therefore re-calculated using the LSM per treatment, thereby excluding the relatively large individual animal variation in rumen digestibility. As a result, rumen DM digestibility was no longer an explanatory factor in the stepwise regression for DOM. It remained an explanatory factor, however, in the stepwise regression of DCARB explaining 5% of the variation. The use of LSM of rumen digestibility for treatments instead of individual animal observations increased the model R 2 for simple regression of measured and calculated CH4 from 0.22 to 0.36 and from 0.19 to 0.43 for DOM and DCARB, respectively.
Initially, CH4 production was calculated from rumen fermented OM only. However, the analysis of DIF_CH4 indicated that hind gut digestibility was a source of variation. Immig (Reference Immig1996) estimated that hind gut fermentation accounts for 6% to 14% of the CH4 production in ruminants. According to Demeyer (Reference Demeyer1991), it can be assumed that the VFA profile in the hind gut and in the rumen are similar. However, it is questionable whether a substantial diet effect can be found in the hind gut due to the intensive digestion that precedes in the forestomaches, abomasum and small intestine. Therefore, an average VFA profile across all 55 observations in the present data set was used as an estimate of the fermentation pattern in the hind gut.
Hind gut fermentation accounted for 23.2 l CH4/day (s.d. 18.4 l), or 4% of the total CH4 production, which is slightly lower than the level of 6% to 14% reported by Immig (Reference Immig1996). After adding the estimate for CH4 produced in the hind gut to the rumen produced CH4, hind gut fermentation was not revealed to be important in the analysis of DIF_CH4.
Prediction of CH4 and sources of error
The initial simple regression of measured against calculated CH4/kg DMI resulted in an R 2 of 0.36 and 0.43 for DOM and DCARB, respectively. A higher R 2 might be expected as measured data for in vivo rumen digested OM converted to VFA, as well as measured molar proportions of VFA were used as an input for the calculations. However, it was well within R 2 obtained with other models predicting CH4 production from intake parameters (Yan et al., Reference Yan, Porter and Mayne2009; Nielsen et al., Reference Nielsen, Volden, Åkerlind, Brask, Hellwing, Storlien and Bertilsson2013) and most likely caused by variation in the measurement of rumen VFA and OM digestion as demonstrated before in a theoretical simulation study by Bannink et al. (Reference Bannink, Kogut, Dijkstra, France, Kebreab, Van Vuuren and Tamminga2006). Using l CH4/kg DMI as the unit strongly decreased variation compared with l CH4/day because DMI is the major determinant for variation in CH4 production. However, because we used DMI as an input already for the calculations, we had to express unexplained variation in l CH4/kg DMI to evaluate what factors related to prediction error.
Variables that were revealed to be explanatory in the stepwise regression of DIF_CH4 added significant information to the regression of measured against calculated CH4. This was because these variables either correct for factors in digestion or CH4 production, which were not taken into consideration in the calculations of CH4. Furthermore, they may indicate systematic bias in the measurements or they may be a result of the assumptions made. The variables revealed are discussed below.
DOM model
The stepwise regression of the DIF_CH4 in the DOM model showed that dietary CHO composition and CHO digestion parameters provided most of the additional explanation of measured CH4 production.
The characteristics for CHO digestion (i.e. MRT DNDF, dietary maize proportion and rumen NDF digestibility) are interdependent as maize silage NDF usually has a lower rumen digestibility than grass silage NDF (Jensen et al., Reference Jensen, Weisbjerg, Nørgaard and Hvelplund2005; Brask et al., Reference Brask, Lund, Hellwing, Poulsen and Weisbjerg2013a) and a different rumen MRT DNDF (Krämer et al., Reference Krämer, Lund and Weisbjerg2013). Furthermore, maize silage is rich in starch, whereas grass silage contains the more methanogenic CHO fibre and sugars. With decreased retention time, a lower proportion of feed is fermented in the rumen and with less complete digestion, relatively more easily fermentable parts of the CHO are digested (Huhtanen et al., Reference Huhtanen, Ahvenjärvi, Weisbjerg and Nørgaard2006), which are normally considered to be least methanogenic (Beauchemin et al., Reference Beauchemin, Kreuzer, O’Mara and McAllister2008). It is well documented that CHO composition affects fermentation pattern (Murphy et al., Reference Murphy, Baldwin and Koong1982; Bannink et al., Reference Bannink, Kogut, Dijkstra, France, Kebreab, Van Vuuren and Tamminga2006; Nozière et al., Reference Nozière, Ortigues-Mary, Loncke and Sauvant2010). Measured data for rumen digestibility and rumen VFA profile were used in the present study and the aforementioned effects of CHO composition on fermentation pattern should therefore already have been accounted for in the model calculations. Rumen fermented CHO was estimated as OM minus CP and crude fat and all uncertainty from different chemical analyses ended up in the CHO fraction. Furthermore, CHO itself can be of a very heterogeneous nature. Hindrichsen et al. (Reference Hindrichsen, Wettstein, Machmüller, Soliva, Bach Knudsen, Madsen and Kreuzer2004) investigated the impact of feedstuff CHO composition on in vitro CH4 production and found that the starch, cellulose, hemicellulose, lignin, pectin or sugars concentration in the feed influenced CH4 production differently. In the present calculations, CHO was divided into disaccharides and polymers of glucose. Pectin, however, consists largely of uronic acid (C6H10O7), which has a molar weight of 194 g/mol. Furthermore, hemicellulose consist of C5 sugars like xylose or arabinose (C5H10O5) with a molar weight of 150 g/mol. Therefore, assuming the same molar weight for all polymers may have created bias in the calculated amount of glucose units available for VFA production.
Rumen ammonia concentration explained 6% of the variation in DIF_CH4. As NH3 production is an end product of protein fermentation, equation (2) indicated that CH4 production increases with increased fermentation of protein. In the present calculations, it was assumed that 1 mol of amino acids yielded 0.55 mol of glucose unit, according to evidence that CP fermentation yields less VFA than CHO fermentation (France and Dijkstra, Reference France and Dijkstra2005). This factor might not be entirely correct as its actual value is unknown and it might differ between individual amino acids. It is difficult to quantify the amount of CP fermented to VFA in vivo due to N recycling and N absorption. Besides, CP is derived from chemical analysis of the N content of feed or digesta, which is then multiplied by 6.25. But CP also contains non-amino acid nitrogen, which cannot yield any VFA. Furthermore, the assumption that the same amount of glucose units delivered by feed protein degradation was also used for microbial protein synthesis can include some bias.
DCARB model
Using a ruminal C balance based on measured duodenal C flow to estimate VFA production was a novel approach, and the high correlation between results with the DOM and DCARB model showed that a ruminal carbon balance estimated CH4 production just as well as estimations from true rumen digestibility of individual nutrients. Furthermore, the simple regression of calculated against measured CH4 production showed a higher R 2 for the DCARB than for the DOM model (0.43 v. 0.36). This was surprising, as carbon flow does not take into account the oxidation state of the carbon, as the nutrients to some degree do. The DCARB model had the advantage that it did not have to cope with the internal turnover of CP, as N was not included in the calculations. It was assumed in the calculations that the difference between feed intake and duodenal flow was fermented to VFA, however, re-circulation of N is a source and sink of N to the rumen environment additional to feed N. There is also a certain recirculation of C via bicarbonate, but this was not taken into account, as it is unlikely that large amounts of bicarbonate C reach the duodenum due to the low pH in the abomasum.
The butyrate proportion was estimated with a positive factor in the multiple regression (equation (3)). As butyrate is absorbed faster than other VFA, the assumption of an equal proportion of butyrate in rumen VFA to the proportion of butyrate in rumen VFA production can cause bias (Nozière et al., Reference Nozière, Ortigues-Mary, Loncke and Sauvant2010). It was unclear why this was only revealed for DCARB and not with DOM, as it should have been a source of bias then with both approaches. The same argument holds for pH. Such effects are probably closely related to those of CHO digestion, which appeared more explanatory for bias with DOM. Dietary CHO composition such as the proportion of maize silage will affect rumen digestion characteristics and therefore the VFA composition and rumen pH (Nozière et al., Reference Nozière, Ortigues-Mary, Loncke and Sauvant2010).
The impact of the dietary fat content (%) was estimated by −1.23 in equation (3). It is widely accepted that fat addition reduces CH4 production (Grainger and Beauchemin, Reference Grainger and Beauchemin2011), and a negative estimate is therefore reasonable. The fact that fat was not digested in the rumen was taken into account in the DOM model. In the DCARB approach, fat C was included in the duodenal C flow and should have been accounted for in the measurements used. However, dietary fat content added further information to the model, and fat apparently had a direct effect on rumen fermentation or methanogens by reducing their abundance or activity (Poulsen et al., Reference Poulsen, Schwab, Jensen, Engberg, Spang, Canibe, Højbjerg, Milinovich, Fragner, Schleper, Weckwerth, Lund, Schramm and Urich2013). Although this again would hold for both methods, the fat effect might be confounded with that of other factors related to CHO digestion, which appeared explanatory with DOM, hence reducing the partial R 2 of fat. Even though there was no significant effect of fat on CHO digestion found in experiments A and B, other studies did report a direct effect on digestion (e.g. Chung et al., Reference Chung, He, McGinn, McAllister and Beauchemin2011), depending on the level of fat supplementation and FA composition (Beauchemin et al., Reference Beauchemin, Kreuzer, O’Mara and McAllister2008).
VFA concentration v. VFA production
Most models, including the present one, are based on measurements of VFA concentrations, and not the actual VFA production (Nozière et al., Reference Nozière, Ortigues-Mary, Loncke and Sauvant2010). Storm and Kristensen (Reference Storm and Kristensen2010) found that the VFA concentration is higher and the pH is lower in the medial rumen than in the ventral rumen. Despite that, the Ac to Pr ratio was similar in the medial and ventral rumen. This indicates that the ratio between different VFA was the same but their production or absorption rate differed. Furthermore, Dijkstra (Reference Dijkstra1994) and Nozière et al. (Reference Nozière, Ortigues-Mary, Loncke and Sauvant2010) reported that fractional absorption rates depend on rumen pH and concentration of the individual VFA (mmol/l rumen fluid) and are therefore not always proportional to the relative concentration of individual VFA (in mol/100 mol VFA) in the rumen. Bannink et al. (Reference Bannink, France, Lopez, Gerrits, Kebreab, Tamminga and Dijkstra2008) found in a modelling study that fractional absorption rates differed for the individual VFA and that fractional absorption rates increased by 23%, 29% and 32% for Ac, Pr and Bu, respectively, with a decrease in rumen pH from 6.4 to 5.6. If the change in fractional absorption rate is not identical for the individual VFA, the molar proportion of individual VFA also depends on fractional absorption rates. In the present data set, average rumen pH was above 6 for all diets but several single observations were below 6, and the lowest observation was 5.3. However, when the minimum pH and the number of observations below pH 6 were included as variables in the stepwise regression they were not revealed as significant variables to explain the difference between measured and calculated CH4.
Differences in fractional absorption rates could explain why in some other studies CH4 production was reduced without an effect on fermentation pattern (Chung et al., Reference Chung, He, McGinn, McAllister and Beauchemin2011; Doreau et al., Reference Doreau, van der Werf, Micol, Dubroeucq, Agabriel, Rochette and Martin2011) or the effect on fermentation pattern was not consistent with presumed effects on CH4 (Brask et al., Reference Brask, Lund, Weisbjerg, Hellwing, Poulsen, Larsen and Hvelplund2013b).
Hydrogen sources and hydrogen sinks in the rumen
It was assumed that total net H2 production (minus H2 used for FA hydrogenation) is converted into CH4. Even though H2 gas may be present in two compartments in the rumen, as dissolved H2 in the rumen fluid and as gas H2 in the gas phase, and only dissolved H2 is available for methanogens, the amount of H2 gas exhaled by ruminants is negligible (Janssen, Reference Janssen2010), justifying the assumptions made. Hammond et al. (Reference Hammond, Burke, Koolaard, Muetzel and Pinares-Patiño2013) showed in sheep fed white clover and grass that CH4 production would be increased by <1% if expired H2 also was converted CH4. This agrees with our own findings for H2 exhaled in experiments A and C (Hellwing unpublished data). Hydrogen sinks other than CH4 exist as H2 can be used in reductive acetogenesis, or for reduction of nitrate or sulphate. Although considered quantitatively unimportant (Morgavi et al., Reference Morgavi, Forano, Martin and Newbold2010), these alternative H2 sinks might explain part of the residual variation. Moss et al. (Reference Moss, Jouany and Newbold2000) assumed that 90% of the H2 surplus produced during VFA production is recovered in CH4. However, adding a factor of 0.9 to equation (1) as proposed by Moss et al. (Reference Moss, Jouany and Newbold2000) did not improve the prediction of CH4 with the present data. In in vitro incubations, Demeyer (Reference Demeyer1991) found evidence that H2 recovery might vary depending on substrate, as H2 recovery rates from 76% to 98% were observed for soluble CHO. This suggests that H2 recovery would depend on diet composition, and that assumptions made on H2 recovery would affect accuracy of CH4 prediction.
Another H2 sink in the rumen is microbial growth. Microbial OM is more reduced than dietary OM, that is, more H2 is bound in protein and fat compared with the feed OM (Van Soest, Reference Van Soest1994). However, microbial synthesis parameters were submitted to the stepwise regression in the present approach but were not revealed as significant.
Adding unsaturated FA to the diet increases the proportion of H2 used for hydrogenation. The proportion of total H2 from VFA production used for hydrogenation was low (3.3%) in the present data but the increased use of H2 for hydrogenation of FA accounted for 15% of the reduction in CH4 with the addition of rapeseed fat in experiments A and B. Competition for H2 alone cannot account for the reduction in CH4, as Blaxter and Czerkawski (Reference Blaxter and Czerkawski1966) found that 0.75 mol reduction in CH4/mol linoleic acid added could be attributed to hydrogenation while total CH4 depression was 2 mol/mol linoleic acid or more. Hegarty (Reference Hegarty1999) reported that both saturated and unsaturated FA are toxic for rumen micro-organisms, and that the toxicity had a larger effect on CH4 than hydrogenation. The fat source in the present trial was rapeseed fat with mainly monounsaturated C18:1. Blaxter and Czerkawski (Reference Blaxter and Czerkawski1966) used linseed, which is rich in polyunsaturated C18:3 and therewith consumes three times as much H2 for total biohydrogenation than C18:1. However, up to 40% of the decrease in CH4 production with fat supplementation can be attributed to hydrogenation according to Blaxter and Czerkawski (Reference Blaxter and Czerkawski1966). For fat supplementation with mainly C18:1 like in the present data, 6% to 15% can be expected.
Even though the rumen microbiota is regarded as strictly anaerobic, O2 enters the rumen as the cows swallow air, or via epithelia in the rumen wall from blood. Barry et al. (Reference Barry, Thompson and Armstrong1977) found a minimum concentration of 1% to 3% O2 in the rumen of sheep during the whole day, with maximum concentrations as high as 9% after feeding. The O2 is quickly reduced to water, and it remains questionable how important this H2 sink is. Demeyer et al. (Reference Demeyer, van Nevel and Henderson1972) found that O2 injection to the rumen fluid reduced CH4 production in vitro, however, also reduced substrate utilization. Demeyer (Reference Demeyer1991) reported a decrease in CH4 production, but also in VFA production, when O2 was present in rumen fluid. Oxygen is therefore not an option as a mitigation strategy, but it has to be regarded as a possible H2 sink.
Hydrogen recovered as CH4 in the hind gut has been suggested to be substantially lower than in the rumen (Demeyer, Reference Demeyer1991) and is estimated to be between 50% and 65% (Demeyer, Reference Demeyer1991; Moss et al., Reference Moss, Jouany and Newbold2000). According to Demeyer (Reference Demeyer1991), this can be attributed to the absence of protozoa, and increased propionate production and reductive acetogenesis as H2 sinks, compared with rumen fermentation. The fermentation pattern in the hind gut is difficult to measure, and it might change between the different compartments of the hind gut. However, assuming a H2 recovery of 0.65 improved the calculations compared to assuming 100% recovery, therewith supporting the estimates of Demeyer (Reference Demeyer1991) and Moss et al. (Reference Moss, Jouany and Newbold2000).
Diurnal variation in CH4 and rumen fermentation
CH4 production during the day was influenced by feeding, fermentation rate and, to a minor extend, fermentation pattern as shown in Figure 4. The hourly CH4 production showed a minor peak after morning feeding and a major peak after evening feeding. Correspondingly, Van Zijderveld et al. (Reference Van Zijderveld, Gerrits, Apajalahti, Newbold, Dijkstra, Leng and Perdok2010) found only a single peak after morning feeding in sheep fed one restricted meal per day. Similar to CH4, VFA concentration in the rumen was highest after the evening feeding, but rumen pH was inverse to CH4 production and VFA concentration. A similar pattern was observed by Sun and Gibbs (Reference Sun and Gibbs2012), as a low pH indicates a high rate of fermentation while pH is higher during rumination and when the animal is resting.
Comparing the CH4 production with fermentation parameters illustrates that fermentation intensity, that is, the amount of OM fermented, indicated by the concentration of VFA in the rumen fluid, is a major driving factor of CH4 production. Total VFA concentration follows the same pattern as CH4 production.
The RHB was used as an alternative to Ac to Pr ratio for interpreting diurnal variation in VFA production as it should reflect the amount of H2 arising from fermentation more accurately than Ac to Pr ratio. The RHB peaked just before morning and evening feeding as presumably the rapidly fermentable nutrients had disappeared, and the fibre part was remaining in the rumen. This resulted in more methanogenic fermentation pathways, reflected in high RHB. At 0600 h (time=6), the CH4 production increased whereas total VFA concentration only started to increase again at time=8 (Figure 4a). Figure 4b demonstrates that there was a peak in RHB, which explains the early increase in CH4 production without an increase in VFA concentration at time=6. Likewise, the increase in VFA concentration at time=22 was not followed by an increase in CH4 because of the decline in RHB. The rumen VFA pattern can hence explain minor differences between the total VFA concentration and CH4 production, with fermentation intensity (i.e. the amount of OM fermented to VFA) being a more important determinant of CH4 production than fermentation pattern.
Both CH4 and CO2 are produced in the rumen during fermentation. However, the major part of expired CO2 production arises from respiration energy metabolism of the animal (Madsen et al., Reference Madsen, Bjerg, Hvelplund, Weisbjerg and Lund2010). The CH4 to CO2 ratio as a daily average roughly follows the CH4 production as a fraction of GE intake. In Figure 4d, CH4 production and CH4 to CO2 ratio follow each other during the night (between evening and morning feeding) but after morning feeding and during the day, the CH4 to CO2 ratio increases proportionally more than CH4 production, indicating that there is proportionally more CH4 produced than CO2 during the day than during the night. Possibly, this reflects the higher feed intake during day time.
Conclusions
Feed intake and the amount of feed digested in the rumen are the most important determinants for daily CH4 production. A measured ruminal carbon balance combined with measured VFA concentrations appeared to predict CH4 production just as well as calculations based on measured rumen digestion of individual nutrients. Although measurements of digestibility and rumen fermentation pattern improved the prediction of CH4 production, a high variability remained with both methods of calculation. This indicates that other factors such as internal rumen turnover, differentiation among individual VFA in their fractional rate of absorption, or variation in H2 recoveries affected CH4 production as well. Nevertheless, the diurnal pattern of CH4 production closely followed the diurnal pattern of rumen fermentation characteristics, indicating the close association between the two.
Acknowledgements
The work was funded by the Danish Ministry of Food, Agriculture and Fisheries, Mælkeafgiftsfonden, and Aarhus University. The authors would like to thank Torkild Jakobsen for the skillful assistance during the experiments.
Supplementary material
To view supplementary material for this article, please visit http://dx.doi.org/10.1017/S1751731115001184