1. Introduction
Maritime transport plays a crucial role in global trade and logistics, serving as the primary mode of transportation for the majority of international goods. Due to the significant capacity of ships, they can carry much larger volumes of cargo compared with air transport. As a result, sea transport is generally more cost-effective for shipping goods over long distances. In fact, it is estimated that approximately 90% of international trade relies on maritime transportation for the movement of goods (UNCTAD, 2014). While the occurrence of hazardous incidents in maritime transportation is relatively low annually, the consequences can be substantial due to the large capacity of ships involved. When accidents do happen, they can result in significant losses of cargo and cause detrimental impacts on the marine environment. Statistical data reveal that grounding, ship collisions and fires are among the most common types of maritime accidents (Soares and Teixeira, Reference Soares and Teixeira2001). Collision risk is one of the most serious risks in maritime traffic, which not only causes damage to ships, but also may affect marine ecosystems, such as oil spills. Therefore, it is of great practical significance to develop real-time collision risk management technology for maritime vessels to improve navigation safety and protect the marine ecological environment. In addition, with the development of the internet of things and artificial intelligence, the technology of monitoring and prediction of collision risk has also been developed rapidly, which has promoted the in-depth research and the expansion of application.
Because the majority of ship collision avoidance systems have embraced the Distance to Closest Point of Approach (DCPA) and Time to Closest Point of Approach (TCPA), they tend to offer a momentary snapshot of the situation rather than an ongoing assessment over time. In this investigation, we have implemented an angle interval to enhance the sensitivity of the newly computed vessel conflict ranking operator (VCRO) (Zhang et al., Reference Zhang, Goerlandt, Montewka and Kujala2015). Through a comparative analysis of these VCROs with the angle intervals delineated in prior literature, we gain a deeper insight into their distinctions and their applicability for real-time vessel avoidance.
Ultimately, the aim of this paper is to develop a more accurate ship pairwise conflict strategy that can identify high-risk ships and warn them in real-time.
The remainder of the paper is organised as follows: Section 2 outlines a literature review pertinent to this research; Section 3 discusses the defining of the VCRO model with collision avoidance; Section 4 presents the application with data simulation; and Section 5 shows the results with the sensitivity of the detection algorithm.
2. Literature review
This chapter provides a literature review of previous studies that have used Automatic Identification System (AIS) data to analyse maritime traffic and investigate the environment of close calls in traffic. The review highlights the various approaches used in these studies, such as risk assessment models, collision avoidance strategies and simulation models.
2.1 Research on marine transportation using AIS data
Automatic Identification System (AIS) data provide a platform for information exchange between ships and land, and AIS data contain a vast amount of real-time navigation data, including the ship's latitude and longitude, speed, and heading. These data are continuously broadcast by vessels to other vessels and shore-based stations, allowing for the monitoring of vessel movements and traffic conditions.
The continuous nature of AIS data enables the analysis and study of a ship's dynamics over time, including its behaviour in various waterways. These data are increasingly used in research on marine transportation safety and marine traffic engineering, as it provides a valuable source of information for understanding vessel traffic patterns and identifying potential risks and hazards.
In addition, AIS data provide richer information compared with radar, making it a feasible ship avoidance system. By analysing AIS data from multiple vessels, potential collision risks can be identified, allowing proactive measures to be taken for avoidance. This can help to improve safety in busy waterway, and reduce the risk of accidents and collisions.
AIS data have been available for several years, but in the early stages, the quality of the data was not optimal (Graveson, Reference Graveson2004). However, in recent years, there have been significant improvements in the data quality as technological advancements have been made in the field (Felski and Jaskolski, Reference Felski and Jaskolski2013). One critical factor that affects data quality is the proper placement of antennae, which can have a significant impact on the accuracy of the data collected (Last et al., Reference Last, Hering-Bertram and Linsen2015).
Researchers have used AIS data to study various aspects of marine transportation safety and marine traffic engineering. For example, collision avoidance studies have been conducted using AIS data to develop strategies for preventing ship collisions (Mou et al., Reference Mou, Van der Tak and Ligteringen2010). Additionally, vessel channel analysis has been performed using AIS data to study the behaviour of ships in various waterways and to identify areas of congestion or high traffic volume (Xiao et al., Reference Xiao, Ligteringen, Van Gulijk and Ale2015).
Another important application of AIS data is the analysis of the risk of marine vessel collisions. By studying the dynamics of ships over time using AIS data, researchers can identify patterns and develop models to predict the likelihood of collisions between ships. This information can be used to develop strategies for avoiding collisions and minimising the risk of accidents at sea (Li et al., Reference Li, Meng and Qu2012; Wang et al., Reference Wang, Zhang, Chen, Chu and Yan2013; Mazaheri et al., Reference Mazaheri, Montewka and Kujala2014).
Overall, AIS data have become an essential tool in the field of marine transportation research, and the continued improvement in data quality and availability is expected to drive further advances in the field.
2.2 Near-miss collisions
The field of ship collision near-miss detection is relatively new compared with the analogous studies in land-based road traffic research, such as the traffic conflict technique (TCT) (Laureshyn et al., Reference Laureshyn, Svensson and Hydén2010). TCT has been used to determine the safety level of transportation systems by considering all conflict scenarios, including actual accidents and accidents that users may experience while using the system.
Similarly, in marine transportation, the location of two ships nearest points during near-miss collisions can be determined using AIS data, and the continuity data of the two ships can be used to determine why there was not a collision. By analysing these data, users can comprehend the system's degree of safety.
The TCT concept recognises that different levels of encounter likelihood have varied fault tolerances, and accidents are more likely to occur when fault tolerances are exceeded. One of the main benefits of TCT is that in marine transportation, the likelihood of many ships encountering each other is often low, making it possible to gather more reference data about the safety level system more quickly for analysis.
Debnath and Chin (Reference Debnath and Chin2010) explains that conflict resolution techniques used in road traffic studies are not suitable for marine transportation due to the unique challenges presented by the marine environment. Therefore, a more accurate pairwise conflict strategy is needed for ships.
Zhang et al. (Reference Zhang, Goerlandt, Montewka and Kujala2015) focuses on the risk differentiation of ships in the case of near-miss collisions, using the VCRO to calculate the risk. The VCRO model used in the paper has been extended to cope with more realistic situations.
By using the collision attempts data, the researchers can identify which working ships in the study area are at high risk of collision and need to be warned. This information is crucial for improving the safety of marine transportation and preventing accidents.
TCT and related methods can assist to create practical accident prevention tactics and enhance our understanding of collision hazards in sea transportation.
2.3 Vessel conflict risk operator (VCRO)
The VCRO model is a mathematical formula used to rank the severity of encounters between two ships based on several factors that affect the complexity of the encounter. These factors include the distance between the two ships, their relative speed and the difference between their headings. The VCRO model is based on expert judgment and parametrised using AIS data points from a reference dataset of encounter situations.
The model is designed to provide a quantitative measure of the risk of collision between two ships, which can then be used to determine the severity of the encounter and take appropriate measures to avoid collision. The model can also be used to differentiate between encounters with high, medium and low levels of risk. This information can be used to prioritise actions and allocate resources for collision avoidance (Zhang et al., Reference Zhang, Goerlandt, Montewka and Kujala2015). A novel criterion for estimating ship–ship collision probability and a new model have been proposed (Montewka et al., Reference Montewka, Hinz, Kujala and Matusiak2010). The new collision criterion is named the Minimum Distance to Collision (MDTC) (Montewka et al., Reference Montewka, Goerlandt, Lammi and Kujala2011a).
To improve the accuracy of the VCRO model, the researchers incorporated the safety domain and MDTC (Montewka et al., Reference Montewka, Goerlandt and Kujala2011b) into the calculation. The safety domain is defined as the area around a ship in which it can operate safely, considering its size and the environment in which it is operating. The MDTC is the minimum distance that two ships must maintain to avoid collision, and is based on the size and manoeuvrability of the ships.
By incorporating the safety domain and MDTC into the VCRO model, researchers were able to adjust the relative distance parameter to take into account the actual safe operating distance between two ships, rather than just their proximity to each other. This improved the accuracy of the model by providing a more realistic assessment of the risk of collision (Zhang et al., Reference Zhang, Goerlandt, Kujala and Wang2016).
The regional model developed in the study allows for the assessment of near-miss collision risk for multiple vessels in an open water area, which is an improvement over the original ship pair risk assessment model. However, the model only considers a limited number of ship kinematics factors, such as distance, relative course and speed. Other important factors that can influence near-miss collision risk, such as weather, climate and human operations, have not been included in the model. Therefore, the model may not accurately reflect the real-world near-miss collision risk in some situations.
Moreover, the accuracy of the model is highly dependent on the availability of relevant data, and more data of various complex situations of multiple vessel encounters are necessary to optimise the model parameters. Without adequate data, the model's effectiveness may be limited. Overall, while the model is a significant improvement over previous models, it still has limitations that need to be considered when using it for risk assessment in real-world situations (Zhang et al., Reference Zhang, Feng, Qi, Shu, Zhang and Wang2019).
2.4 Research conceptual framework
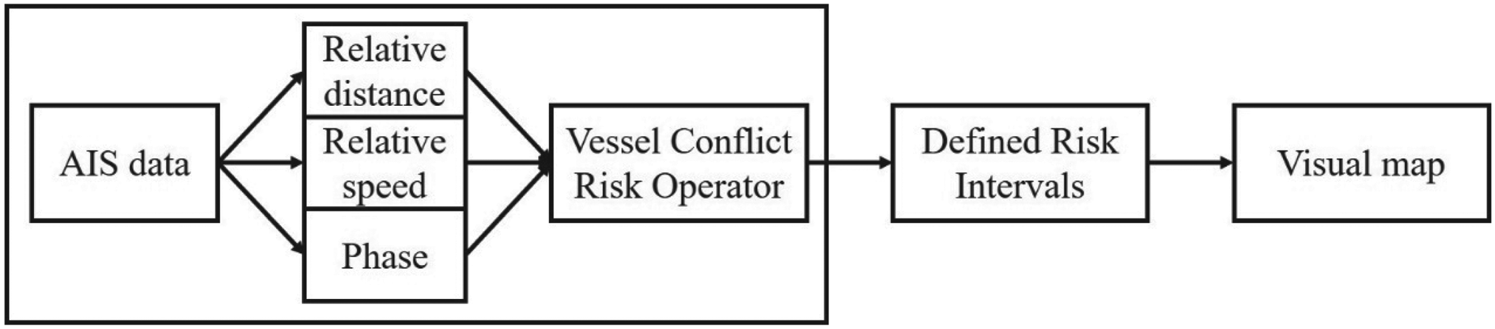
The VCRO formula mentioned here is used to calculate the vessel conflict ranking operator, which is a measure of the level of risk associated with two ships in a given period of time. By calculating the relative distance, relative speed and angle between two ships using their AIS data, a composite VCRO graph can be generated that shows the level of risk over time (Zhang et al., Reference Zhang, Goerlandt, Montewka and Kujala2015). Figure 1 shows the conceptual framework.
Conceptual framework

In this research, we have incorporated an angle interval to enhance the sensitivity of the newly computed VCRO. Through comparing these VCROs with angle intervals suggested in prior literature, we aim to gain deeper insights into their disparities and employ them for real-time vessel avoidance. The ultimate goal is to refine a ship pairwise conflict strategy for identifying high-risk vessels more accurately and providing real-time warnings.
3. Defining the vessel conflict ranking operator
The VCRO value is a metric used to evaluate the risk of a collision between two vessels when they are sailing in close proximity. By ranking the VCRO values, a risk interval can be established, with higher rankings indicating a higher risk of collision and lower rankings indicating a lower risk of collision. The mathematical models and AIS data needed for the assessment are constructed according to expert definitions, while the VCRO value is determined based on assessment criteria specified by maritime experts (Zhang et al., Reference Zhang, Goerlandt, Montewka and Kujala2015).
3.1 Model content
DCPA and TCPA have been used as measures to assess the risk of ship collision in previous studies. DCPA refers to the distance between the two vessels at the time they are closest to each other, while TCPA is the time it takes for the two vessels to reach that closest point of approach. However, these metrics may not always provide a reliable and precise indication of the severity or probability of a ship collision, as they do not consider other factors such as the relative speed and heading of the vessels. In addition, DCPA and TCPA only provide a snapshot of the situation at a particular moment in time, rather than a continuous assessment of the situation over time. It is important to note that the original DCPA and TCPA values stem from data obtained from ARPA radar, which may sometimes entail uncertainty.
Additionally, DCPA does not account for the relative speed of the vessels, which is an important factor in assessing the risk of collision. For instance, two vessels traveling at a slow speed may have a small DCPA, but the risk of collision may still be high if they are traveling towards each other at a high relative speed. Similarly, two vessels traveling at a high speed may have a large DCPA, but the risk of collision may be low if they are traveling parallel to each other with a significant distance between them. Therefore, relying solely on DCPA as a measure of collision risk may not provide a comprehensive assessment. Incorporating AIS data as an auxiliary can enhance the completeness of the observation system.
To address these limitations, the VCRO incorporates a mathematical model that can be applied more extensively to various ship encounter situations, effectively overcoming the issues associated with DCPA and TCPA measurements.
The model considers multiple factors, as outlined by Zhang et al. (Reference Zhang, Goerlandt, Montewka and Kujala2015) including:
1. the relative distance of the two ships;
2. the relative speed of the two ships;
3. the phase difference between the two ships.
The VCRO model incorporates the relative distance, relative speed and the difference between the headings of two vessels to determine the level of risk of a potential collision. The model analyses these factors and produces a VCRO value that indicates the level of risk associated with the encounter. This value provides insight into the complexity of the encounter, and can help to identify high-risk situations where immediate action may be necessary to prevent a collision. It is important to note that while the VCRO model prioritises the risk of collision, it does not the specific actions or timing needed to avoid a collision between ships.
3.1.1 Relative distance
The distance between two points given their latitude and longitude can be calculated using the Haversine formula in Equation (1), which is one of the commonly used formulae in spherical trigonometry:

where d represents the distance between the two points, r is the radius of the Earth (typically taken as the average radius, approximately 6,371 km), ${\varphi _\textrm{1}}$ and ${\varphi _\textrm{2}}$
 are the latitude of point 1 and latitude of point 2, and ${\lambda _\textrm{1}}$
 and ${\lambda _\textrm{2}}$
 are the longitude of point 1 and longitude of point 2.
Since the simulation data in this study are based on working ships in offshore wind power sea areas, the model calculation complexity is reduced by considering distances within 3 nautical miles as a plane coordinate system. The formula of the plane coordinate system is then used for calculations.
The Pythagorean theorem is a common mathematical formula that relates to the sides of a right triangle, where the square of the hypotenuse (the longest side) is equal to the sum of the squares of the other two sides. In the case of the VCRO model, this theorem is applied to calculate the relative distance between two ships in a two-dimensional coordinate system.
The latitude and longitude coordinates of the two ships' centre points are used to calculate the distance between them. The Pythagorean theorem is applied by treating the difference in latitude and longitude coordinates as the two sides of a right triangle, with the relative distance between the two ships being the hypotenuse. The resulting relative distance value is then used as one of the inputs to the VCRO model to assess the risk of collision between the two ships.
It is important to note that this calculation assumes a flat two-dimensional coordinate system, which may not accurately reflect the curvature of the Earth in certain situations. However, this approximation is often sufficient when assessing the relative distance between two ships that are in close proximity to each other.
3.1.2 Relative speed
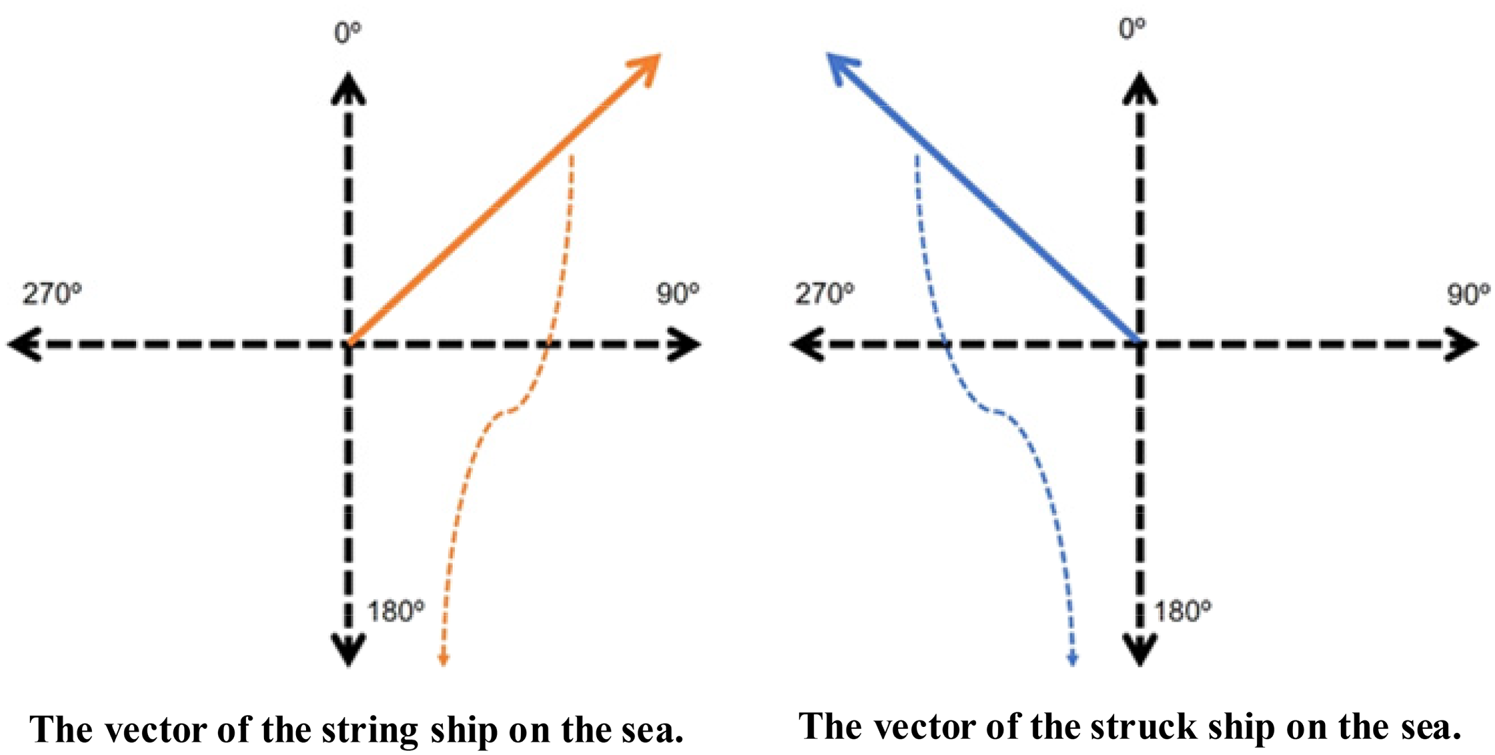
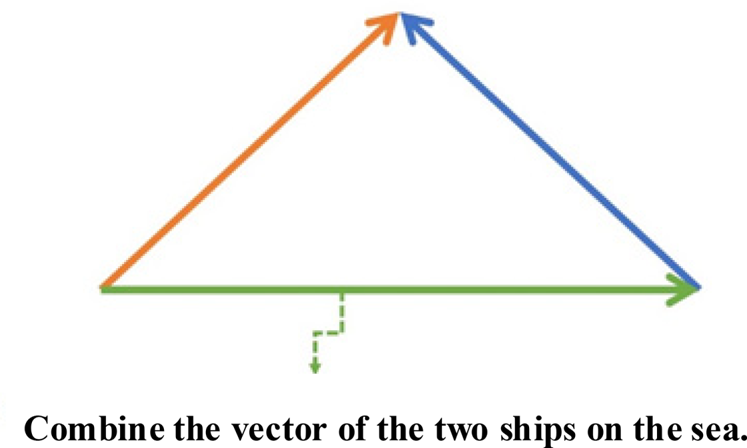
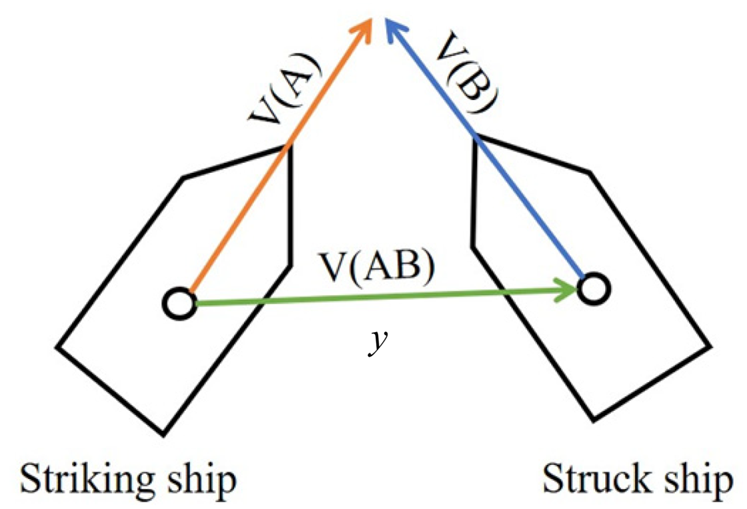
To calculate the relative speed between two vessels, the model considers the heading angles of each vessel's navigation. First, one vessel is designated as the striking ship and the other as the struck ship. Next, the longitudinal and latitudinal components of the vectors acting on each vessel are calculated to obtain the respective vectors of the two vessels on the sea. Finally, the longitudinal and latitudinal component vectors of both vessels are combined to obtain the final relative speed of the two vessels (Figures 2 and 3).
Respective vectors of the two vessels at sea

Relative speed combined with the vector of the two ships at sea

The calculation of the resultant vector of two vectors is based on the following steps.
1. Calculate the longitudinal and latitudinal components of the striking ship's speed by multiplying the ship's speed by the cosine and sine of its heading angle, respectively.
2. Calculate the longitudinal and latitudinal components of the struck ship's speed by multiplying the ship's speed by the cosine and sine of its heading angle, respectively.
3. Calculate the longitudinal and latitudinal components of the vectors acting on the striking ship by multiplying the ship's displacement by the acceleration in the longitudinal and latitudinal directions, respectively.
4. Calculate the longitudinal and latitudinal components of the vectors acting on the struck ship by multiplying the ship's displacement by the acceleration in the longitudinal and latitudinal directions, respectively.
5. Combine the longitudinal and latitudinal components of the vectors acting on both vessels to obtain the final longitudinal and latitudinal components of the relative speed between the two vessels.
6. Use the method of calculating vectors to calculate the magnitude of the relative speed.
By considering the heading angles of both vessels, this method offers a more precise calculation of the relative speed between them compared with a simple subtraction of their speeds.
3.1.3 Phase
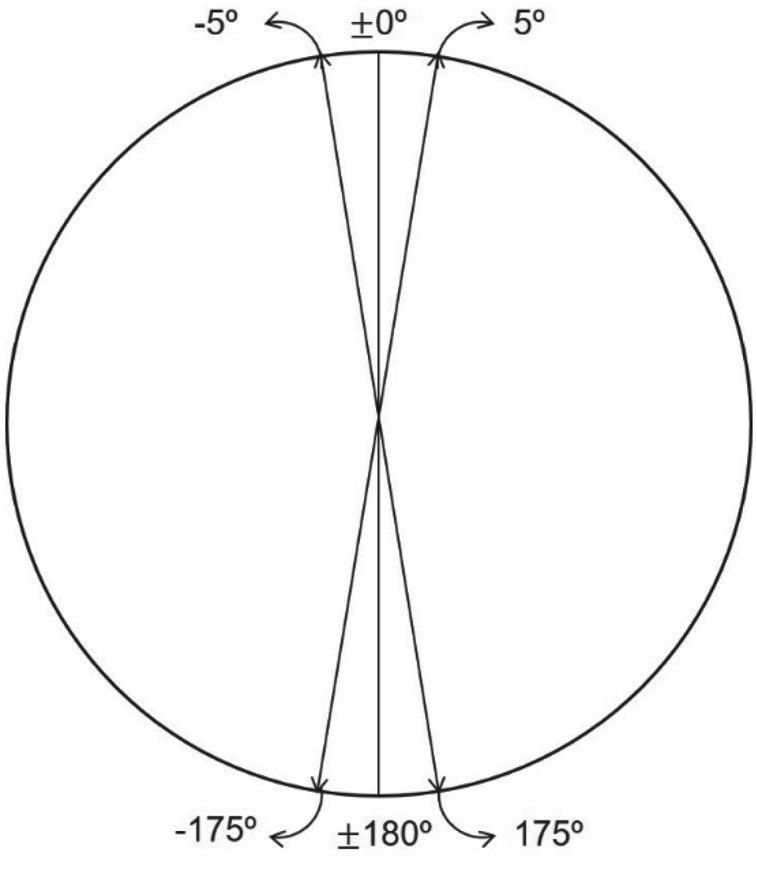
The heading angles of two adjacent ships can be used to determine their direction of motion. If the difference between the heading angles of these two ships is between 175° and 185° (i.e. 175°≤|Ho-Ht|≤185°), then they are in the approach period or called head-on situation. If the difference between the heading angles of these two vessels presents less than 5° or great than 355° (i.e. 175°≤|Ho-Ht|≤185°), then they are in the overtaking situation. This information can be obtained from the AIS data, which provides real-time updates of vessel positions and heading angles. By analysing the heading angles over a certain time interval, it can be determined whether the two vessels are approaching or leaving each other. This information is important to assess the risk of collision and to take appropriate actions to avoid collision.
To further explain, the approach period is the time period during which two vessels are approaching each other, while the leaving period is the time period during which two vessels are moving away from each other. During the approach period, the distance between the two vessels is decreasing, and therefore, the risk of collision is increasing. However, during the leaving period, the distance between the two vessels is increasing, and the risk of collision is decreasing. By analysing the heading angles of two adjacent vessels over time, the VCRO model can determine whether the two vessels are in the approach or leaving period, which is a critical factor in assessing the risk of collision and taking preventive measures to avoid it.
3.2 Model structure
When constructing the mathematical model for the VCRO, the model takes into account the risk of ship collision. The model considers the relative distance, relative speed and phase difference between the two vessels.
The risk of collision between two vessels cannot be determined solely based on their distance; other factors must also be considered. When a vessel is underway, the likelihood of a collision does not only increase as the distance between vessels decreases. Many other factors, such as the speed and direction of navigation, as well as the weather conditions at sea, must also be considered.
Based on the relationship in VCRO described above, we can explain it using the following equations.
1. Relative distance $x$
 :

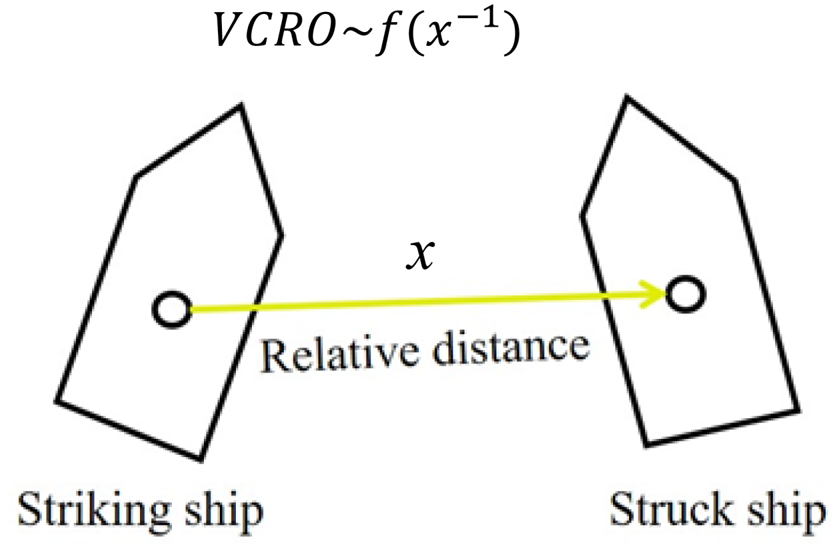
In maritime navigation, the shorter the relative distance between two vessels, the higher the risk of collision between the two vessels, so in this model, the calculation of the relative distance must be negative once to indicate that the risk of being close is high (Figure 4). In this paper, the symbol x in Equation (2) denotes the relative distance between two vessels.

2. Relative speed $y$
:

Relative distance x

In fact, in the VCRO model, the relative speeds of the two ships are not added, but multiplied to indicate the greater risk of being closer together. Therefore, the relative speed between two vessels is a key factor in assessing the risk of collision. By multiplying the relative velocity with the distance, the model emphasises the importance of this factor and provides a more accurate assessment of the risk of collision. In this paper, the variable ‘y’ in Equation (3) represents the relative speed between two vessels (Figure 5).

Relative speed y

The VCRO takes into account the relative speed between two vessels to assess the risk of a potential collision. A higher relative speed means that the two vessels are moving towards each other at a faster rate, which increases the risk of collision.
As the relative speed increases, the risk of collision also increases. This is because a higher relative speed means that the two vessels will cover a greater distance in a shorter amount of time, which reduces the reaction time available to take evasive action. Additionally, a higher relative speed also means that the impact of a potential collision would be more severe.
3. Phase $z$
:

In an overtaking situation, the relative speed between the two ships may be low, but the risk of collision may still be low if the overtaking ship maintains a safe distance and passes the other ship without causing any obstruction or danger. However, if the overtaking ship fails to maintain a safe distance or misjudges the other ship's speed and direction, the risk of collision may increase. In this case, the phase of the two ships becomes important as it can affect the manoeuvrability and reaction time of the ships involved.
For example, if the overtaking ship is positioned at a point where it is in the other ship's blind spot or in a position where the other ship cannot easily detect it, the risk of collision may increase. However, if the overtaking ship maintains a position where it is clearly visible to the other ship and keeps a safe distance, the risk of collision can be minimised. Therefore, in an overtaking situation, the assessment of the risk of collision must consider not only the distance and relative speed between the two ships, but also the phase of the ships to accurately determine the risk and take appropriate actions to avoid collision.
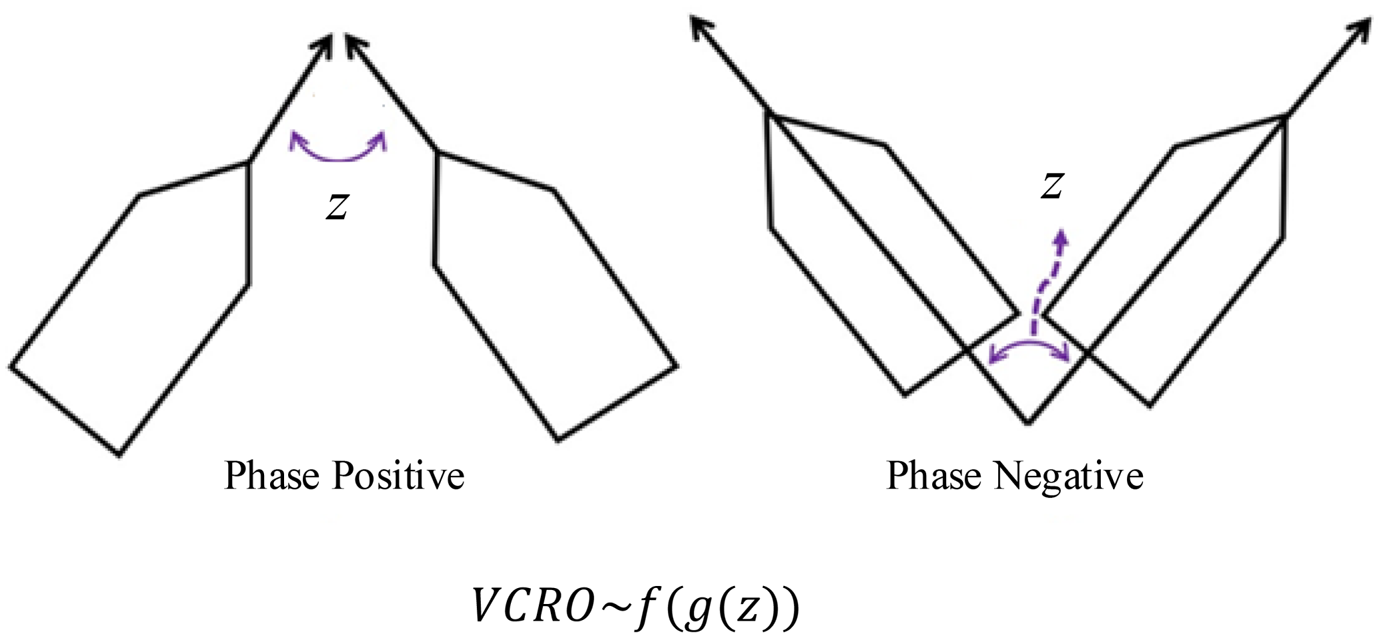
In Figure 6, the phase angle is an important factor in determining the relative position of two ships. It represents the angular position of one ship with respect to the other, measured in degrees. A negative phase angle indicates that the ships have already passed the DCPA and are moving apart from each other. Conversely, a positive phase angle indicates that the ships are approaching each other and have not yet reached their closest point of approach.
Defining of the phase z

To model the phase angle, we can use an odd periodic function g(z) with a period of 2π. The phase denotes the relative positioning of the two vessels, dictating the degree of course adjustment needed for collision avoidance manoeuvres. The symbol z in Equation (4) represents the phase between two vessels.

According to the VCRO mathematical model, the relationship between $x$ : distance, $y$
 : relative speed and $z$
 : phase is as follows:

To express the periodic function (t) with period T in terms of a series of sine and cosine functions, we can use a Fourier series expansion. The expansion can be written as


Additionally, $g(z )$ is an odd function as follows:

where ${b_k}\textrm{ = }{a_k} \cdot j,z$ as the phase.
To simplify computational demands, prior studies have proposed using solely the initial two terms of the Fourier series. This results in the following mathematical formula (Zhang et al., Reference Zhang, Goerlandt, Montewka and Kujala2015):

Equations (3) and (8), when combined, result in the following expression of the VCRO model:

The multiplication method is employed to integrate the distance and relative speed of two ships because these are the common factors that affect the probability of a potential collision between them. When the distance between two ships is significant and their relative speed is slow, the likelihood of a potential collision between them will also be low.
In Figure 7, when the heading angle difference between two ships is small (within the range of plus or minus 5 degrees), the ships are considered to be in contact. At this point, the phase factor becomes less important in assessing the risk of collision because the two ships are likely to be traveling in the same direction or nearly so. In such situations, the primary factors that influence the likelihood of collision are the relative distance and relative speed between the two ships.
±5° degrees interval

However, when one ship is overtaking another, the phase factor becomes more critical in assessing the risk of collision. In this case, the ships are not traveling in the same direction, and the phase factor helps to determine whether the overtaking ship can safely pass the other vessel without colliding with it. In such situations, the relative speed and distance between the two ships are also important factors to consider, but the phase factor helps to provide a more accurate assessment of the collision risk.
Since the literature of Zhang et al. (Reference Zhang, Goerlandt, Montewka and Kujala2015) considers only phase of 0 degrees, the VCRO model operates based on relative distance and relative speed.

Therefore, in this case, the model focuses on the relative distance and relative speed between the two ships, without considering the phase factor. This limitation becomes evident when the head-on situation results in an instantaneous VCRO value of 0, especially in cases involving sine functions such as sin(0) and sin(180).The VCRO with the added angle interval can be expressed as follows:

The values of k, m and n are determined using the least squares approach. The computation for this approach requires the use of all AIS data from ships in the research region.
The following describes the least squares method's operating model:

Let

Then


This study refers to the k, m and n values of VCRO obtained from the previous research of Zhang et al. (Reference Zhang, Goerlandt, Montewka and Kujala2015) to analyse the collected AIS data. It should be noted that the ranking range of the likelihood of ship collisions may differ depending on the scope of the study. Therefore, we will re-evaluate the calculated VCRO values for our specific research context.
The VCRO mathematical model is as follows after the parameters are stated in this paper:

where $k = 3.87,m = 1,n = 0.386$ .
3.3 K-means clustering
K-means clustering, originating from signal processing, is a technique in vector quantisation. Its objective is to divide a set of n observations into k clusters, where each observation is assigned to the cluster with the nearest mean, thereby defining cluster centres or centroids as prototypes for the clusters.
K-means clustering is a popular unsupervised machine learning algorithm used for partitioning a dataset into k distinct, non-overlapping clusters. The algorithm works iteratively to assign each data point to one of the k clusters based on the features provided. It aims to minimise the sum of squared distances between data points and their corresponding cluster centroids, which represent the centre of each cluster. K-means clustering is widely used in various fields such as data mining, image segmentation and customer segmentation for its simplicity and efficiency in grouping similar data points together.
3.4 Visual classification
Visual classification refers to the process of categorising or sorting items based on their visual characteristics or features. In practical terms, it involves using visual cues such as colour, shape, texture or patterns to classify objects into different groups or categories. This approach is widely used in various fields, including image recognition, machine learning and computer vision, where algorithms are trained to automatically classify images based on their visual content. Visual classification finds applications in diverse domains such as medical imaging, surveillance, autonomous driving and quality control in manufacturing.
As the VCRO value serves as a metric for evaluating the probability of a collision between two vessels navigating in close proximity, it is essential to translate this value into an assessment of a dangerous situation. In this paper, we suggest integrating k-means clustering with visual classification to improve visual responsiveness, enhancing both reliability and sensitivity. This will be carried out within the application and presented in Section 4.2.
4. Application
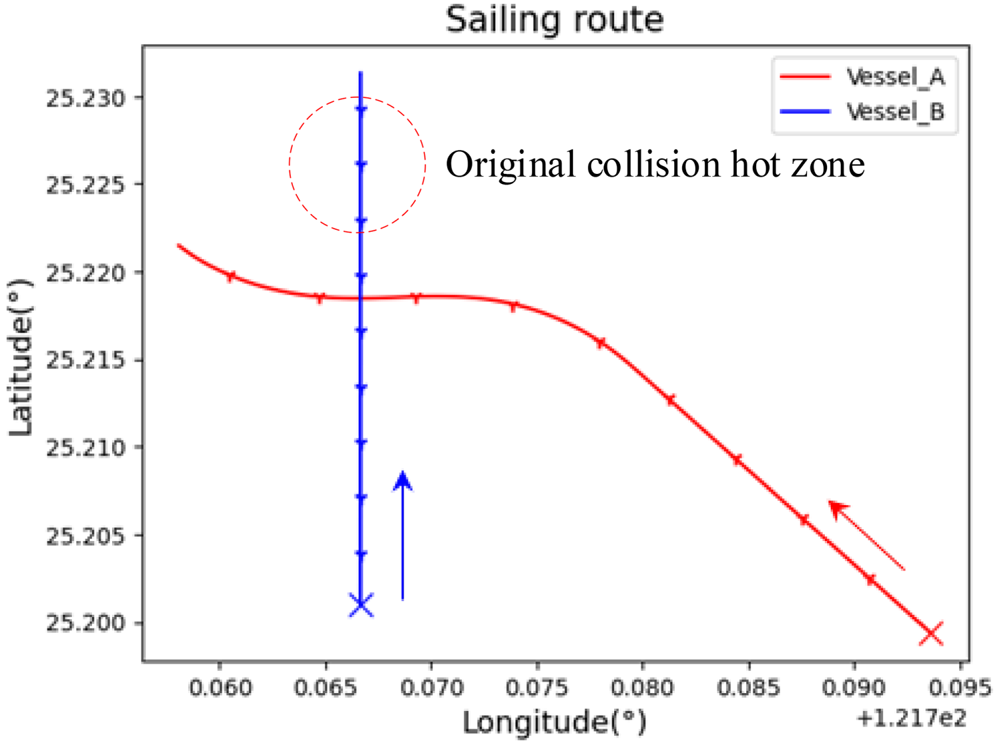
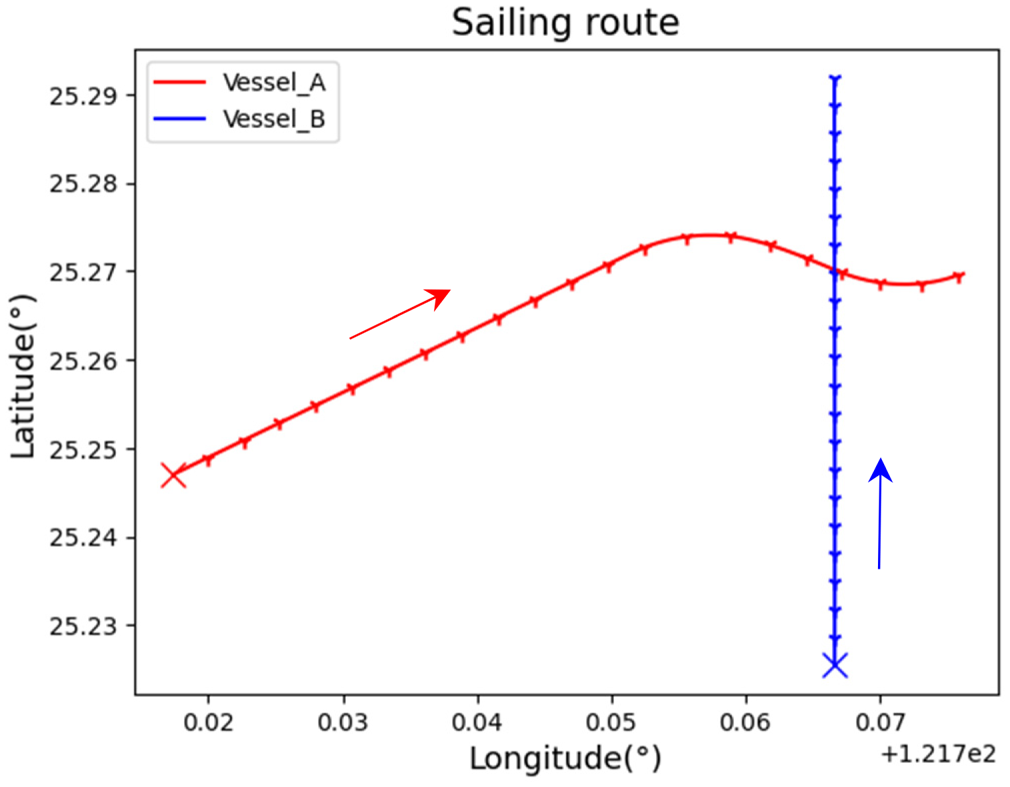
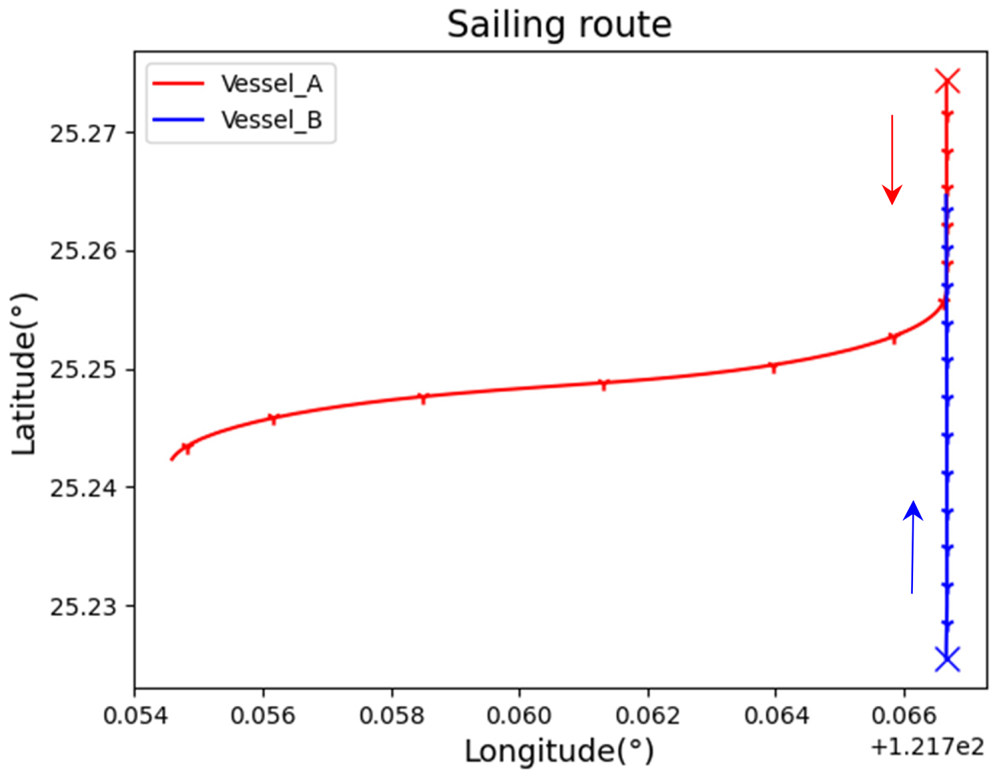
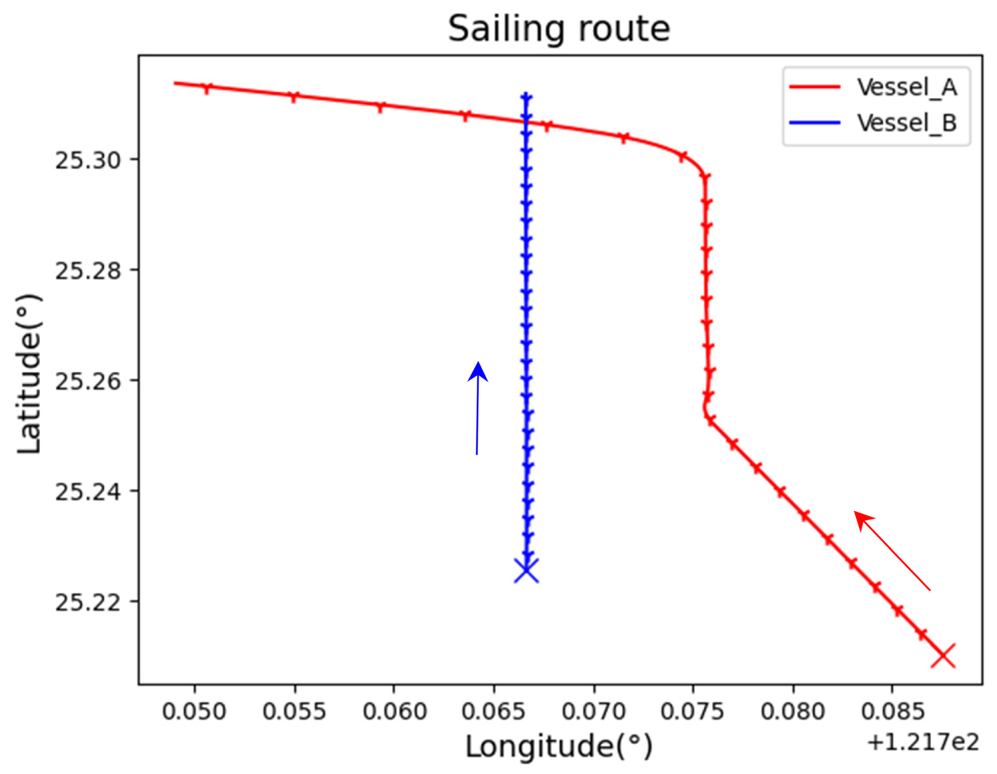
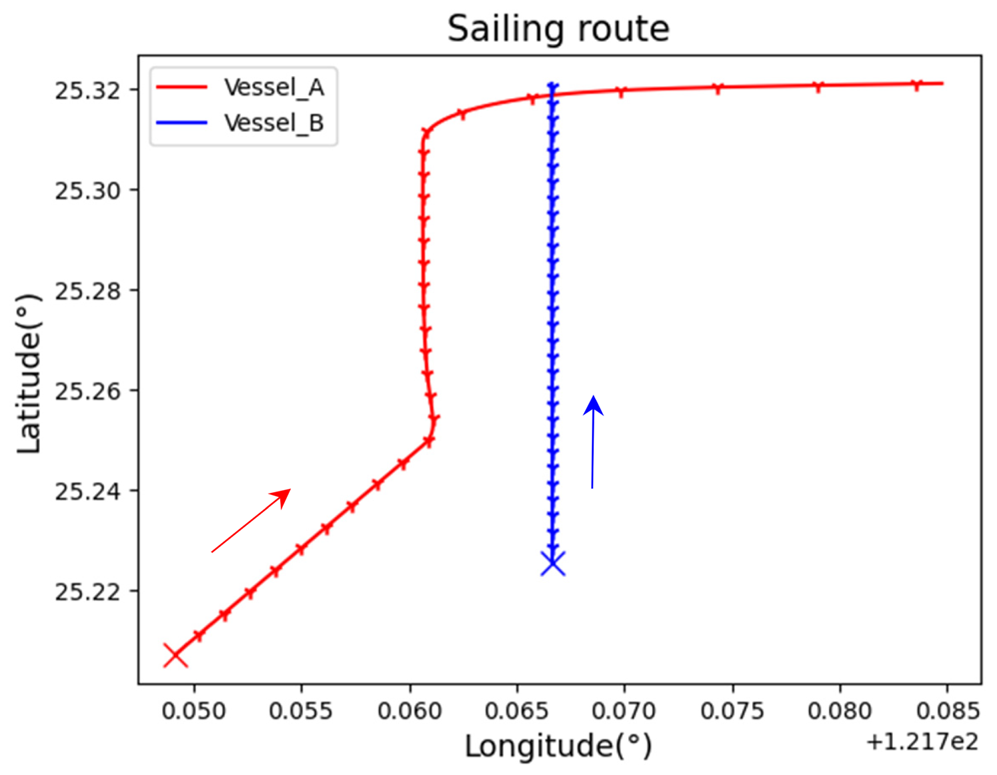
In this section, we introduce the nomenclature for the two vessels used in our study. We refer to the vessel that is being monitored and seeking avoidance as ‘Vessel_B’, and the other vessel as ‘Vessel_A’. To better illustrate the movement and positioning of the two vessels, we use navigation charts to visually represent their positions. The departure points of both ships are marked with an ‘x’ on the navigation chart, with nodes plotted at one-minute intervals. The navigational dynamics diagram and the VCRO diagram provide complementary information about the encounter between the two vessels. The navigational dynamics diagram helps to visualise the movement and position of the vessels, while the VCRO diagram provides a quantitative assessment of the collision risk. We will use simulated data to test the validity of our hypothesis, as the scenario configuration we use in this study is different from that of other studies. The simulation setup will include various encounter scenarios between two vessels, such as crossing, head-on and overtaking. To create more realistic maritime encounter scenarios, different avoidance routes will be simulated for various encounter scenarios. The format of our simulation data will be similar to real AIS data and define a caution zone when the distance between two vessels is less than 1 NM, including parameters such as longitude and latitude of two vessels, respective speed and heading of each vessel. The calculation results will be presented in a continuous chart showing the course of the two vessels at a given time, the change of distance between the two vessels, the change of relative speed of the two vessels and the moment when the two vessels reach the DCPA.
4.1 Data simulation
The figures that follow show collisions between two ships in head-on, overtaking and crossing circumstances as well as the various avoidance techniques used.
In Figure 8, if Vessel_A and Vessel_B continue to follow their original routes, they will end up colliding with each other in the original collision hot zone area (the red-dash circle area). To prevent this from happening, Vessel_A, which is the target ship being monitored and avoided, takes a left turn to deviate from its original route and avoid the collision with Vessel_B. In this scenario, it was assumed that the give-way vessel, Vessel_B, did not adhere to the International Regulations for Preventing Collisions at Sea (COLREGS). Consequently, the stand-on vessel, Vessel_A, invoked COLREG Rule 17 (1-2) to make a left turn. This assumption implies that Vessel_B was operating under the conditions outlined in COLREG Rule 10(12). This action of Vessel_A demonstrates the importance of effective communication and decision-making in maritime safety, as the ship's crew must be able to quickly identify and react to potential collision situations to prevent accidents. Figure 9 represent the Navigational dynamic relationship chart (crossing scenario 1).
Crossing scenario 1

Navigational dynamic relationship chart (crossing scenario 1)

In Figure 10, the heading difference between the two vessels is plotted against time. After the DCPA, the phase begins to turn negative, indicating that the two vessels are moving away from each other. This suggests that if both vessels maintain their course, they will not collide.
Crossing scenario 2

However, the VCRO diagram also provides important information about the safety of the encounter. The VCRO plots the risk of collision between the two vessels against time. After the DCPA, the collision risk decreases rapidly. This is because, at this point, the vessels are moving away from each other and the risk of collision is reduced.
In Figure 10, in this encounter scenario, Vessel_A is approaching while turning to the right, which means it is changing its course. However, if Vessel_A does not take proper measures to avoid collision, it may collide with Vessel_B. This highlights the importance of proper navigation techniques and communication between vessels to prevent such accidents.
In Figure 11, the above response can be verified on the way to the relative velocity. Since the course and speed of Vessel_B remain constant, the response of the two vessels to the relative velocity is entirely determined by Vessel_A. However, the plots of closest approach point and phase show the distance passed by the two ships at the closest approach point.
Navigational dynamic relationship chart (crossing scenario 2)

In a head-on encounter (Figure 12), two vessels are approaching each other on a mutual course. In such a situation, the two vessels must take appropriate action to avoid collision. Since Vessel_B still maintains its original course, it vectors Vessel_ A to make a turn to avoid a collision.
Head-on scenario

This action is a standard manoeuvre in such situations, as it allows both vessels to avoid collision by passing each other on their port sides. This is in accordance with COLREGS, which outlines specific rules to prevent collisions at sea. By following these rules and taking appropriate action, vessels can safely navigate and avoid collisions.
In Figure 13, we can gain a clearer understanding of the navigational dynamics of the two vessels during this event. Vessel_A initiates the avoidance behaviour of slowing down and turning at the 300th second, and this response can be verified in the phase diagram and the relative velocity diagram. However, in terms of vessel collision risk, since the initial phase of the two vessels is close to 180 degrees and the phase parameter is calculated by sin function according to Equation (11), the VCRO increases until the distance between the two vessels is less than 0⋅5 NM. Because the initial phase of the two vessels is nearly 180 degrees, when the calculation at the 300th second yields a sine value of 0, the VCRO value instantly drops to zero (the blue-dash circle area).
Navigational dynamic relationship chart (head-on scenario)

In this navigational scenario (Figure 14), Vessel_A overtakes Vessel_B from the right rear; in this case, Vessel_B should make a turn to avoid, but Vessel_B still maintains the original course, so Vessel_A will accelerate to overtake.
Overtaking scenario 1

Figure 15 shows the navigational dynamic relationship chart (overtaking scenario 1). In the navigational dynamics chart, it can be seen there is a significant increase in the VCRO value as the trailing vessel approaches, and the peak of the VCRO occurs when the two vessels are closest together.
Navigational dynamic relationship chart (overtaking scenario 1)

In Figure 16, Vessel_A passes Vessel_B from the rear and accelerates from the left side to complete this manoeuvre. Vessel_A then follows the left side of Vessel_B and makes a pursuit pass to avoid it.
Overtaking scenario 2

The dynamics of this encounter scenario are shown in Figure 17. The highest risk of collision between two vessels occurs when Vessel_A is turning to avoid, not when they are at the closest distance. The distances between the two vessels as they pass the closest point can be represented by distance and phase diagrams. The distance between the two ships reaches a minimum at the 985th second and their phases become negative accordingly, which indicates that the two ships are in the distance phase after passing the DCPA.
Navigational dynamic relationship chart (overtaking scenario 2)

The following are the angle ranges and quantities for the three scenarios in this simulation data. Table 1 shows the simulation data and the number of segments in each scene.
Simulation data and the number of segments in each scene

The number of segments is caused by the number of simulations. The aspect interval is every 10 degrees.
4.2 Automatic ships control mechanism
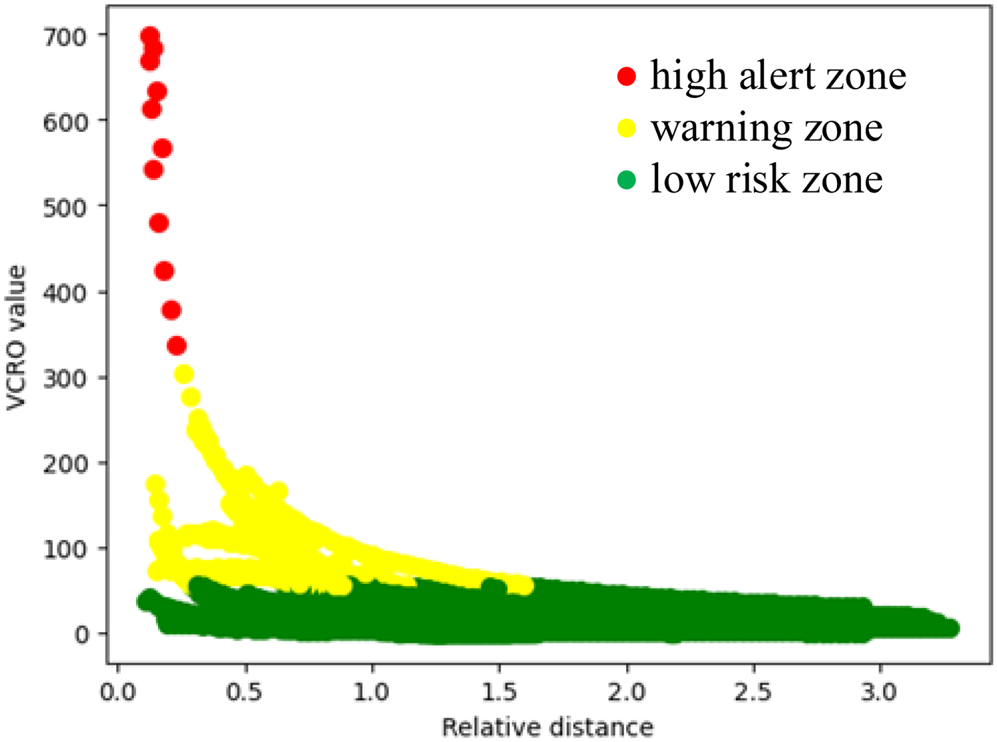
Figure 18 shows the results obtained in this simulation environment, which have been analysed using the k-means cluster method. In the k-means method, a group can be partitioned into multiple clusters, allowing the risk value of a vessel collision to be represented by different clusters. This enables the use of distinct clusters to indicate varying levels of collision risk.
Signal alert diagram

The figure presents a colour-coded representation of the risk of collision between two vessels in these environments. The green area indicates a low risk of collision, suggesting a safe navigation condition. The yellow area represents a warning zone, indicating that the vessel operator should exercise increased caution and closely monitor the navigation status. Lastly, the red area corresponds to a high alert zone. If the signal enters this area, the vessel's control system will automatically intervene, initiating avoidance manoeuvres such as steering and deceleration. These actions continue until the signal returns to the yellow area, at which point the vessel's control is restored to the operator's command. This response mechanism enhances the safety of vessel operations and ensures effective collision avoidance measures are implemented.
Visual classification facilitates easier identification for mariners compared with using VCRO values. It operates more akin to a traffic light with immediate reaction. In certain applications, the k-means clustering method can be adjusted by user-defined parameters. This customisation has demonstrated increased feasibility and effectiveness in practical usage scenarios.
5. Conclusion
The original VCRO calculation method is mainly to analyse the collision risk area of the ship based on the historical data of the ship's navigation. However, by enlarging the angular separation in the model, VCRO can be used as a real-time tool for ship collision risk assessment. Because the relationship between the angle intervals is too large, the response to the head-on encounter and overtaking situations can be more obvious, and the collision risk of the ship can be measured in real time. Using the k-means cluster method can assist to better understand the severity of the risk of a ship colliding with other ships during navigation, and remind the crew of the ship's control mode according to the severity. Visual classification allows for easier identification compared with relying solely on VCRO values.
5.1 The future directions of the research and the suggestions
In this study, the consideration of marine meteorological factors and vessel size was not included. However, incorporating these factors into the calculation in future research would enhance the model's applicability to real marine conditions and improve the accuracy of risk assessment. This model can be constructed under the condition that all vessels in the area are equipped with AIS signal devices and can consistently provide stable and effective data. This enables more accurate real-time analysis of collision risks. Since this model currently focuses on one-to-one vessel collision risk assessment, the collision risks between multiple vessels (one-to-many and many-to-many scenarios) are not considered. In the future, including these scenarios in the model calculation would significantly reduce the computational time and enable real-time and accurate risk assessment.