


Would local public meetings incite more civic engagement if they were structured in ways that are simply more engaging? When political scientists identify and measure political participation, they regularly list public meeting attendance alongside activities like voting, volunteering with a campaign, and donating to a campaign as indicators of a vibrant democracy (Putnam Reference Putnam2000; Skocpol and Fiorina Reference Skocpol and Fiorina1999; Verba and Nie Reference Verba and Nie1972). Public meeting attendance, however, is noticeably distinct from these other major forms of participation; while it arguably influences election outcomes the least, it provides the greatest opportunity for an individual to directly observe, or even affect, policy decisions. This opportunity for efficacy is particularly available at the local level, where school boards and city councils govern within reach of the citizenry.
Despite its promise, very few studies in political science focus on public meeting attendance at the local level. The few recent studies that do focus on this topic highlight the characteristics of Americans who are more likely to attend these events (Einstein, Glick, and Palmer Reference Einstein, Glick and Palmer2019; Oliver Reference Oliver2000; Schaffner, Rhodes, and La Raja Reference Schaffner, Rhodes and La Raja2020), but they rarely focus on the role of institutions when attempting to understand patterns of public meeting participation. As a result, questions remain as to what techniques and strategies local officials can employ in order to increase public participation, especially among marginalized groups whose policy needs often go unrepresented.
To help fill this gap, I examine the extent to which randomly exposing individuals to a public meeting that is more engaging—versus a typical administrative meeting with few opportunities for participation—influences their trust in local officials and their stated propensity to attend a school board meeting in the future. I draw from the literatures on participatory and deliberative democracy to add nuance to conceptions of participation and engagement. I look at the effect of attending a participatory meeting that features other citizens participating directly without a response from a public official (Pateman Reference Pateman1970). I also measure the effect of a meeting that features public deliberation—that is, citizen participation with a reasoned response (Cohen Reference Cohen, Hamlin and Petit1989)—which in this case comes directly from local officials. I was particularly interested in the influence of seeing these types of meetings on members of social groups toward which local governments tend to be unresponsive (Hajnal Reference Hajnal2010; Trounstine Reference Trounstine2018). More specifically, this study focuses on individuals from low socioeconomic backgrounds and members of historically marginalized racial and ethnic groups. Ultimately, by embedding clips of school board meetings into a survey experiment with an oversample of respondents who are low income and/or people of color, I found that exposure to more engaging public meetings leads to increased trust in local officials and led to a greater propensity for attending public meetings in the future.
The Role of Public Meetings within Local Democracy
In theory, local public meetings have the potential to be hubs for participatory democracy. School boards, city councils, and other municipal institutions routinely convene and decide policy-related matters. Sunshine laws, which have been in place since the mid-twentieth century, obligate these local institutions to make meetings accessible to the general public in most states (Pupillo Reference Pupillo1993). Concretely, these laws require advance access to meeting agendas, guarantee that individuals can be present during public hearings and public portions of regular business meetings, and allow the public opportunities to provide direct comment to decision makers. It is this type of opportunity for direct input at public meetings that moved Alexis de Tocqueville to long ago decree “local assemblies” as “the strength of free nations,” because of how they “bring liberty within people’s reach” (Reference de Tocqueville1840, 128).
In reality, local public meetings often operate far below the imagined ideal. Most observational studies of local politics reveal public meetings as sites for explosive disagreement and contention (Einstein, Glick, and Palmer, Reference Einstein, Glick and Palmer2019; Henig et al. Reference Henig, Hula, Orr and Pedescleaux1999; Hochschild and Skovronick Reference Hochschild and Scovronick2003; Mendelberg and Oleske Reference Mendelberg and Oleske2000; Morel Reference Morel2018; Nuamah Reference Nuamah2020). The most optimistic studies seem to describe them as spaces for technocratic business-as-usual exchanges between elected officials (Fung Reference Fung2006; Stone Reference Stone2001; Wirt and Kirst Reference Wirt and Kirst1997). Unsurprisingly, such meetings typically attract very low public attendance (Putnam Reference Putnam2000). Residents who do attend tend to be white, middle-income homeowners with a clear perceived stake in the decision outcomes (Einstein, Glick, and Palmer Reference Einstein, Glick and Palmer2019). Similarly, local governing board members who preside over the meetings tend to be racially and ethnically and/or socioeconomically unrepresentative of their constituents, particularly in large cities (Hajnal Reference Hajnal2010). Viewed through this lens, public meetings are simply events where a select few show up to fight for narrow specialized group interests, even at the expense of a greater good. Meanwhile, the majority sit at home, disinterested in the affairs of local government. From this outlook, one could very much argue that local public meetings are actually illusions of democracy.
While criticisms of public meetings mound, few have questioned whether the disinterested majority remain in their homes because of the actual structure of meetings. Indeed, discussions of this problem are much less prevalent within the voting literature. With voting behavior, we know that structural barriers, like election timing, help explain low participation rates (Anzia Reference Anzia2013; Collins, Lucero, and Trounstine Reference Collins, Lucero and Trounstine2020; Hajnal and Trounstine Reference Hajnal and Trounstine2005). However, we remain largely uncertain as to how structure influences public meeting attendance, particularly for individuals on the margins. We know that uneven meeting participation favors already dominant groups, and uneven participation in public meetings leads to unequal policy representation (Schaffner, Rhodes, and La Raja Reference Schaffner, Rhodes and La Raja2020). However, we do not know how much of the uneven participation is a function of an overly technocratic and professionalized meeting structure.
This is a challenging issue to explore. After all, public meetings are extremely understudied in political science for a number of reasons. For instance, because of typically low attendance, it is difficult to accrue a large enough sample size for statistical comparisons (Mansbridge Reference Mansbridge1980). Moreover, to the extent that comparisons are possible, they largely focus on residents of a single city, which makes it difficult to establish external validity beyond the context of the specific community of interest. Lastly, public meeting attendance is difficult to study, particularly if one has interest in the effect of meeting participation on participants, because doing so would require surveying a sample of attendees pre- and postmeeting. Beyond sampling concerns, one of the largest circular problems that confronts researchers interested in the study of public meetings is that the overall structure of these meetings tends to feature limited opportunities for citizen participation, and it is the limited opportunity for engagement that deters members of the public from participating (Adams Reference Adams2004). Without meeting attendees, studies do not have the participants whose behavior we need to observe.
This study attempted to overcome these obstacles through a test of the effects of manipulating public meeting structure. The ideal research design would involve coordinating with a large number of local boards and councils and randomly assigning some to incorporate aspects of public deliberation, while motivating representative samples of local populations to attend the meetings. Before going through the lengths required to round up public boards and ask them to systematically change their meeting structures, however, we should know whether there is some promise in this idea. By employing the use of video clips, I was able to more efficiently expose a national sample of Americans to public meetings that feature the standard format, participatory behavior, or public deliberation. The success of this virtual manipulation, then, establishes precedent to encourage actual local boards to alter their structures.
Participatory Democracy, Deliberation, and Public Meeting Participation
The question operating in this study is whether observing a school board meeting with a more participatory or deliberative style actually factors into how individuals view and respond to local institutions. This question intersects with three areas of inquiry: local politics, deliberative democracy, and the politics of education. From the standpoint of US local politics and local public administration, studies of town hall meetings in Vermont suggest that opportunities to be a part of environments where there is direct communication between citizens and public officials strengthens the ties of representation (Bryan Reference Bryan2004; Zimmerman Reference Zimmerman1999). Beyond the New England town hall, studies of aggregate trends in local meeting participation (Fung Reference Fung2004), of specific cities (Mansbridge Reference Mansbridge1980; Mendelberg and Oleske Reference Mendelberg and Oleske2000), and of meeting minutes (Einstein, Glick, and Palmer Reference Einstein, Glick and Palmer2019; Frasure-Yokley Reference Frasure-Yokley2015; Karpowitz, and Mendelberg Reference Karpowitz and Mendelberg2014) all reveal similar trends: public meetings help deepen democracy. While much of this work does highlight the notion that opportunities for voicing concerns encourage meeting attendance, scholars also make it clear that without some sort of structural intervention, participation in these meetings tends to be very unequal. This leaves open the possibility that presenting meetings to people in ways that seem like public engagement is a priority will not only help increase meeting attendance but also create better balance in who attends. Citizen participation and public deliberation are concepts that show that commitment.
The idea that attending meetings featuring citizen participation and public deliberation could matter comes from a debate that has been happening in the literatures on participatory democracy and deliberative democracy, respectively. For participatory democrats, public meetings are critical sites for facilitating direct citizen participation. For instance, participatory budgeting, a widely used design that started in Brazil, largely relies on public meetings at the community level to scavenge public preferences (Baiocchi, Heller, and Silva Reference Baiocchi, Patrick and Silva2020; Wampler Reference Wampler2007). Similarly, studies focused on participatory initiatives in the United States rely on accessible and transparent public meetings, whether held by decentralized councils at the community level (Fung Reference Fung2004) or bureaucratic commissions at the federal level (Moffitt Reference Moffitt2014). Participatory arrangements, though, do not de facto guarantee that the public will be able to directly contribute to—or even observe—the decision-making process. While participatory initiatives demonstrate interdependence between citizen involvement and public meetings, they tend to be agnostic to the decision-making mechanisms used to turn public preferences into policy. However, in order to enhance the democratic nature of the process, most participatory models rely on public deliberation to some degree.
The deliberation literature speaks to the utility of public meetings as well, albeit in a different way. The larger disagreement among deliberation scholars is whether deliberation is best served as a tool for minipublics to formulate policy preferences through information-based reasoning or a means through which to generate the transparent monitoring of public officials (Chambers Reference Chambers2009; Gutmann and Thompson Reference Gutmann and Thompson2004; Parkinson and Mansbridge Reference Parkinson and Mansbridge2012). Much of the empirical research on deliberation focuses on the effect of direct citizen participation in the context of specific types of meetings, like citizen juries (Smith and Wales Reference Smith and Wales2000), face-to-face, small-group discussions (Gastil and Dillard Reference Gastil and Dillard1999; Luskin, Fishkin, and Jowell Reference Luskin, Fishkin and Jowell2002; Warren and Gastil Reference Warren and Gastil2015), and forums, both in person (Esterling, Fung, and Lee Reference Esterling, Fung and Lee2015; Karpowitz and Raphael Reference Karpowitz and Raphael2014) and online (Wright and Street Reference Wright and Street2007). These special deliberative meetings tend to either involve small minipublics or be large-scale, one-off initiatives, where deliberation results in policy recommendations that may eventually land on the desks of public officials for their consideration (Fung Reference Fung and Rosenberg2007).
A criticism of these studies, however, is that deliberation in the context of a representative democracy should involve (if not exclusively entail) the voices of public officials (Parkinson Reference Parkinson2006). After all, what is a democratic process without the voices of those with the decision-making power? To this critique, studies of legislative discourse have provided evidence that more deliberative bodies produce more responsive policy agendas (Parthasarathy, Rao, and Palaniswamy Reference Parthasarathy, Rao and Palaniswamy2019; Steiner et al. Reference Steiner, Bächtiger, Spörndli and Steenbergen2004). Bridging the gap between direct citizen participation and representative democracy, recent research has provided evidence that opportunities for citizens to have deliberative conversations with elected officials carry many of the same benefits as small-group, citizen-only discussions (Neblo, Esterling, and Lazer Reference Neblo, Esterling and David2018). Still, as a whole, the deliberation literature is unclear on what the nature of lay-citizen participation should be. What it does tell us, however, is that, like participatory democracy, public meeting spaces are where the magic happens. The remaining challenge, from the democratic theory perspective, is to more clearly illustrate how we bring democratic innovations to the typical public meeting space.
School board meetings provide the ideal environment for applying democratic innovations. Public education is routinely cited as one of the primary policy issues about which Americans care deeply (Pew Research Center 2019), and it offers a unique advantage in that it is the only policy area with its own governing institutions—school boards—that focus solely on making policy. Much of the recent work on local political participation examines its influence on housing policy (Enos Reference Enos2016; Hankinson Reference Hankinson2018; Trounstine Reference Trounstine2018), which is a highly salient issue with direct implications for the local tax revenue used to fund schools as well as the demographic composition of student enrollment. Meanwhile, more specific to education, there has been a steady stream of research looking at participation in school board elections (Henig, Jacobsen, and Reckhow Reference Henig, Jacobsen and Reckhow2019; Kogan, Lavertu, and Peskowitz Reference Kogan, Lavertu and Peskowitz2016; Payson Reference Payson2017) and the larger capacity for school boards to be spaces for democratic governance (Berry and Howell Reference Berry and Howell2007; Flavin and Harney Reference Flavin and Hartney2017; Hochschild Reference Hochschild and Howell2005). Yet, few studies focus specifically on school board meetings.
The work that does examine school board meetings uses deliberative politics as the lens through which to evaluate participation and decision making (Asen Reference Asen2015; Collins Reference Collins2019; Karpowitz and Mendelberg Reference Karpowitz and Mendelberg2014; Tracy Reference Tracy2011). While these studies provide clear insight into the utility of deliberative strategies in school board meetings, the majority rely on case studies and correlational analyses, which leave lingering questions of causality. The current study, while focusing less on the nature of discourse and speech in meetings, establishes the potential causal effect that deliberative and participatory elements have on the legitimacy of the local institutions and their ability to attract public participation.
The Effect of Participation and Deliberation on Public Meeting Attendance
A prevailing claim from the empirical literature in democratic theory is that when ordinary citizens are granted opportunities for direct participation or for deliberation with fellow citizens, we see outcomes indicative of a deepened and strengthened democracy (Fishkin Reference Fishkin2011; Fung and Wright Reference Fung and Wright2003). When individuals get the opportunity to actively engage in deliberation with peers, they become more knowledgeable about specific policy issues and their preferences become more aligned with their fellow participants. They develop deeper levels of trust, either in fellow citizens or in government, and they become more likely to engage in more civic behaviors in the future (Carpini, Cook, and Jacobs Reference Carpini, Cook and Jacobs2004).
The effects of deliberation are largely estimated based on designs where subjects are recruited to participate in structured discussions (Gastil Reference Gastil2018). These individuals are typically given information to review beforehand. At the actual deliberation events, respondents are divided into small groups with fellow citizens, usually through random assignment. The tight control over the design enables researchers to assess the true effects of direct participation. Whether they be minipublics, deliberative forums, or deliberative polls, these events largely lead to positive outcomes. However, one question lingers: What about the people who do not get an opportunity to participate in meetings that involve stakeholder participation and public deliberation? In other words, what about the people whose primary option for participating is a traditional local public meeting that does not include these elements?
The structure of the typical deliberation design does not provide us with an understanding of the behavior of individuals who do not get opportunities to engage in structured deliberations. Further complicating this gap, especially when thinking about local government and public meetings, is that the modal person does not have the opportunity to participate in any kind of forum or meeting, whether it features citizen deliberation or not. Taking the problem a step further, when we think about residents of urban cities, a significant number of individuals are less likely to physically attend public meetings and forums because they lack the additional time, resources, or social capital. They either cannot physically make their way to a meeting, or they simply do not believe that they belong at one.
Instead, the typical public meeting features active participants. These are individuals who are a part of more privileged racial, ethnic, and/or socioeconomic groups. They also tend to be connected to civic organizations or specialized interest groups. The urban and local politics literature consistently tells us that local officials are overly responsive to the preferences of these active and privileged participants (Moe Reference Moe2011; Warshaw Reference Warshaw2019). However, local democracy at its best should be equally responsive across racial/ethnic and socioeconomic cleavages. A key to balancing responsiveness is to generate a more equitable distribution of active participants. I argue that this process can begin by transforming nonparticipants into what I call “passive” meeting attendees; these individuals do not actively participate by voicing concerns—they merely observe. Archon Fung (Reference Fung2006, 68) already speculates that the vast majority of people who appear at public meetings are passive attendees, or people who “participate as spectators.” Can the behavior of this literal silent majority be changed?
I argue that institutions can convert nonparticipants to passive attendees by restructuring public meetings to be more engaging. Again, in this study I distinguish between two different meeting styles: one purely participatory and another that features citizen participation and public deliberation. Carole Pateman (Reference Pateman2012, 8) draws this distinction, saying, “deliberation, discussion, and debate are central to any form of democracy, including participatory democracy, but if deliberation is necessary for democracy it is not sufficient.” Pateman (Reference Pateman2012, 10) goes on to underscore the educative nature of direct participation—how individuals “learn to participate through participating.” This idea that some individuals attend meetings as passive observers of their fellow citizens’ participation takes Pateman’s claim a step further. This type of passive participation should “educate” those who are observing participation on the benefits of engaging with local institutions. Borrowing from Pateman’s logic once more: passively attending a more participatory meeting should signal that the authority structure—in this instance, the school board—is indeed committed to behaving democratically.
Passive attendance at meetings featuring elements of deliberation should also help resolve this problem. Again, Pateman draws the distinction. Joshua Cohen (Reference Cohen, Hamlin and Petit1989, 345) adds further clarity in defining deliberation as a process through which decisions affecting the public proceed through “public argument and reasoning among citizens.” Through reason-based public dialogue, the institutions should be seen as more legitimate in the eyes of the citizenry. Furthermore, the ability to participate in the dialogue reinforces their positioning as free and equal. Observing this dynamic of public deliberation should, therefore, lead to higher levels of trust in local institutions due to the reasoned argumentation aspect. Moreover, through passive attendance, observers should receive a signal that the meeting space is a site for stakeholders to exchange reasons freely. This signal should motivate interest in future participation. Therefore, passive attendance at public meetings featuring public deliberation should help address the illusionary aspects of local public meetings. Meetings incorporating public dialogue become more inclusionary, which should strengthen trust and invite future participation. In other words, meetings with elements of participatory democracy and public deliberation should have similar effects on both active and passive attendees, respectively.
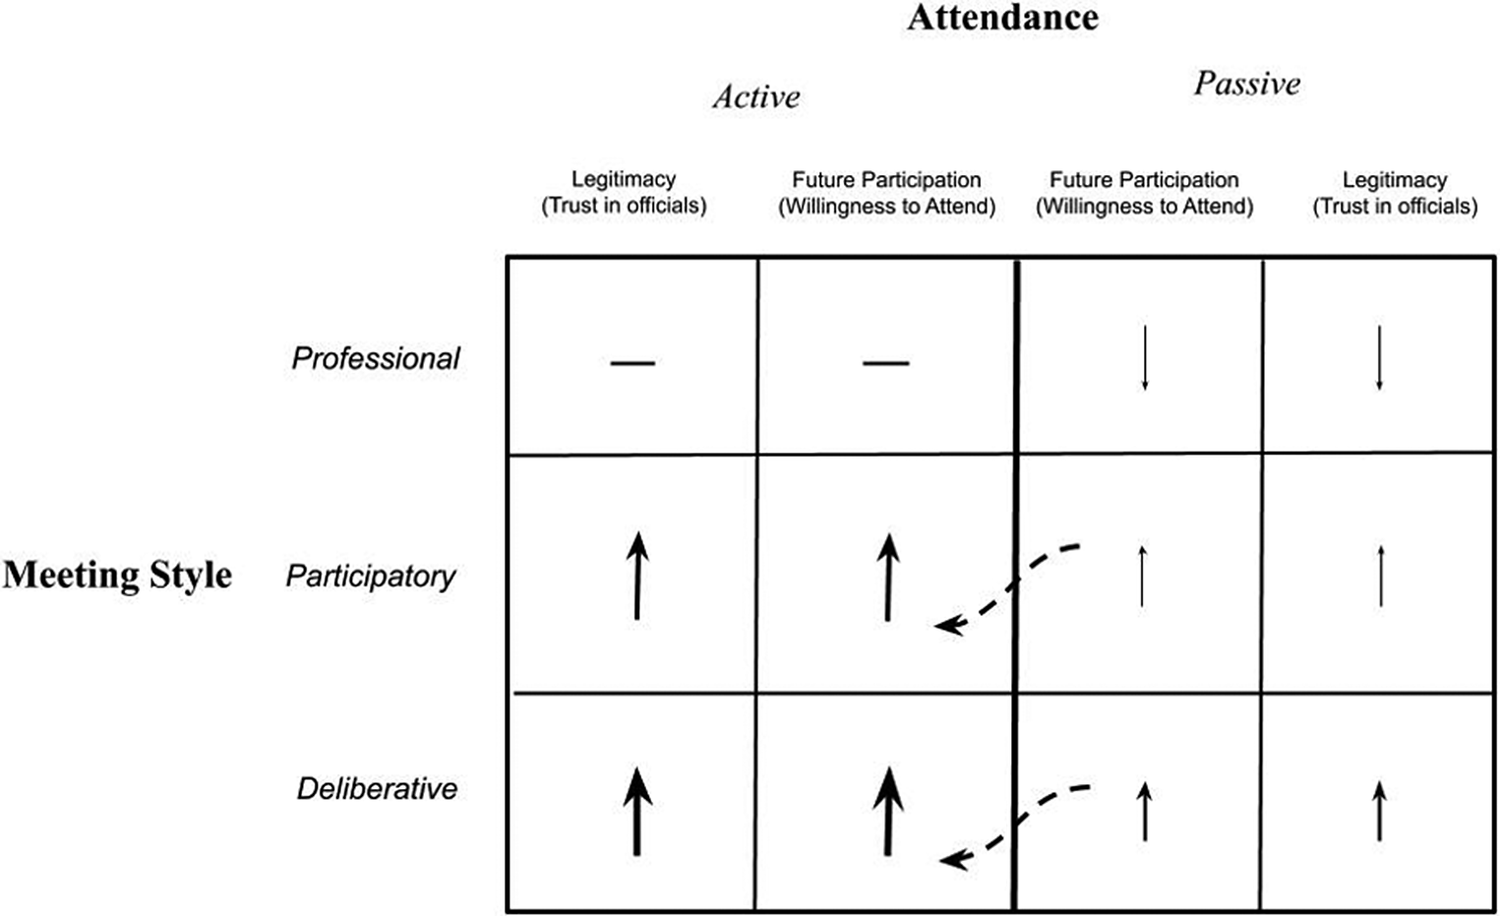
The two central theoretical expectations in this study are that attending a school board meeting in which there is either direct stakeholder participation or public deliberation between stakeholders and local officials should lead to (1) increased trust in local officials and (2) a stronger motivation for attending school board meetings. As illustrated in Figure 1, the participatory democracy and deliberation literatures provide evidence that active meeting attendance has these effects (see Columns 1 and 2). This study makes the case that passive attendance at a school board meeting that features direct active participation and deliberation should increase legitimacy and future participation (see Columns 3 and 4). As the size of the arrows in Figure 1 illustrates, the “spectator effect” from passive attendance cannot be expected to generate effects with the same intensity as in-person involvement, but more engaging institutions are still appealing regardless of the degree to which one can directly interact. Moreover, as illustrated by the dotted arrows in Figure 1, by exposing nonparticipants-turned-passive-attendees to more engaging meetings, we should increase their likelihood of becoming active participants in the future.
Conceptual Model of Effects of Different Meeting Styles on Legitimacy (Trust) and Future Participation (Willingness to Attend a Meeting)

I expect passive attendance at meetings featuring public deliberation to have a more pronounced effect than that of meetings with citizen voice but no response from officials. (This conceptual distinction is illustrated in Figure 1 by the larger arrow sizes in Row 3 compared with Row 2.) However, there is reason to suspect that just passively observing participation will have smaller yet comparable effects. Even in the absence of a full back-and-forth deliberation, observing an environment where there is more active public participation should generate some of the same positive effects, just lower in magnitude. The aforementioned studies of participatory budgeting have illustrated that opportunities for direct citizen participation can strengthen trust in institutions through transparency and actual citizen participation through empowerment (Baiocchi Reference Baiocchi2005; Baiochhi and Ganuza Reference Baiocchi and Ganuza2014). Therefore, passively observing a participatory environment should still strengthen trust in local institutions because, even without a spoken response from officials, individuals will see government leaders allow the public to actively hold them to account, which generates similar notions of transparency. Furthermore, seeing others actively participating in school board meetings should motivate observers to want to participate in the future—it should be “educative” and empowering. However, seeing participation should not have as strong of an effect as exposure to deliberation because, without the direct response, the local officials are not acknowledging the agency of the participants. Thus, as I expose individuals to meetings with citizen participation—but without any kind of deliberation—it should not have quite the same effect as seeing citizen participation that occurs within a public deliberation. This is because, in the latter, government officials acknowledge members of the public as equal peers.
Effect of Attendance for the Most Marginalized
Arguably the most important assertion of this study is that meeting attendance—featuring either stakeholder participation or public deliberation—should be particularly influential for members of marginalized subgroups. The technocratic and hyperprofessional environment of the standard meeting is alienating to those who are not accustomed to the norms of such environments (Hess Reference Hess2011). Events like school board meetings tend to be littered in jargon, acronyms, and parliamentary language. Individuals from low-income backgrounds and/or from non-white households are likely to be less familiar with the meeting proceedings and less comfortable with the language used during the meetings themselves (Orr and Rogers Reference Orr and Rogers2011). Furthermore, there is a clear line of evidence highlighting the fact that governments frequently ignore their policy preferences (Lerman and Weaver Reference Lerman and Vesla M.2014; Michener Reference Michener2018; Schaffner, Rhodes, and La Raja Reference Schaffner, Rhodes and La Raja2020). As a result, attending more engaging meetings with participation and deliberation should be particularly empowering and instructive for individuals from lower-income households and people of color.
The notion that cultural difference across socioeconomic and racial/ethnic divides manifests into barriers to political engagement is far from new. There has been consistent evidence that socioeconomic differences as well as differences in psychological resources—like political efficacy and trust in government—explain why people of color participate in politics at lower rates (Barreto Reference Barreto2010; Bobo and Gilliam Reference Bobo and Gilliam1990; Frasure-Yokley Reference Frasure-Yokley2015; Leighley Reference Leighley2001; Tate Reference Tate1991; Verba et al. Reference Verba, Schlozman, Brady and Nie1993). Meanwhile, racial segregation and discrimination have reduced the proclivity of people of color to establish social and political connections with out-groups, which can leave them ostracized from the American political system (Hero Reference Hero2007; Orr Reference Orr1999). Furthermore, language operates as an additional barrier for American migrants. Resistance to the Spanish language, in particular, has been deployed as a tool to suppress Latinx political participation (Garcia-Bedolla Reference Garcia-Bedolla2005). Restructuring public meetings to center mass participation and public deliberation cannot be expected to remove the deep structural barriers to marginalized group participation. However, it should help reduce the effects of these obstacles, particularly the psychological barriers—namely, trust and the motivation to attend.
Differences in social and cultural background result in different levels of political participation and different orientations to the American political system. Conceptually, meeting attendance in environments with participatory and deliberative activity should be most influential among the individuals who are least predisposed to the outcomes of interest: trust in officials and future meeting attendance. In other words, individuals with low levels of trust in public officials should be the most positively influenced by attending more engaging meetings. Similarly, individuals who have never attended public meetings before should be the most likely to want to attend meetings in the future, after being thrust into attending a meeting with citizen participation or public deliberation. The reasons differ slightly. For a political attitude like trust, there is a ceiling effect: individuals who have already formulated the positive attitude (trust) cannot express an even more positive attitude—that is, further increased trust (Shapiro and Page Reference Page and Shapiro1983). However, for the propensity toward a political behavior like attending meetings, experience engaging in that behavior, especially within a conventional environment (traditional meetings), could prevent someone from accepting an unconventional environment (participatory or deliberative meetings) as a legitimate representation of the environment (public meetings) more broadly (see Figure 1, Row 1). Thus, predisposition should play an important mediating role in the overall effect of exposure, particularly for members of marginalized groups; again, those without prior experience attending meetings should be affected at higher rates.
Research Design
In this study, I tested whether exposure to a school board meeting that is more participatory or deliberative leads individuals to think differently about local officials—in particular, school boards. I performed this test by fielding an original survey that featured an embedded randomized experiment. My experiment followed most of the basic procedural principles outlined by Gaines, Kuklinski, and Quirk (Reference Gaines, Kuklinski and Quirk2007).Footnote 1 To provide deliberative content for the experiment, I leveraged recorded meetings from the Burbank Unified School District (BUSD) in Southern California. Unlike the vast majority of school districts, BUSD embeds school board responses to public comment into their meeting agendas, which increases the frequency of meeting behavior that resembles public deliberation. To generate examples of participatory and nonparticipatory exchanges, I used recorded meetings from the South Pasadena Unified School District (SPUSD). SPUSD follows the standard meeting protocol outlined by California state law and represents the modal school board, which leaves room on agendas for public comment, without making additional effort to solicit public input. Furthermore, when there is public comment, the board members do not respond directly.
I watched all of the video recordings of meetings that took place in both districts during the 2015–16 academic year and identified those that focused on the same topic but differed in style. Through this process, I narrowed the pool to three meetings (two SPUSD meetings and one BUSD meeting) that all focused on the issue of teacher pay. I condensed the videos into short clips ranging between 1.5 and 3 minutes in length.
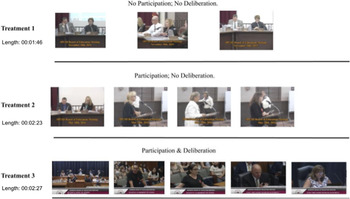
If assigned Treatment 1 (no participation; no deliberation), survey participants were shown a clip of SPUSD’s board reciting the agenda item for discussion—teacher salary negotiations—before the board asks if there is public comment; with no commenters present, they proceed to the next agenda item. If assigned Treatment 2 (participation; no deliberation), participants saw the SPUSD school board reciting the same agenda item at a different meeting, and they also saw snippets of teachers providing comments on the issue, followed by a nonresponse from the board. If assigned Treatment 3 (participation with deliberation), respondents saw BUSD’s school board open the floor for comments on the agenda item, snippets of teachers giving comments, and snippets of both the superintendent and a school board member responding to those comments. Figure 2 provides image frames from each video treatment.
School Board Meeting Video Treatments
Note: Images for Treatment 1 and Treatment 2 are stills from meetings held by SPUSD; Images for Treatment 3 are stills from a meeting held by BUSD.

These clips were embedded into the middle of an original online survey I titled “Assessing Opinions of Public Education and School Governance.” The survey was fielded to a total of 4,115 respondents in March 2020 through Amazon Turk. Within the sample, I embedded an oversample in the recruitment mechanism to target members of social groups who are statistically less likely to have their preferences represented in local government decisions. Again, recent studies of local politics show us that local governments are less likely to show responsiveness toward the preferences of people of color and low-income residents (Flavin and Hartney Reference Flavin and Hartney2017; Schaffner, Rhodes, and La Raja Reference Schaffner, Rhodes and La Raja2020; Trounstine Reference Trounstine2018).
In order to satisfy the oversample, survey respondents received a series of screener questions followed by preliminary questions about public education before they were informed that they would be shown a short video of an actual school board meeting. The language in the prompt read as follows:
You will now be shown a condensed clip of an actual school board meeting from a district in Southern California. In the clip, board members are holding a public hearing to work through salary negotiations with teachers. Please make sure that the sound on your device is turned on.
As respondents proceeded, the survey instrument randomly assigned them to view one of the three video clips. Posttreatment, respondents were given another round of questions assessing their trust in local officials and willingness to attend a future meeting. On average, respondents included in the final sample spent nine minutes and forty-seven seconds completing the full survey. See Appendix A for more detail on study procedures.
In order to help ensure that I estimated differences in effects based on respondents who actually received the treatments, I removed observations with missing data. More specifically, I purged all observations in which participants (1) completed the survey in less than one minute, (2) failed to answer a posttreatment open-ended question, or (3) typed an open-ended response that had no relevance to the topic. Respondents with missing data “completed” the survey in an average of only one minute and forty-six seconds. Eliminating these cases reduced the sample size to 2,244. Because of the oversampling described above, my final sample was 50% non-white and 48% low income (i.e., individuals with annual household incomes lower than $50,000). See Appendix B for more details on the final study sample.
It is important to consider whether the differences in the meeting environments of BUSD and SPUSD could bias the potential effect of exposure to deliberation. The two boards were similar in terms of board member and public commenter demographics, but there were differences. Both boards were 100% white, and the gender dynamics were similar: Sixty percent of SPUSD’s board members were women (three of five), as were 40% of BUSD board members (two of five). In terms of the demographics of the speakers, there was a similar pattern: all three SPUSD commenters were white and female; the two BUSD speakers were both white, and one was female.
The unrepresentativeness of the board members and the speakers relative to sample of study participants is also a concern; if anything, however, the lack of racial and ethnic diversity should suppress the effectiveness of the treatments, as opposed to providing any beneficial bias. Moreover, if the treatments are effective without representative boards, this likely suggests that coethnic board members facilitating more engaging school board meetings would generate even stronger positive effects among people of color (Barreto Reference Barreto2010; Bobo and Gilliam Reference Bobo and Gilliam1990).
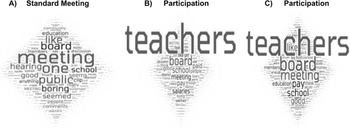
Still, I confronted the issue of the potential differences between the BUSD and SPUSD environments by collecting open-ended responses immediately posttreatment. Specifically, respondents were given the following prompt: “In no more than two sentences, provide your reaction to the clip.” I analyzed the frequency of words used in the open-ended responses as a robustness check on the treatments in search of evidence that study participants were focusing on the intended mechanism (the discourse) as opposed to unintended stimuli, like characteristics of the board members or the meeting environment. Figure 3 displays word clouds produced based on the frequency of words used to describe each meeting clip posttreatment.
Word Clouds Showing Frequency of Words Used to Describe the School Board Meetings in Posttreatment Open-Ended Question

The frequency analysis seems to provide strong evidence that participants were indeed focusing on the discourse. For the standard meeting, respondents used more general words in reaction to the clip, such as “meeting, “public,” and “board.” More related to the nature of the study, one of the primary words used to describe the standard meeting was “boring” (see Figure 3A). However, among both the participation (Figure 3B) and deliberation (Figure 3C) treatments, “teachers” was by far the most frequently used word for both, which indicates a focus on the issue at the center of the discourse as well as the positionality of the speakers. Moreover, the prevalence of words like “salaries” in the participation treatment, “money” in the deliberation treatment, and “pay” in both groups suggests that respondents’ attention was primarily on the issue. The frequency analysis, therefore, creates sufficient confidence that the differences between the SPUSD and BUSD school boards were largely not being detected by the participants.
I also included covariates in the survey that allowed me to test for factors that might bias potential effects. For instance, participants may have been responding to the issue of teacher pay itself—a concern that is amplified by the differences in the frequency of words used to describe the standard meeting compared with the participation and deliberation treatments. Therefore, at pretreatment I asked participants to indicate what they saw as the most important issue facing public schools. The list included: lack of school funding, lack of quality teachers, low teacher salaries, low test scores, lack of safety, lack of school choice, and segregated schools. Distinguishing between respondents who prioritized funding and teachers’ salaries over the other issues helped test for potential issue bias.
I also included covariates that assessed respondents’ orientation to their own schools and school districts, which they could have been projecting into their reactions to the treatments. This included measures of the following: (1) school satisfaction, (2) personal involvement with schools, (3) perceptions of how well their local school board facilitates community engagement, and (4) perceptions of how well their board facilitates dialogue with the public. I also assessed, pretreatment, whether participants had attended a school board meeting before as well as how much they trusted local officials to do what is right. The covariates allowed me to test for any pretreatment biases that may have influenced the potential effects of the treatment.
Exposure to Different School Board Meeting Styles and Trust in School Boards
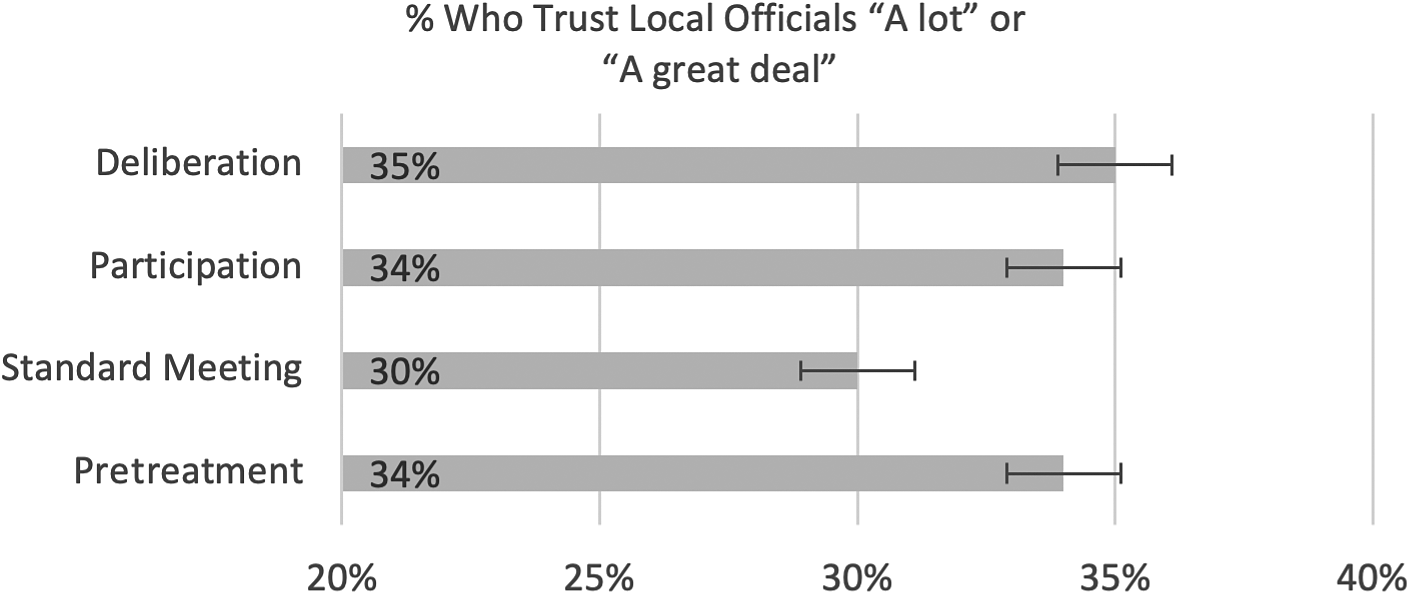
So, does the experience of observing more participatory and deliberative styles of public meetings affect how people view local institutions? I begin with an analysis of the effects of meeting style on trust in public officials.Footnote 2 Figure 4 shows the percentage of respondents who expressed high levels of posttreatment trust in local officials disaggregated by assignment group, with the level of trust at pretreatment included as a baseline. When compared with the full sample prior to treatment, individuals who received the standard meeting treatment (no participation; no deliberation) were slightly less likely to express trust posttreatment (34% versus 30%, respectively). Meanwhile, respondents who received the participation treatment (participation; no deliberation) on average expressed trust at the same level as the full sample at pretreatment; those who received the deliberation treatment (participation and deliberation) became slightly more likely to express trust (35%). At the surface, it appears that the treatments had little effect outside of exposure to the standard meeting leading to a slight decrease in trust.
Posttreatment Trust in Local Officials, by Group Assignment
Note: Overall pretreatment average is included for comparison. Total separation across standard error bars = p < 0.01 (99%).

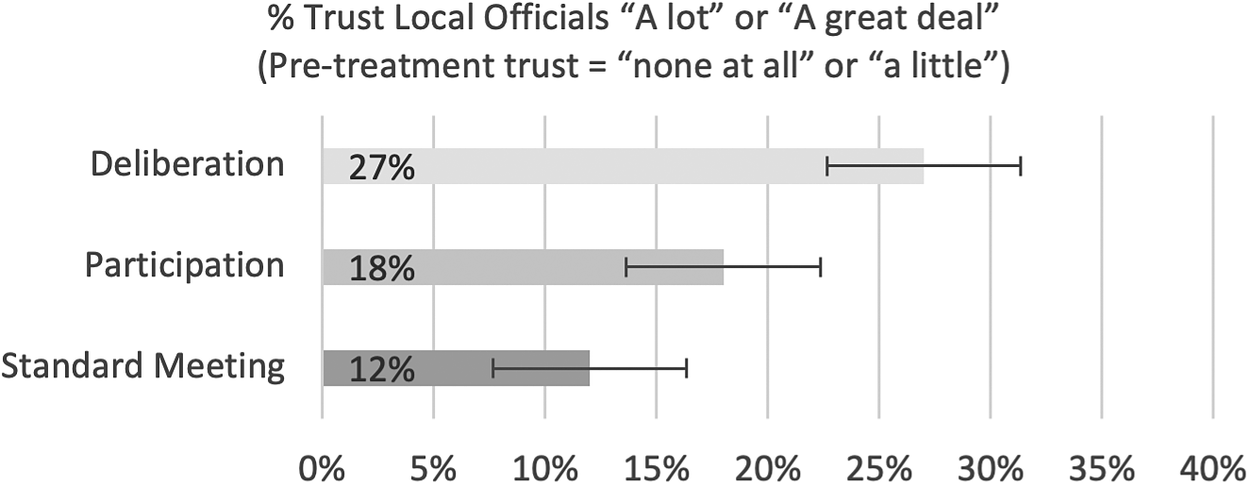
An important question emerges from these findings: How much of the posttreatment trust is merely a carryover from pretreatment attitudes? To answer this question, I disaggregated the data to examine differences in trust across treatment groups only for respondents who reported that their pretreatment level of trust in local officials was “none at all” or “a little” (n = 613; 27% of the full sample). As Figure 5 illustrates, significant differences emerged. While 12% of the low-trust subsample expressed high trust following the standard meeting treatment, that number climbed to 18% amongst low-trust respondents who were randomly assigned to the participation treatment and to 27% for low-trust respondents who were randomly assigned to the deliberation treatment.
Posttreatment Trust in Local Officials among Respondents with Low Levels of Pretreatment Trust, by Group Assignment
Note: Total separation across standard error bars = p < 0.01 (99%).

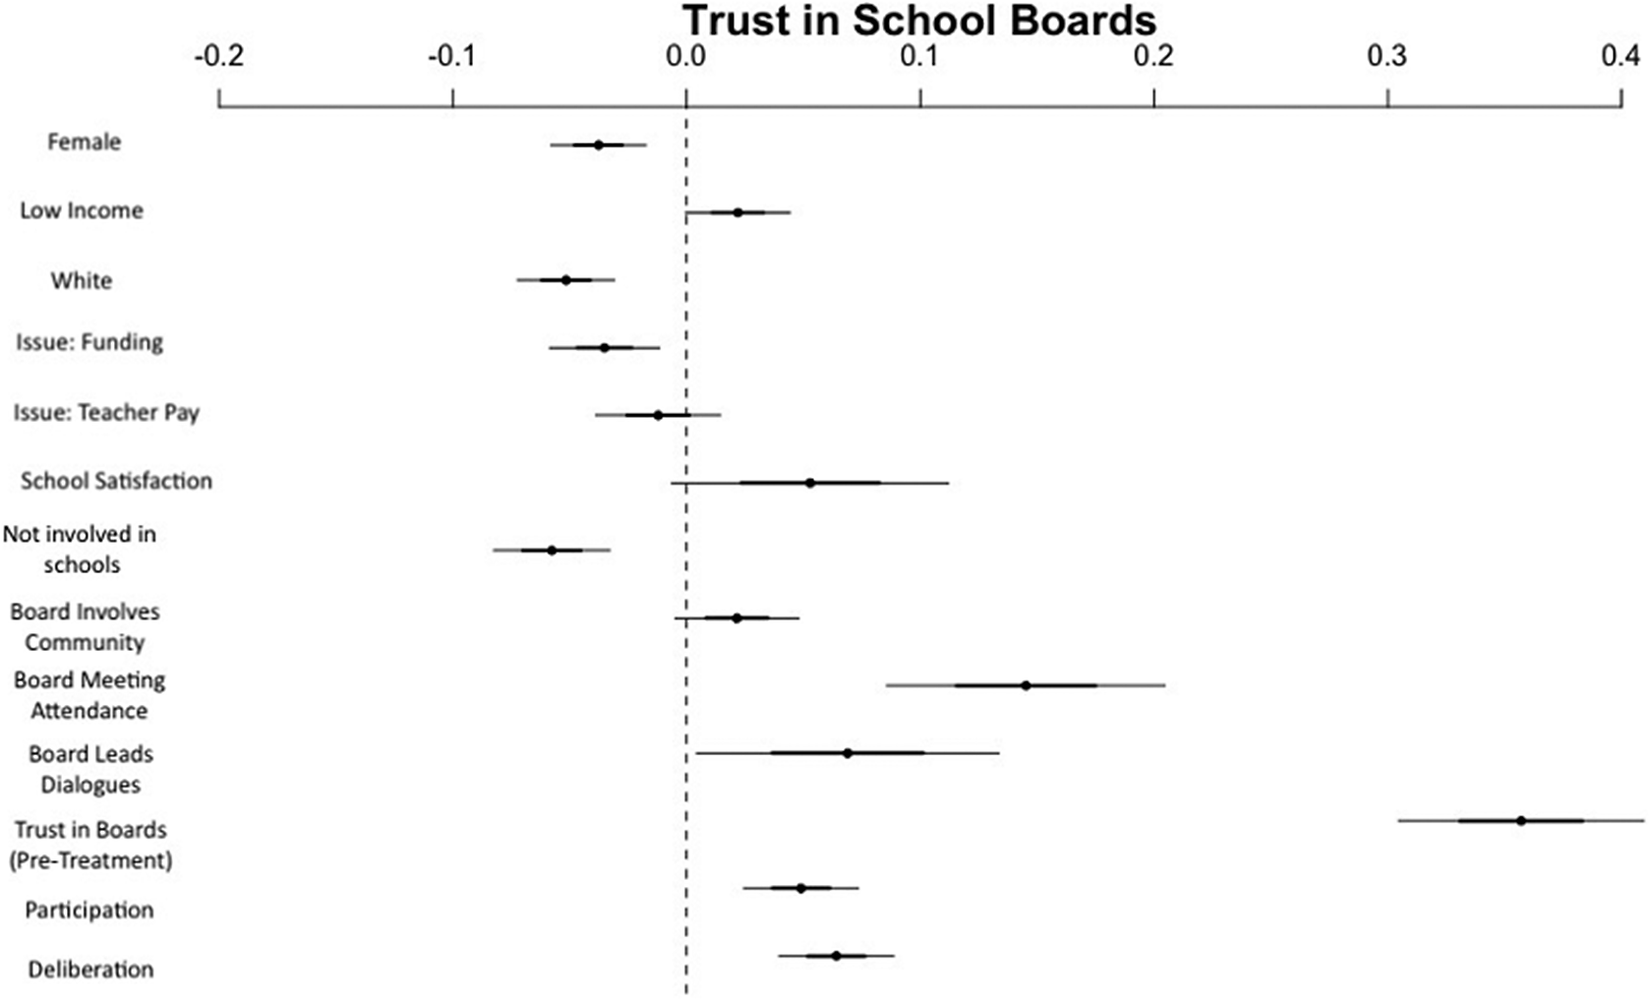
When I incorporated other relevant covariates and ran a multilinear regression model, the same trend emerged. As Figure 6 displays, respondents who were assigned the deliberation treatment were more likely to express trust in local officials posttreatment, an estimation that is statistically significant at the 99% confidence level. The same holds true for respondents who were assigned the participation treatment, although the effect size is lower in magnitude. Furthermore, the effects of exposure to the participation and deliberation treatments were sustained while controlling for the following pretreatment measures: trust in local officials, perceptions of how well their own board engages their community, school satisfaction, their own level of involvement in schools, whether they viewed either teacher pay or school funding as the most important issue facing schools, and differences in personal background.
Modeling Posttreatment Trust in Local Officials
Note: Box-and-whisker plots represent estimates from an ordinary least squares regression model. Trust in local officials operates as the dependent variable. Estimates in which the thickest bar crosses the dotted line = p < 0.10 (90%). Estimates in which the thinnest bar crosses the threshold = p < 0.05 (95%). Estimates in which both bars cross the threshold = p < 0.01 (99%).

Exposure to Different Types of School Board Meetings and Willingness to Attend
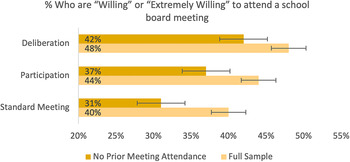
The effects of the treatments on respondents’ trust in local officials largely reappears when examining their willingness to attend public meetings posttreatment. Figure 7 shows overall posttreatment differences. While 40% of respondents who were assigned to the standard meeting treatment expressed willingness to attend a public meeting in the future, the rate climbs to 44% for those assigned to the participation treatment, and the number ascends to 48% if they received the deliberation treatment. Once again, though, the differences are more robust when focusing on individuals who were the least predisposed to the outcome of interest. In this case, I disaggregated to examine the posttreatment effects for respondents who had never attended a school board meeting (n = 861; 38% of the full sample); among this subgroup, only 31% of respondents expressed a willingness to attend meetings following the standard meeting treatment. Meanwhile, 37% of respondents assigned the participation treatment expressed willingness to attend a meeting in the future, and 42% of the respondents from the deliberation treatment group expressed that same willingness.
Posttreatment Willingness to Attend a Meeting in the Future, by Group Assignment and Prior Meeting Attendance
Note: Total separation across standard error bars = p < 0.01 (99%).

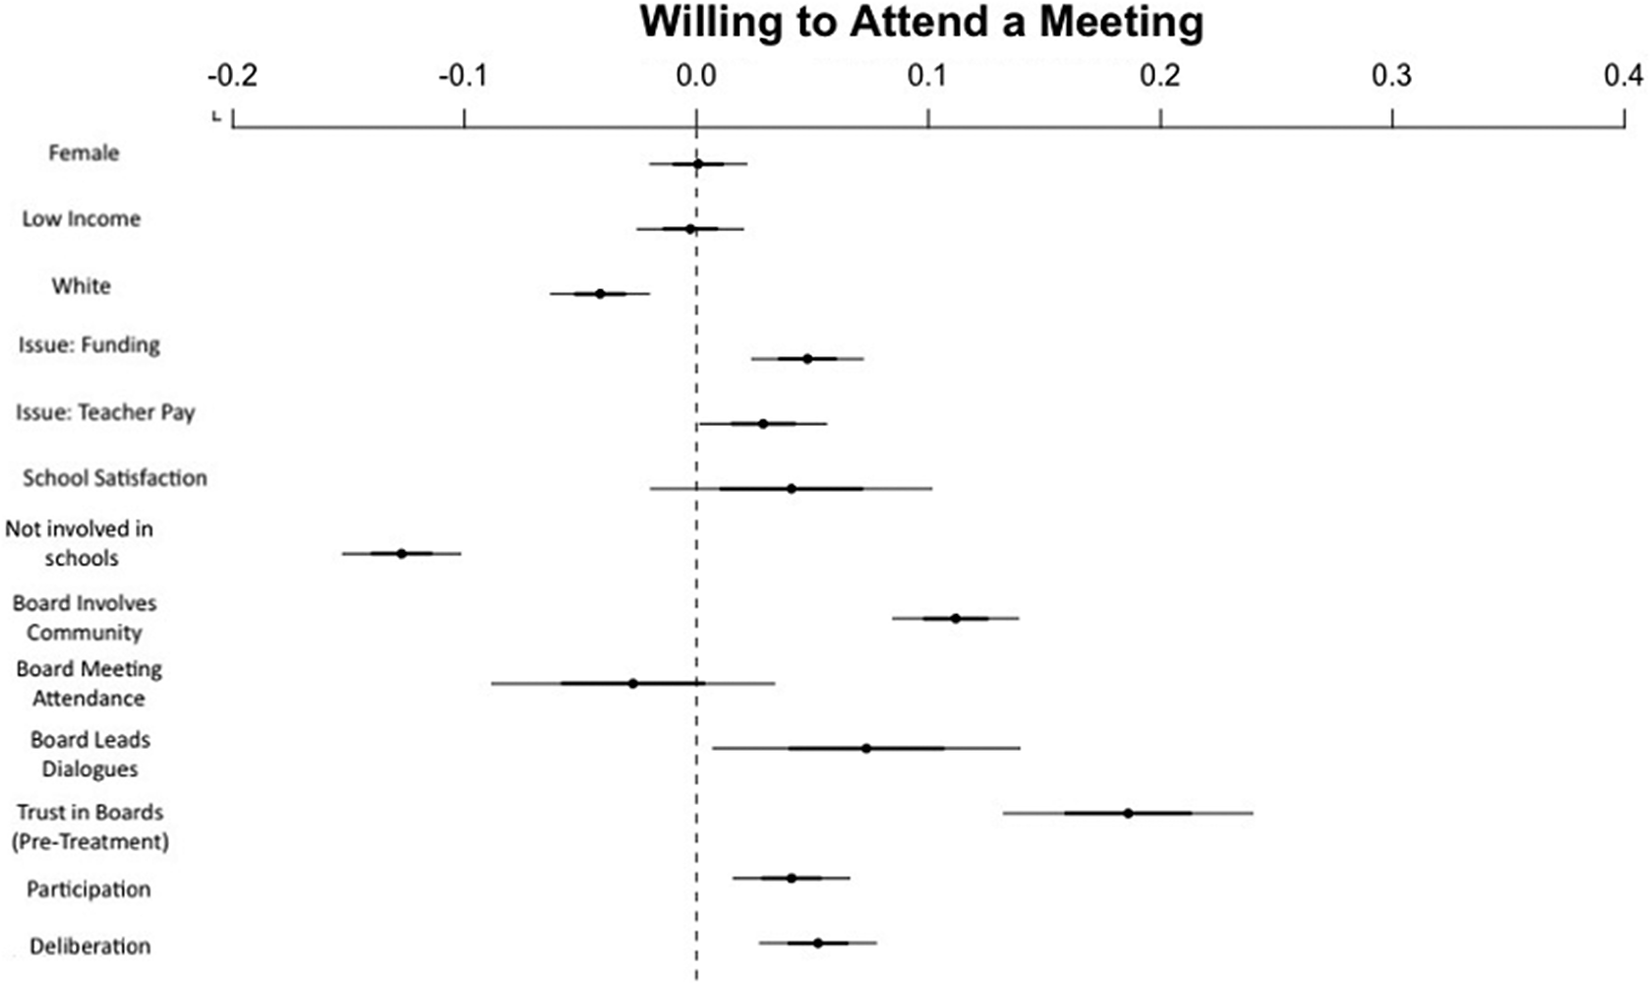
When covariates are incorporated into a regression model (see Figure 8), the effects of the participation and deliberation treatments are both positive and statistically significant at the 99% confidence level. So, respondents who received those treatments were, on average, more likely to say that they would be willing to attend a public meeting in the future; the effect size was slightly greater for those who received the deliberation treatment (0.05 standardized units) than for those who received the standard meeting treatment (0.04 standardized units). While substantively slight, the robustness of the results holds, despite adding controls for relevant covariates. Overall, previous board meeting attendance and preexisting trust in local officials were the strongest predictors of respondents’ willingness to attend school board meetings in the future. Even when holding those factors constant, however, exposure to more participatory and more deliberative school board meetings also generated a distinct shift in behavioral intention.
Modeling Willingness to Attend a Meeting in the Future
Note: Box-and-whisker plots represent estimates from an ordinary least squares regression model. Willingness to attend board meetings operates as the dependent variable. Estimates in which the thickest bar crosses the dotted line = p < 0.10 (90%). Estimates in which the thinnest bar crosses the threshold = p < 0.05 (95%). Estimates in which both bars cross the threshold = p < 0.01 (99%).

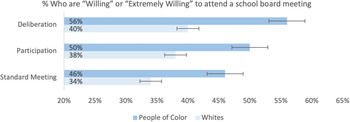
The trends occurring alongside the participation and deliberation treatments add clarity to the larger picture. Low-income participants were statistically no more or less likely to be willing to attend meetings in the future regardless of which meeting type they viewed (not shown). Meanwhile, people of color, on average, expressed a stronger motivation for attending meetings, and again this was regardless of meeting type. A deeper look into these separate trends, though, shows that the magnitude of the racial/ethnic differences remained consistent across treatments (see Figure 9). Between white respondents and people of color, the standard meeting led to the lowest interest in attending a future meeting (34% for whites; 46% for people of color). For white participants, it increased to 38% for those who received the participation treatment and 40% for the deliberation treatment. However, 50% of people of color in the participation treatment were willing to attend a future meeting, as were 56% of the people of color who received the deliberation treatment. So, while there were consistent differences between white respondents and people of color across groups, the magnitude of those differences suggests that people of color responded particularly well to the treatments.
Posttreatment Willingness to Attend a Meeting in the Future, by Group Assignment and Identification as White or Person of Color
Note: Total separation across standard error bars = p < 0.01 (99%).

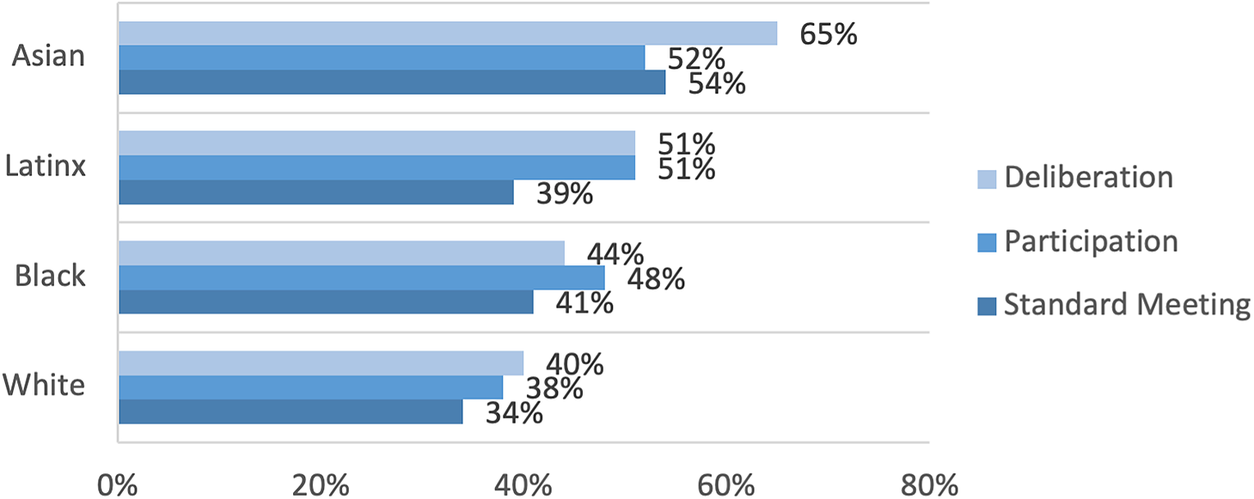
Differences across racial and ethnic groups—beyond the white/people-of-color dichotomy—suggest that members of different groups had distinct responses to the treatments (see Figure 10). Latinx individuals were the most responsive in terms of sheer effect size, though for that group, the deliberation treatment was no more effective than the participation treatment (a 12% difference from the standard treatment for each). Asian Americans, as a group, showed the strongest intention to attend a meeting in the future, ranging from 52% to 65%. However, while the deliberation treatment had an 11% estimated effect, Asian Americans were the only group that was least likely to attend a meeting after seeing the participation treatment. Black individuals demonstrated an almost opposite pattern: Blacks were the only group more responsive to the participation treatment (7% effect) than to the deliberation treatment (only a 3% effect).
Posttreatment Willingness to Attend a Meeting in the Future, by Group Assignment and Race/Ethnicity.

The results suggest that, among people of color, different groups harbor different types of skepticism. One can interpret the results for Black respondents to be in an indication that, on average, they may be more skeptical of how genuine the responses from local officials really are. This skepticism may be heightened by the descriptively unrepresentative nature of the school board they were shown. Meanwhile, Asian Americans, on average, appeared to be more unsettled by the notion of participation without the bureaucratic order from the standard meeting or the institutionalized deliberation component. However, Latinx individuals seemed to respond well to the idea of engagement regardless of whether there were elements of deliberation or not. Thus, while people of color as a whole demonstrated higher levels of change posttreatment, these group distinctions show different reactions to the treatments in very important ways.
Other patterns in who found meetings more appealing further illustrate why engaging meeting treatments (particularly the deliberation treatment) were so effective. Individuals across meeting types were more likely to be willing to attend future meetings if they held high trust in local officials pretreatment, believed that their own school board engages in public deliberation, believed that their own school board involves the community in decision making, and indicated that their primary issue of concern was related to funding. Meanwhile, the treatments provided images of relatively discursive school board meetings that centered the issue of teacher funding, and the treatments proved to increase trust. In other words, all of the other factors associated with future attendance speak directly to why the experience with the treatments seemed to influence how respondents viewed school boards and public meetings.
Implications
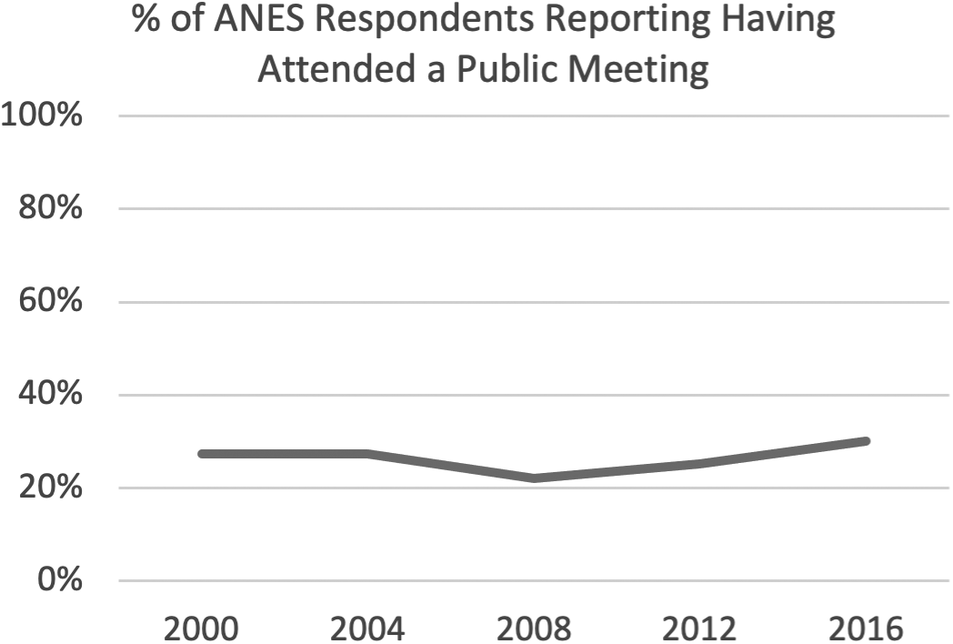
Public meetings are a critical component of American democracy. Of the most used types of political participation, attending a public meeting is the only one that allows for citizens to have direct contact with policy makers in real time. As Brian Adams (Reference Adams2004, 43) states, public meetings “can facilitate citizen participation and the development of good policy by assisting citizens in achieving their political goals.” Public meetings create proverbial windows of transparency, which allow for citizen oversight of the legislative behavior of political elites. Despite the utility of these meetings to American democracy, public meeting attendance as a form of political participation is underutilized. Since 2000, in each year that the American National Election Study (ANES) has been administered, only 20% to 30% of Americans report having attended at least one meeting over the course of previous the year (see Figure 11). This means that, in a given year, over 70% of Americans never attend a public meeting at all. If federal elections experienced such consistently low levels of participation, we would consider American democracy to be in deep crisis.
Self-Reported Public Meeting Attendance over Time (National Sample)
Note: Data come from the American National Election Survey. One instrument asks about attending meetings around an election campaign; the other asks about meeting attendance in the context of community/schools. Percentages do not include postelection drop-off respondents and nonresponses.

The threat that low and uneven public meeting attendance creates for American democracy has long been a concern for political scientists. “The town meeting has certainly lost a great deal of the power it once had, and attendance has declined,” writes Jane Mansbridge (Reference Mansbridge1980, 127). As such, the findings of this study have implications for how public meetings can generate more participation and help deepen trust in local institutions, especially school boards. The evidence presented above indicates that exposing individuals to public meetings that feature direct citizen participation and public deliberation, respectively, directly leads to increased trust in local officials and an increased willingness to attend public meetings in the future. The upshot here is that vibrant, engaging meetings can beget active, well-attended meetings.
This study merely pierces the surface of implications for just how effective more engaging types of public meetings can be. There are aspects of the design that actually suppress the magnitude of the effects. The most obvious constraint is that study participants were shown a video clip instead of having an opportunity to attend a meeting in person. A secondary limitation is that the survey respondents did not have an opportunity to participate in the actual meeting. Previous experimental work tells us that these types of experiences are slightly more influential when they feature face-to-face interaction than when online (Min Reference Min2007), and the opportunity to actually participate in the discourse does add motivation to attend a political event, be it face-to-face (Gastil Reference Gastil2000) or online (Neblo et al. Reference Neblo, Esterling, Kennedy, David and Sokhey2010). Moreover, the clips that survey participants viewed ranged from 90 to 150 seconds, which reflects a very light amount of exposure to citizen participation and deliberation. So, theoretically, I would expect even stronger effects to emerge should study participants receive multiple doses of the treatment, to where the deliberation treatment, in particular, can potentially become normalized. Existing research suggests that establishing deliberative governing norms can strengthen local representation (Collins Reference Collins2018; Reference Collins2019).
This study also deepens important questions for the study of local politics and the politics of education. To the former, it addresses the lingering question of how to increase local participation and feelings of trust toward local officials. This study also suggests that individuals from low-income households and people of color react positively to ideas of accessible mass participation and direct responses from local government officials, although in varying ways. Again, there are studies suggesting that public meetings are biased toward the most privileged groups, but this study provides evidence that variation in structure could help reduce some of the inequity. Similarly, studies of the politics of education highlight how undemocratic education decision making has become, and perhaps institutionalizing deliberation could be a tool that helps reverse that trend as well.
Increasing citizen participation and institutionalizing deliberation are by no means singular cures to the citizen engagement woes occurring across the United States. Simply changing the structure of meetings on its own is unlikely to be the single mechanism that transitions local board meetings from no participation at all to a civic engagement utopia. People of different cultural backgrounds have different relationships with local power, which create different reactions to democratic innovation—some positive, some negative. More simply, those who are used to being powerless will expect powerlessness, even when there is public deliberation. However, changing meeting structure could be a way for local institutions to begin breaking the cycle. When done in concert with policy agendas that address the needs of the most vulnerable, meetings that feature public deliberation could be extremely effective. In sum, changing public meeting structure is not the single strategy that can be used to cure ailing local democracies, but this study suggests that it could be a useful tool.
SUPPLEMENTARY MATERIALS
To view supplementary material for this article, please visit http://dx.doi.org/10.1017/S0003055421000320.
DATA AVAILABILITY STATEMENT
Research documentation and data that support the findings of this study are openly available at the American Political Science Review Dataverse: https://doi.org/10.7910/DVN/K04IOD.
ACKNOWLEDGMENTS
I am extremely grateful to Marion Orr, Ken Wong, Kevin Esterling, Jessica Trounstine, Heather Hill, Corey Brettschneider, Sarah Anzia, Vladimir Kogan, Melissa Arnold, Naomi Levy, and Meghan Wilson for feedback on early versions of this manuscript. Their contributions proved to be invaluable. I also benefitted from early feedback received from the Brown University Annenberg Institute for Education Reform Half-Baked Seminar and the Brown University Taubman Center Research Workshop.
CONFLICT OF INTEREST
The author declares no ethical issues or conflicts of interest in this research.
ETHICAL STANDARDS
The human subjects research in this article was reviewed and approved by the Brown University Institutional Review Board, and certificate numbers are provided in the appendix. This article adheres to the APSA’s Principles and Guidance on Human Subject Research.




Comments
No Comments have been published for this article.