Introduction
Feelings of unsafety or related anxieties such as fear of crime, feelings of uncertainty or insecurity, are considered to be one of the most serious problems afflicting individuals and communities (Amerio and Roccato Reference Amerio and Roccato2005), as they are closely related to quality of life (Bowling and Gabriel Reference Bowling and Gabriel2007). When feelings of unsafety are examined amongst older people, the ‘fear of victimisation paradox’ is often mentioned in the literature (Hale Reference Hale1996). This paradox refers to the fact that older adults express greater levels of feeling unsafe, while having the lowest victimisation rates (Hough and Mayhew Reference Hough and Mayhew1983). Consequently, age is often incorporated in research as a predictor of feelings of unsafety. However, why older people feel unsafe is a question asked less frequently and research has paid little attention to the specific factors influencing feelings of unsafety in later life (Acierno et al. Reference Acierno, Rheingold, Resnick and Kilpatrick2004). Moreover, feelings of unsafety are not inherent in personal characteristics, and focusing on the individual level ignores the importance of social and political forces: individuals who live in different settings age differently (Baars et al. Reference Baars, Dannefer, Phillipson, Walker, Baars, Dannefer and Phillipson2006).
In the gerontological literature, the quality of the neighbourhood is increasingly acknowledged as playing a role in shaping quality of life and wellbeing of older people (Buffel et al. Reference Buffel, Verté, De Donder, De Witte, Dury, Vanwing and Bolsenbroek2012; World Health Organization (WHO) 2007). However, in urban and suburban environments, the context of the local environment is seldom recognised as an important theoretical or empirical component of feelings of unsafety (Adams and Serpe Reference Adams and Serpe2000). Nevertheless, ‘neighbourhoods’ and ‘locality’ appear to be crucial for feeling safe and secure in later life. Both the constraints as well as the opportunities of the local context that influence feelings of unsafety in later life require further research.
This paper aims to explore how ‘the perceived design of the environment’ can either promote or hinder feelings of unsafety among older people. First, a review of the literature on the linkages between the physical neighbourhood and feelings of unsafety is presented. Next, in order to extend this perspective, issues on the relevance of neighbourhood in later life are discussed. Finally, using data generated from the Belgian Ageing Studies, multivariate analyses are undertaken to explore the perceived quality of neighbourhood design on feelings of unsafety.
Physical characteristics of the neighbourhood and feelings of unsafety
During the 1980s, the idea that feelings of unsafety were caused or enhanced by certain characteristics of the built environment received considerable attention among academics and policy makers. The basic assumption is that physical characteristics of the residential setting influence feelings of unsafety (Little, Panelli and Kraack Reference Little, Panelli and Kraack2005). The most well-known theory in this domain is the disorder or broken windows theory, which assumes correlations between incivilities, crime and feelings of unsafety. It stresses the influence of neighbourhood incivilities on feelings of unsafety, arguing that incivilities are an indicator of weakened social control in the neighbourhood and a lack of concern about the area (Wilson and Kelling Reference Wilson and Kelling1982). Other words used for incivilities are signs of crime, early signs of danger, perceived neighbourhood problems and disorder (LaGrange, Ferraro and Supanic Reference LaGrange, Ferraro and Supanic1992; McCrea et al. Reference McCrea, Shyy, Western and Stimson2005).
Wilson and Kelling (Reference Wilson and Kelling1982) use the symbol of a broken window in a building. If this window is left unrepaired, other windows will soon be broken as well because the local residents interpret this broken window as a sign that nobody cares about the neighbourhood. Informal social control weakens and incivilities increase. A downward, self-reinforcing spiral results in a breakdown of informal social control, and an increase in incivilities, the occurrence of serious crime thereby creating pervasive feelings of unsafety.
Although a number of empirical studies have used different ways of measuring feelings of unsafety (uni-dimensional and multi-dimensional, including fear of crime, perceptions of risk, feeling safe in the neighbourhood as well as mistrust), all have supported the above theory whereby incivilities heighten subjective perceptions of unsafety (Doran and Lees Reference Doran and Lees2005Footnote 1; Hinkle and Weisburd Reference Hinkle and Weisburd2008Footnote 2; Perkins and Taylor Reference Perkins and Taylor1996Footnote 3; Ross and Jang Reference Ross and Jang2000Footnote 4; Wyant Reference Wyant2008Footnote 5). Moreover, Franklin, Franklin and FearnFootnote 6 (Reference Franklin, Franklin and Fearn2008) have examined the differential influence of vulnerability, disorder and social integration on feelings of unsafety in 21 cities in the United States of America, and conclude that neighbourhood incivilities are the most influential determinant of feelings of unsafety compared with the other conceptual models.
Several researchers have elaborated the broken windows theory. A number of authors (e.g. LaGrange, Ferraro and Supanic Reference LaGrange, Ferraro and Supanic1992), for example, have made a distinction between social incivilities, on the one hand (e.g. noise, strangers, homelessness, drunkenness, youths hanging around, etc.) and physical incivilities on the other (e.g. vandalism, trash, vacant housing, abandoned cars, untidy areas, etc.). Despite the empirical support for the broken windows theory, LaGrange, Ferraro and Supanic (Reference LaGrange, Ferraro and Supanic1992) state that subjective social and physical incivilities have only an indirect effect on feelings of unsafety. Furthermore, studies using objective measures (i.e. independent of the survey respondents) have identified considerably weaker relationships with feelings of unsafety than studies using subjective measures (Brunton-Smith Reference Brunton-Smith2011; Perkins and Taylor Reference Perkins and Taylor1996). Perceptions of neighbourhood disorder are not the same among residents of the same neighbourhood, demonstrating that factors other than the objective presence of disorder and incivilities are present (e.g. Franzini et al. Reference Franzini, Caughy, Nettles and O'Campo2008). For instance, objective factors (measured by police crime reports), as well as individual differences such as time spent on the streets or the type of social network shape these perceptions (Latkin et al. Reference Latkin, German, Hua and Curry2009).
The built living environment: more than just ‘broken windows’
While the focus of research on feelings of unsafety has been on disorder and crime, recently there has been a shift towards a broader understanding of the concept. Pain (Reference Pain2000: 365) outlines this as follows: feelings of unsafety are seen as inseparable from a range of social problems such as housing and environmental planning. Especially in terms of ageing, a number of gerontological researchers emphasise the importance of the local environment (Peace et al. Reference Peace, Wahl, Mollenkopf, Oswald, Bond, Peace, Dittmann-Kohli and Westerhof2007; Wahl et al. Reference Wahl, Scheidt, Windley and Schaie2004). Since older people often tend to be more reliant on their neighbourhood, the local environment may have a particular impact on the wellbeing of older adults (Robert Reference Robert2002; Schieman and Pearlin Reference Schieman and Pearlin2006). This is demonstrated, for example, through studies showing an association between perceived neighbourhood problems and poor mental health (e.g. Echeverria et al. Reference Echeverria, Diez-Roux, Shea, Borrel and Jackson2008). According to Pain (Reference Pain2000), feelings of unsafety are rooted in place and vary between places. The development of theoretical links with geographical and environmental perspectives may therefore be crucial for understanding older people's sense of safety in the neighbourhood (Buffel et al. Reference Buffel, Verté, De Donder, De Witte, Dury, Vanwing and Bolsenbroek2012).
The importance of the immediate living environment in later life is also expressed in environmental gerontology (Lawton and Nahemov Reference Lawton, Nahemov, Eisdorfer and Lawton1973) and in the more recent policy framework of Global Age-friendly Cities (WHO 2007), which could stimulate the debate on the relation between the environment and feelings of unsafety. Already in its submission to the Second World Assembly on Ageing in 2002, the WHO acknowledged that age-friendly outdoor spaces and buildings are of particular importance for older people. Most physical aspects of age-friendly environments can be classified into three categories: community accessibility, physical design, and the practical and leisure services.
Community accessibility (Fernandez-Ballesteros Reference Fernandez-Ballesteros2001; WHO 2007) emphasises the importance of comfortable, passable surroundings without obstacles, pleasant sidewalks and sufficient safe pedestrian crossings, in other words a neighbourhood accessible for cyclists, pedestrians and wheelchair users alongside others (Sygiyama, Thompson and Alves Reference Sygiyama, Ward Thompson and Alves2008; WHO 2007). Safe sidewalks are essential for all age groups, but may be particularly important for older people who experience walking difficulties and fear of falling. Not only does the quality of sidewalks appear to be essential for older people, but also the presence of ‘pause locations’ (Verté, De Witte and De Donder Reference Verté, De Witte and De Donder2007). For instance, in Belgium, 42.7 per cent of older people have expressed the need for more public toilets in the residential environment and almost as many (37.8%) have stated that there are insufficient benches in the neighbourhood (Verté, De Witte and De Donder Reference Verté, De Witte and De Donder2007). ‘Community accessibility’ also encompasses issues relating to transportation and traffic. Mobility in traffic plays an important role in the daily lives of older people (WHO 2007).
Second, the WHO report (2007) addresses the attractiveness of the physical design of the neighbourhood. The aesthetic appeal of the environment is an important feature of a neighbourhood. For example, parks and green spaces render the neighbourhood more attractive. In addition, green spaces are one of the most frequently mentioned features of age-friendliness (WHO 2007). Although Moudon et al. (Reference Moudon, Lee, Cheadle, Collier, Johnson, Schmid, Weathers and Lin2006) conclude that parks and trails do cater adequately for the needs of older people, the pleasantness of a neighbourhood's open space (e.g. the quality of trees and plants) usually plays an important role in the general life satisfaction of older people (Sygiyama, Thompson and Alves Reference Sygiyama, Ward Thompson and Alves2008). However, the influence of green spaces on feelings of unsafety is not unequivocal. Recently, Maas et al. (Reference Maas, Spreeuwenberg, Van Winsum-Westra, Verheij, de Vries and Groenewegen2009) have demonstrated associations between appreciations of green spaces and enhanced feelings of social safety (Maas et al. Reference Maas, Spreeuwenberg, Van Winsum-Westra, Verheij, de Vries and Groenewegen2009). In addition to green spaces and parks, older people also rate the cleanliness of streets as an important feature in the attraction of the physical design of the neighbourhood (WHO 2007).
A third and last feature of the physical environment concerns practical and recreational services. Older people who like their neighbourhood stress the importance of good access to shops and amenities (Scharf, Phillipson and Smith Reference Scharf, Phillipson and Smith2003). Föbker and Grotz (Reference Föbker and Grotz2006) have investigated which living conditions best meet the needs of older people and point out the importance of basic supply resources and recreational facilities within the neighbourhood. Supermarkets, bakers’ shops, butchers, banks, post offices, and other outlets, preferably grouped together and located in the immediate living environment of older people, are an important feature of age-friendly environments (WHO 2007). However, the bulk of research on feelings of unsafety has neglected the importance of community accessibility, attractiveness, and presence of practical and recreational services.
Research questions and hypotheses
After having examined the literature on feelings of unsafety, we can state that in general, most research on the relation between the physical characteristics of the environment and feelings of unsafety concentrates on incivilities and disorder. Wilcox, Quisenbery and Jones (Reference Wilcox, Quisenbery and Jones2003) suggest that future research should examine additional contextual factors to find out why feelings of unsafety vary across neighbourhoods. Our argument is not that physical disorder and incivilities are unimportant for explaining feelings of unsafety. However, drawing on insights from environmental gerontology (Lawton and Nahemov Reference Lawton, Nahemov, Eisdorfer and Lawton1973), we hypothesise that perceived disorder may be less important in explaining feelings of unsafety when other perceptions of an age-friendly built environment are taken into account (=hypothesis 1). Insights from environmental gerontology point to some crucial components of the neighbourhood for older residents. Given the above, we hypothesise that older people who perceive their environments to be accessible, attractive and adapted in terms of practical and recreational services experience higher feelings of safety, even when several city-level objective indicators are taken into account (=hypothesis 2). Finally, we aim to determine which perceived physical aspects of the residential environment are key determinants in interpreting feelings of unsafety.
Methods
Data collection
The Belgian Ageing Studies project is a large-scale survey which has used a structured questionnaire to gather information on various aspects of quality of life among older adults since 2004. The research project was developed in co-operation with the provincial government, local authorities and local senior organisations. Based on the principles of peer-research, peers were involved as voluntary partners in the data collection. Older volunteers were recruited through a specifically developed, intensive recruitment campaign (Verté, De Witte and De Donder Reference Verté, De Witte and De Donder2007). In each of the 99 municipalities between 30 and 100 older volunteers participated in the project. All volunteers received several training sessions.
The volunteers invited respondents to participate in the research project by sending them a letter and subsequently making face-to-face contact a few days later. The questionnaire was designed to be self-administered, although volunteers were allowed to clarify the meaning of questions, if requested. All volunteers were specifically trained to execute their task. Respondents were assured of the voluntary nature of their participation, their right to refuse to answer and the privacy of their responses. Neither the respondents nor the volunteers received any remuneration for their participation.
Sample
The target population of the study comprised home-dwelling residents, aged 60 and over. The present study is based on data gathered in 99 municipalities from the Dutch-speaking part of Belgium (Flanders; 308 municipalities). Each municipality could freely decide to participate in the research project or not. The municipalities that participated in the Belgian Ageing Studies were somewhat larger than average (N=30,624 versus N=20,298 inhabitants) (Study Service of the Flemish Government 2011). In each municipality we applied the same sampling design. A sample was randomly selected from the census records by the local government. We applied a proportional stratified sampling by using gender and age (60–69 years, 70–79 years, 80+) as stratification variables. The sampling fraction depended on the size of the municipality, varying between N=182 and N=1,592. Consequently, the data were not representative at a national level, but each sample was representative for the specific municipality.
Depending on the municipality, interviews were completed with 65–85 per cent of the eligible persons who were contacted. In order to reduce the potential bias of non-response, volunteers received replacement addresses in the same quota category, from an additional sample, to exchange respondents who refused or were unable to fill in the questionnaire. In the following analyses, we excluded cases with missing responses to the main measures (described in greater detail in the next section), resulting in a final sample of 25,980 respondents, with a mean age of 70.6 years, 51.5 per cent women, approximately 57 per cent of the households with a monthly income less than €1,500, 72.7 per cent married and 66.3 per cent with a low educational profile.
Measures
Elchardus and Smits (Reference Elchardus, Smits, Lemaître and Van Geel2003) have developed a questionnaire which measures general feelings of safety. This questionnaire contains eight items and it is regularly used in policy and academic research in Belgium (Elchardus and Smits Reference Elchardus, Smits, Lemaître and Van Geel2003). The psychometric properties of the scale have been examined for adults living in Flanders (Belgium): confirmatory factor analyses support a one-factor model and provide good-fit measures (Elchardus and Smits Reference Elchardus, Smits, Lemaître and Van Geel2003). Using this instrument, an adapted version was developed for older people. Because two items of the original questionnaire were not applicable to older adults they were replaced by two other questions. In the present study, we use this Elders Feelings of Unsafety (EFU) scale. The eight items used to measure Elders Feelings of Unsafety were:
• You have to be extra careful when you are out on the streets at night.
• These days it is not safe to be out on the streets at night.
• These last ten years the streets have become less safe.
• After nightfall I don't open the door when someone rings.
• These days it is not safe to let children out on the streets without supervision.
• I seldom go out alone because I am afraid of being mugged.
• These days an alarm system is more than just a gadget.
• When I go away on holiday I don't dare leave my house unwatched.
Answer categories ranged from completely disagree (1) to completely agree (5). The EFU scale was validated among older adults, using Confirmatory Factor Analyses (CFA) (χ 2(18)=116.63, p<0.001; goodness of fit estimates were Goodness of Fit Index (GFI)=0.97, Tucker–Lewis Index (TLI)=0.96, Comparative Fit Index (CFI)=0.97 and Root Mean Squared Error of Approximation (RMSEA)=0.074 with 90% interval between 0.062 and 0.087). CFA produced factor loadings ranging from 0.59 to 0.82. These statistics indicate that the scale adequately captures feelings of unsafety. The one-factor model proved to be internally consistent with a Cronbach's alpha of 0.89. The final EFU scale derived from the CFA summarises the eight questions on feelings of unsafety and has five points, ranging from 1 (feeling completely safe) to 5 (feeling completely unsafe).
The independent variables measure the perceived quality of the physical design of the neighbourhood. According to Hinkle and Weisburd (Reference Hinkle and Weisburd2008), it is essential for studies on feelings of unsafety that residents know their neighbourhood well in order for it to have an impact on feelings of unsafety. Moreover, Kullberg et al. (Reference Kullberg, Karlsson, Timpka and Lindqvist2009) suggest that using self-assessed area reputation and perceived aspects of the design of the neighbourhood are more important in researching feelings of safety than objective measures. Therefore, the present study assessed neighbourhood characteristics using individual self-report items. Furthermore, the meaning of ‘neighbourhood’ is relative and in part dependent on the quality of social interactions (Buffel et al. Reference Buffel, Verté, De Donder, De Witte, Dury, Vanwing and Bolsenbroek2012). In this study, neighbourhoods were not geographically delineated. When questions were asked about ‘their’ neighbourhood, the delineation of the neighbourhood was left to the respondent's own interpretation. In addition to these self-reported items, a selection of city-level objective measures is included.
First, two items measured subjective assessments of disorder. Respondents could indicate whether their neighbourhood experienced ‘Litter and degeneration’. The reply options were ‘no’ (0) or ‘yes’ (1). Second, in terms of perceptions of community accessibility, we asked what residents believed the neighbourhood was lacking. A long list of answers was presented. In terms of community accessibility, possible answers were: benches, pedestrian crossings, bus stops and public toilets (0=no; 1=yes). In addition, it was asked whether they experienced problems with obstacles in the neighbourhood (0=no; 1=yes). Next, respondents were asked to express their satisfaction with the condition of the sidewalks. Respondents could answer on a Likert scale from ‘completely satisfied’ (1) to ‘completely not satisfied’ (5). Two questions were asked concerning street traffic: whether they experienced street traffic as too heavy in their neighbourhood (0=no; 1=yes) and whether generally speaking they experienced road safety problems. No specifications were made whether this was an experience as a pedestrian or as a driver. Possible answer categories were: never (1), seldom (2), sometimes (3) and often (4).
Three items measured attractive physical design. The first item assessed whether the neighbourhood had sufficient green and parks (0=sufficient; 1=insufficient). The second item measured whether lighting was adequate on the streets (0=sufficient; 1=insufficient). And third, residents were asked whether their environs looked cosy or not (0=no; 1=yes). To assess the perceived presence or absence of services, we questioned whether the distance to services (e.g. grocery stores, butcher, etc.) was too long in their neighbourhood. Respondents could answer on a 1–5 Likert scale from ‘completely disagree’ to ‘completely agree’. Finally, residents were asked if ‘there are too few services in the neighbourhood’ (0=no; 1=yes) and if they experienced problems with ‘insufficient recreational opportunities in the neighbourhood’ (never=1; seldom=2; sometimes=3; often=4). Because objective data on the level of neighbourhoods were not available, five city-level objective indicators were used in the study: population size, socio-economic profile (the level of average income in the municipality), number of road accidents, crime rate and the level of resources of a municipality (measured by the quality and quantity of services/amenities relative to the number of inhabitants). All indicators were measured on the level of municipalities (Loopmans et al. Reference Loopmans, Van Hecke, De Craene, Martens, Schreurs and Oosterlynck2010; Study Service of the Flemish Government 2011). Control variables included gender, age and number of children. These variables were used to control for participants’ vulnerability (Roccato, Russo and Vieno Reference Roccato, Russo and Vieno2011). Additionally, in terms of our research population, widowhood (1=widowed; 2=not widowed – includes both married, never married, cohabiting and divorced people) can be identified as an additional proxy of vulnerability (Van den Brink et al. Reference Van den Brink, Tijhuis, van den Bos, Giampaoli, Kivinen, Nissinen and Kromhout2004).
Analytic procedure
The analytic strategy consists of two steps. First, Pearson correlations were used to evaluate the associations between feelings of unsafety and the diverse indicators of quality of the local environment. In order to predict and explain people's feelings of unsafety, the second step was a multiple linear regression model. Model 1 includes the control variables, city-level objective indicators, and features of perceived neighbourhood disorder. In Model 2, subjective community accessibility, attractive physical design, and perceptions on practical and recreational services were added. In order to calculate each independent variable's importance in predicting the dependent variable, unstandardised coefficients, standard errors and standardised beta coefficients are presented. Collinearity diagnostics were assessed to reveal whether a high correlation among the independent variables exist. The cut-off criterion was set at variance inflation factor (VIF) >2.0, indicating a multicollinearity problem.
Results
Descriptives
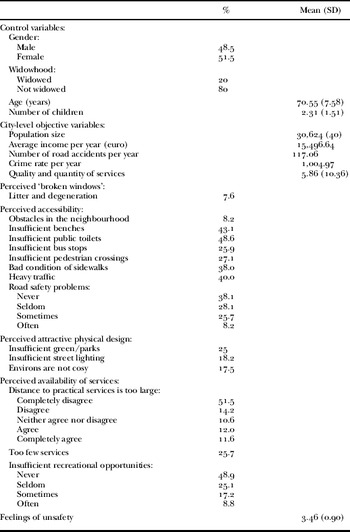
Table 1 presents the characteristics of the sample (N=25,980). Nearly 8 per cent of people aged 60 and over reported their neighbourhood to be dirty. When they considered neighbourhood accessibility, almost half of the sample would prefer more public toilets in the neighbourhood, and 43.1 per cent were not satisfied with the number of benches in their surroundings. Moreover, approximately four out of ten older adults complained about heavy street traffic and bad sidewalks. Furthermore, approximately 25 per cent indicated that there were insufficient areas of green spaces and parks in the neighbourhood. Regarding practical and recreational services, nearly one in four respondents indicated that they lacked practical services and recreational opportunities in their neighbourhood.
Descriptive statistics for independent and dependent variables (N=25,980)

Correlations
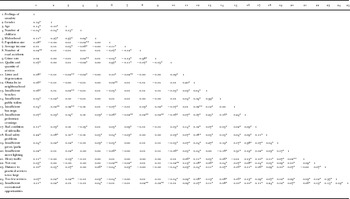
Table 2 presents the correlation coefficients for the variables used in the analyses. Road safety problems showed the strongest correlation coefficient with feelings of unsafety, followed by bad condition of the sidewalks, insufficient recreational infrastructure and heavy street traffic. In terms of city-level objective indicators, average income per year and crime rate were not significantly related to feelings of unsafety and consequently omitted from the next steps in the analyses.
Bivariate correlations (Pearson ρ) for the regression variables (N=25,980)

Significance levels:
* p<0.001,
** p<0.01.
Furthermore, there were substantial correlations among some of the independent variables, which could produce multicollinearity and distort the model fit. Checks of tolerance levels and VIF values showed values, respectively, above 2.0 or under 0.50 for the variable ‘population size’. This indicated multicollinearity problems and consequently this variable was excluded from further analysis.
Regression
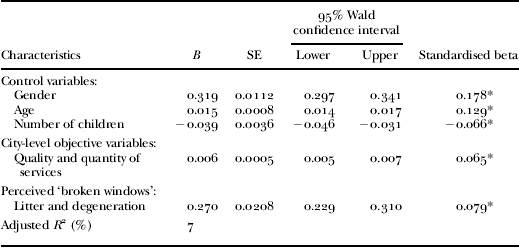
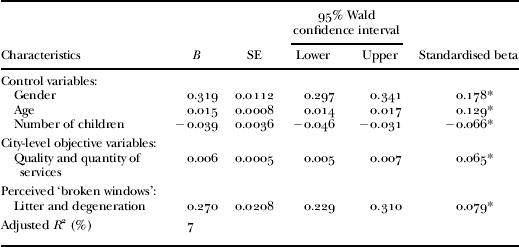
Results for the regression analysis of Model 1 are presented in Table 3. As for perceived disorder, physical incivilities in the neighbourhood showed a positive coefficient, indicating that the more litter and degeneration older people perceived and experienced in their neighbourhood, the more unsafe they felt. Further, the number of children was significant: the more children older people had, the fewer feelings of unsafety they experienced. The Adjusted R 2 suggests that the independent variables of Model 1 explain 7 per cent of the variance of feelings of unsafety.
Generalised Linear Regression coefficients of neighbourhood disorder on feelings of unsafety (Model 1) (N=25,980)
Note: SE: standard error.
Significance level:
* p<0.001.
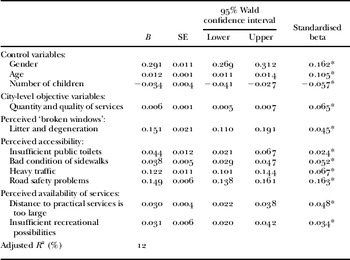
Table 4 presents the results of the multiple regression analysis using a broad range of neighbourhood characteristics (Model 2). In comparison with Model 1, self-rated litter and degeneration remained significantly associated with feelings of unsafety, although the regression coefficients decreased. Furthermore, several features of perceived accessibility of the neighbourhood showed a significant relation with feelings of unsafety. These included subjective road safety problems, the bad condition of sidewalks experiencing heavy street traffic and a lack of public toilets.
Generalised Linear Regression coefficients of indicators of neighbourhood quality on feelings of unsafety (Model 2) (N=25,980)

Note: SE: standard error.
Significance level:
* p<0.001.
When several features of an age-friendly neighbourhood are incorporated, subjective attractive physical design, the perceived presence of green and parks, sufficient street lighting, and a cosy outlook were not related to feelings of unsafety. As for the practical and recreational services, the results indicate that the perceived distance to practical services played a significant role in explaining feelings of unsafety. Older people who regarded this distance as too far felt more unsafe. Finally, not being satisfied with the number of recreational opportunities in the surroundings is a significant contributor in interpreting feelings of unsafety.
Despite controlling this regression analysis for age, gender, widowhood and number of children, the relations between diverse features of the quality of the local environment and differences in feelings of unsafety remain substantial and statistically significant. Older people and especially women reported significantly higher levels of feelings of unsafety. Moreover, one city-level objective indicator (quantity and quality of services) remained significantly related with feelings of unsafety. The regression model explained 12 per cent of the variation in feelings of unsafety. This explained variance was not high, but neither was it extraordinarily low.
Discussion
This study has demonstrated that the perceived quality of the local design of the environment can influence older adults’ feelings of unsafety. Moreover, the results indicate that it is meaningful to integrate a broad range of measures on the perceived quality of the local environment. In addition to perceived disorder heightening feelings of unsafety, subjective community accessibility and infrastructure facilities in later life are important as well. These associations are statistically independent of socio-demographic characteristics, and a selection of city-level indicators.
The results confirm hypothesis 1: disorder becomes less important in explaining feelings of unsafety in later life when other aspects of the built environment are taken into account. This does not mean that physical disorder and incivilities are unimportant. Physical incivilities remain positively associated with feelings of unsafety, indicating that the more litter and degeneration older people perceive, the more unsafe they feel. These findings are in line with several studies (e.g. Franklin, Franklin and Fearn Reference Franklin, Franklin and Fearn2008; Wyant Reference Wyant2008) and support the broken windows theory. However, some of the associations between perceptions of neighbourhood physical disorder and feelings of unsafety are explained by their correlation with perceptions of other characteristics of neighbourhood built environments.
Second, a neighbourhood which is perceived as physically adapted to older people is found to relate to greater feelings of safety, supporting hypothesis 2. As for subjective neighbourhood accessibility, older people who are dissatisfied with the number of public toilets and the condition of the sidewalks experience more feelings of unsafety. The first finding supports research that found that public toilets are essential for the creation of accessible, inclusive cities (Greed Reference Greed2006). Greed (Reference Greed2006) suggests that inadequate public toilet provision may reduce mobility-behaviour. The second finding may suggest that feelings of unsafety are related to fear of falling over loose paving stones. However, the underlying reasons and explanations of the above findings should be explored further in future research. In addition, experiencing road safety problems was found to be positively associated with feelings of unsafety and this feature appears to be the most important contributor. Heavy traffic increases feelings of unsafety, a finding in line with previous research (Hunter and Baumer Reference Hunter and Baumer1982). The influence of road safety on feelings of unsafety among older people, however, remains a neglected topic of research and it mainly concerns elders’ driving behaviour. Road safety issues for older people, however, may refer to other problems. In general, older road users feel that they receive too little respect and consideration from other road users. Heavy traffic and careless car drivers are the main concerns and problems for many older drivers (Christiaens et al. Reference Christiaens, Daems, Dury, De Donder, Lambert, Lannoy, Nijs, Verté and Vleugels2009).
Finally, this study supports previous findings suggesting that there is an association between the perceived presence of recreational possibilities, the subjective distance to practical services and feelings of unsafety. Moudon et al. (Reference Moudon, Lee, Cheadle, Collier, Johnson, Schmid, Weathers and Lin2006) propose that the presence of such services should be located within a one-kilometre circle. Sygiyama, Thompson and Alves (2008) even suggest that 700 metres is even more appropriate for older people. Infrastructure facilities in the locality could be considered, not only as business centres, but also as meeting places for local residents. A socially fit environment with a good infrastructure which endorses social contact and access (transport) adds to quality of life (Bowling and Gabriel Reference Bowling and Gabriel2007). The availability of shops in the neighbourhood is considered to be important, not only resulting in a higher neighbourhood satisfaction and neighbourhood social cohesion (Föbker and Grotz Reference Föbker and Grotz2006), but apparently also to feelings of safety.
Our findings should be considered in the light of the following limitations, each of which raises questions to be addressed in future research. First, a stronger measure of perceived disorder such as the physical disorder scale developed by observational studies of neighbourhoods in Chicago (Sampson and Raudenbush Reference Sampson and Raudenbush1999) or the ‘broken windows index’ (including housing quality, abandoned cars, trash and public school deterioration) developed by Cohen et al. (Reference Cohen, Spears, Scribner, Kissinger, Mason and Wildgen2000) can enrich the research design and could be used in future studies. Second, since data on the level of neighbourhood were not available, we included five city-level objective features in the study. However, the results might suggest that the unit of observation – city level – is too large to reflect influences on feelings of unsafety. Third, using hierarchical multilevel methods could improve our understandings of the relationship between individual vulnerability, neighbourhood and feelings of unsafety in later life by investigating the differential effects of individual and neighbourhood characteristics, and the interconnectedness between them. Fourth, studies on the person–environment relationship are inclined to focus primarily on its physical dimension (Buffel et al. Reference Buffel, Verté, De Donder, De Witte, Dury, Vanwing and Bolsenbroek2012). Future research should also study the social dimension of the local environment in addressing feelings of unsafety in later life (De Donder et al. Reference De Donder, De Witte, Buffel, Dury and Verté2012). Fifth, the results are limited because a causal direction of the relationship cannot be determined in a cross-sectional study. Longitudinal studies could provide more elaborate evidence on the matter of causality. Additionally, qualitative research could give more insight into the meaning of feelings of unsafety, the history and the dynamic processes of development, and perception of a neighbourhood (Franzini et al. Reference Franzini, Caughy, Nettles and O'Campo2008). Finally, research should not only demonstrate that the community context is relevant, but examine the differential relevance between the different local residents (Robert Reference Robert2002).
Finally, the findings raise a number of issues for policy and practice. The physical quality of the local environment can contribute to higher feelings of safety, indicating that environmental design could be encouraged in order to increase feelings of safety. This view is of particular interest to architects, environmental planners, urban developers and geographers. The study has shown that intervention programmes should aim at older people feeling at home and safe in their neighbourhood. This kind of policy would be extremely relevant, not only on the individual level – to help older people to feel safe and heighten their quality of life – but also on the social level, given that high levels of feelings of unsafety can also have a negative effect on the quality of life of the community (Markowitz et al. Reference Markowitz, Bellair, Liska and Liu2001). Such intervention programmes should be context-specific and need local embedding. Creating a sense of safety in a neighbourhood needs to reflect local circumstances and build on the knowledge and experiences of the local residents. Policy makers should try to understand the specific situation of the neighbourhood before prioritising action (Christmann, Rogerson and Walters Reference Christmann, Rogerson and Walters2003). Therefore it is important to include a variety of neighbourhood residents’ perspectives (Latkin et al. Reference Latkin, German, Hua and Curry2009). Carefully matching neighbourhood infrastructure with population lifestyle and needs of the particular neighbourhood residents may reinforce neighbourhood safety. The above-mentioned recommendations fit in perfectly with the age-friendly city framework. Putting this framework into practice places several demands on a variety of sectors: adapting structures and services to a broad range of people with differing needs and capacities (WHO 2007). An age-friendly environment should not only be friendly for ‘old age’, but for all ages. Consequently, the above-mentioned practical recommendations would not only benefit older people, but also contribute to higher feelings of safety among all age groups.
Conclusively, this study indicates that a multi-faceted point of view on neighbourhood and feelings of unsafety is required, with a shift away from approaches which focus only on single domains or areas of life (e.g. incivilities). Feelings of unsafety cannot exclusively be linked to disorder, but are related to broader aspects of age-friendly communities (WHO 2007). Our results support the idea that older people who live in an environment which is perceived as having few road safety problems, little degeneration and litter, with sufficient practical services nearby and with good sidewalks, feel safer. When studying the relation between perceptions of the neighbourhood and feelings of unsafety in later life, not only a criminological perspective is important, but also a broader approach which focuses on feelings of neighbourhood safety as an important dimension of the social environment (Young et al. Reference Young, Russell and Powers2004) and ‘geborgenheit’, social identification with, comfort or feeling at home in the neighbourhood (Blokland Reference Blokland2009; Hutta Reference Hutta2009). Finally, although this study does not disregard the objective aspects of the environment as unimportant, it stresses the importance of perceived aspects, as these are often neglected in policy and practice.
Acknowledgements
We acknowledge the provincial and local governments for their support and co-operation throughout the research. Special thanks to the elder volunteers for their commitment and enthusiasm. An earlier version of this paper was presented in 2010 at the British Society of Gerontology 39th Annual Conference at Brunel University. We thank those attending for their thoughtful comments on our work. Furthermore, we are most grateful to our colleagues for their useful insights on earlier versions of the paper.