Patent pools, where “two or more parties agree to pool their respective technologies and license them as a package,”Footnote 1 have attracted interest as a remedy for excessive litigation and patent blocking, when competing patents prevent the commercialization of new technologies.Footnote 2 Recent examples include proposals to develop diagnostic tests for breast cancer, improve treatments for HIV and AIDS, and develop cures for neglected diseases, including malaria and cholera.Footnote 3 These plans follow the formation of four successful pools in the IT sector during the 1990s: the MPEG-2 pool, the 3G platform, and two DVD pools.Footnote 4 In 2001 the value of U.S. goods produced under pooling agreements exceeded $100 billion.Footnote 5 Antitrust authorities in the United States favor pools because they “provide procompetitive benefits by integrating complementary technologies, reducing transaction costs, clearing blocking positions, and avoiding costly infringement litigation.”Footnote 6
Theoretical models of patent pools predict that pools encourage innovation. Specifically, the prospect of a patent pool increases firms’ incentives to invest in R&D because members can agree to sue infringers as a group and thereby lower their expected costs of litigation.Footnote 7 Pools that combine complementary patents also lower licensing fees for outside firms because they avoid “royalty stacking,” which occurs when multiple patents cover the same product.Footnote 8 In contrast, pools that combine substitute patents can increase license fees for outside firms.Footnote 9 The prospect of a patent pool may also increase the speed of innovation in the time immediately preceding the pool: If the number of patents needed to form the pool is limited, firms may race to develop the technologies that are included in the pool to increase their chance of sharing in the pool's profits.Footnote 10
A lack of contemporary data has made it difficult to establish these effects empirically. Existing empirical work has sharpened our understanding of institutional characteristics, such as the types of licensing deals that pools offer to nonmembers and rent-sharing agreements among pool members.Footnote 11 Nevertheless, there has been little empirical evidence on the effects of patent pools on innovation, mostly because such analyses require much longer time series of data than are available for contemporary pools. Moreover, pools that resolve conflicts about overlapping patents have been extremely rare in recent history.Footnote 12
This article uses the example of the first patent pool in U.S. history, the Sewing Machine Combination (1856–1877), to examine whether patent pools encourage innovation.Footnote 13 One key advantage of the historical setting is that we can observe an industry from its birth to technical maturity, including more than 30 years of data to analyze the long-term effects of a pool. Another advantage is that the sewing machine pool operated in the complete absence of regulation, which allows us to examine how pools behave when regulators give them free reign.Footnote 14 The Combination also shared key characteristics of pools that theoretical models predict will encourage innovation: It was intended to end litigation between its members, and it combined complementary patents.
In the first step of the analysis, we use data on litigation and patents to test the predictions of existing theoretical models. Litigation data confirm that the pool lowered litigation risks for its members.Footnote 15 They also substantiate the prediction that the prospect of a pool encourages patenting among prospective members.Footnote 16
The data, however, also suggest that pool members patented less while the pool was active, and only began to patent more aggressively again after the pool dissolved in 1877. Nonmembers, which account for the vast majority of patents, appear to have been similarly affected by the creation of the pool; patenting increased immediately after 1856, but declined soon afterwards and remained low until the pool dissolved in 1877. These results are robust to the inclusion of time- and firm-fixed effects, as well as a number of alternative controls for increases in the demand for sewing machines.
A potential problem with using patents as a measure of innovation is that firms use patents strategically, for example to protect themselves from litigation or to negotiate a more advantageous position in a pool.Footnote 17 To address this issue, we construct an alternative measure of innovation that objectively quantifies improvements in the performance of sewing machines. Specifically, we use information in company records and trade journals to measure the number of stitches per minute that a sewing machine was able to perform.Footnote 18
Data on sewing speeds confirm the results of the patent data. Innovation slowed soon after the pool had been established and did not recover until the pool had been dissolved. Thus, data on annual patenting and innovation suggest that theoretical models should be extended to capture the potentially negative incentive effects of patent pools on innovation by their members, and incorporate effects of pools on other, nonmember firms which appear to play an important role as drivers of innovation.
The data suggest two ways in which the sewing machine pool may have discouraged innovation. First, by creating a more formidable opponent in court, the pool may have intensified the threat of litigation for outside firms, which lowered expected profits and discouraged innovation. Consistent with this idea, litigation data show that nonmembers were at a greater risk of being sued while the pool was active; pool members acted as plaintiffs in most of these cases. In turn, lower rates of innovation among its competitors may have reduced incentives for pool members to innovate. Second, the existence of a pool that aggressively defended patents may have shifted innovation by nonmembers towards substitute technologies that were not covered by the pool. In the case of the sewing machine industry, outside firms shifted both patenting and innovation (as measured by firm entry with new models of sewing machines) towards an inferior stitching mechanism that was not covered by the pool.Footnote 19
THE EARLY SEWING MACHINE INDUSTRY, 1846–1885
On 10 September 1846, Elias Howe was granted U.S. patent No. 4,750 for “Improvements in the Sewing Machine”—the lock stitch. Although his patent was contested, Howe began to charge a hefty license fee of $25, compared with an average price of $125 per machine in 1856, as soon as the court upheld his patent in 1853.Footnote 20
Despite its high price, Howe's license did not cover all parts that were needed to build a sewing machine, and firms that had patented other parts sued to assert their rights in court. Litigation during the “sewing machine wars” threatened to stop production and sales.Footnote 21 For example, the I. M. Singer Company warned consumers not to buy sewing machines from Wheeler & Wilson or Grover & Baker:
“The unparalleled success of our Sewing Machines has induced several fraudulent imitations of them, besides numerous infringements of our patents–of which we own sixteen…The Wheeler & Wilson, and the Grover & Baker Sewing Machines, as we allege, each infringe three distinct patents owned by us. We have suits against them in several of the U.S. Courts, which will soon be tried. We hereby caution the public not to buy infringing machines, as they can be compelled by law to stop using them, and to pay costs and damages.” Daily Scioto Gazette, 25 October 1856
To resolve such litigation, Singer, along with Wheeler & Wilson, Grover & Baker, and Elias Howe formed a patent pool on 24 October 1856 (Albany Agreement, Singer Papers, Box 225).Footnote 22 With the exception of Howe who did not manufacture any sewing machines, these firms were the dominant producers of sewing machines in 1856.Footnote 23 Their pool combined nine complementary patents that were necessary to build a sewing machine. It survived for the duration of all original patents; no additional patents were added after 1856.Footnote 24 After Howe's lock-stitch patent expired in 1867, the pool continued on the strength of Wheeler and Wilson's patent on the four-motion feeding mechanism and Singer's patent on the horizontal surface.Footnote 25 The pool dissolved on 8 May 1877, when Singer's patent expired.
Consistent with theoretical predictions, the sewing machine pool lowered license fees, especially compared with the high fees that Howe charged prior to the pool.Footnote 26 As soon as the pool had formed, it reduced license fees from $25 to $5 per machine for members and $15 for other firms.Footnote 27 When Howe's patent was renewed in 1860, the pool further reduced license fees to $1 for members and $7 for other firms; when
Howe's patent expired in 1867, the pool abolished fees for members and lowered fees to $5 for other firms; in 1870 the pool reduced fees to $3.Footnote 28 Despite these reductions, differences in license fees between members and other firms may have lowered the competiveness of other firms, and thereby discouraged innovation. The pool, however, licensed freely to
… any manufacturer who had a meritorious machine that was not an offensive imitation of the machine of some other licensed manufacturer (Frederick Bourne, President of the Singer Company, 1883 to 1905).Footnote 29
In fact, Elias Howe demanded that the pool's patents should be licensed to at least 24 manufacturers at any given point in time.Footnote 30 Licensees were free to set their prices independently and the pool placed no other restrictions on their sales.Footnote 31
The pool agreement, however, stipulated that part of the license fee was to be set aside to support its litigation fund, which was to be maintained above $10,000, approximately a quarter million 2009 dollars, exceeding the annual sales of most small manufacturers.Footnote 32 This litigation fund more than sufficed to protect the pool's patents, and members divided remaining funds between each other.
THE DATA
To examine the pool's effects on innovation, we have constructed a new data set that combines annual data on patents by pool members, licensees, and other nonmembers with data on improvements in sewing speeds as an objective measure of innovation. Legal records on litigation, as well as alternative measures for changes in the demand for sewing machines, complement these data.
Sewing Machine Patents by Pool Members, Licensees, and Other Firms
To measure changes in inventive activity over time, we count the number of U.S. patent grants for sewing machines per year, distinguishing patents of pool members from patents of other firms.Footnote 33 Between 1850 and 1885, 4,563 patents were granted in the USPTO main class 112 (“sewing”). From these data, we exclude patents for ancillary inventions, including “attachments” (subclasses 101 and 122 to 153) and “table and stands” (subclass 217). Our final sample contains 3,508 patents issued between 1850 and 1885.Footnote 34 To measure changes in invention in the absence of a pool, we construct a complementary data set of 1,493 British patents between 1850 and 1885.Footnote 35
Firm-level data on individual manufacturers are drawn from collectors’ manuals for antique sewing machines. These data indicate that 170 firms entered the industry between 1845 and 1885.Footnote 36 Entry and exit dates are available for 135 of these firms, nearly 80 percent. One hundred and twenty-one firms entered between 1853 and 1877. Thirty-five firms were licensees.
In interpreting the data, it is important to keep in mind that they may be subject to survivorship bias. Comparisons with census data suggest that collectors’ manuals capture the largest number of firms while the pool was active, 40 percent of all U.S. manufacturers in 1860 (29 of 74 firms), 63 percent (21 of 49 firms) in 1870, and 36 percent (36 of 101 firms) in 1880. Firms that are missing from collectors’ manuals are more likely to be outside firms; to the extent that more of their innovations are captured by collectors’ manuals in the 1860s but not before or after, the data may overestimate innovation by outside firms during the pool.Footnote 37
Improvements in Sewing Speed
One potential problem with using patents as a measure of innovation is that not all innovations are patented and that inventors may use patents strategically, so that changes in patenting do not accurately reflect changes in innovation.Footnote 38 For example, prospective pool members may patent existing innovations more aggressively prior to the pool because they want to improve their negotiating position relative to other members. Similarly, nonmembers may patent more aggressively after the pool has formed to protect themselves from litigation.Footnote 39
To address this issue, we construct an alternative measure of innovation: changes in the number of stitches that a lock-stitch machine can perform within one minute.Footnote 40 Data on sewing speeds for 1845 to 1900 are drawn from the Scientific American, company records, trade cards, and reports from the records of world's fairs, including the Crystal Palace Exhibition of 1851. For example, a description of work in a clothing factory provides data on sewing speed for Union and Wheeler & Wilson in 1889.
The linings are made by a Willcox & Gibbs machine, the topping is done by a two needle Union machine which runs at the rate of about 2,220 stitches per minute, the closing is done by a Weed feed machine, and the other work is done by Wheeler & Wilson's machines which run at the rate of about 1,000 stitches per minute.Footnote 41
Law Suits and Changes in the Demand for Sewing Machines
Litigation data are drawn from Westlaw's pre-1945 federal courts database. Westlaw combines reports from the series, Federal Cases (district and circuit court decisions decided before 1880, compiled in 1892), the Federal Reporter (district and circuit court decisions from 1880 onwards), and the Supreme Court Reports and United States Reports (decisions of the Supreme Court).Footnote 42 Westlaw reports 100 patent disputes regarding sewing machines between 1850 and 1885. We also searched William Robinson's Law of Patents, which includes two additional cases.Footnote 43
Litigation data show that the pool as a whole engaged in 19 legal cases, and pool members acting independently engaged in another 23 disputes.Footnote 44 Litigation data may, however, underestimate the real risk of litigation because they only capture cases that were decided in court and omit cases that were settled out of court. This bias may be more severe for small outside firms that were reluctant to face the pool and its sizable litigation fund in a drawn-out legal dispute.Footnote 45
Finally, to control for changes in demand, we include data on population growth and real GDP.Footnote 46 Across industries, disruptions as a result of the Civil War (1861 to 1865) may have discouraged innovation.Footnote 47 For the sewing machine industry, however, the war may have also encouraged innovation, as it increased demand for machine-made uniforms.Footnote 48 To measure such changes in demand, we control for increases in the size of the Union Army between January 1861 (16,267 soldiers) and January 1865 (959,460 soldiers).Footnote 49
EMPIRICAL RESULTS
Did the Pool Discourage Litigation?
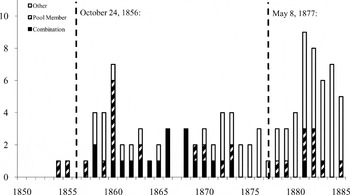
Theoretical models of patent pools predict that pools lower the threat of litigation for their members.Footnote 50 In the case of the sewing machine, the pool's prospective members had engaged in crippling litigation, which was ended by the pool.Footnote 51 Between 1856 and 1877, while the pool was active, it was a defendant in only 3 of 55 total legal disputes (Figure 1) all of which concerned the same complaint: The pool had granted a more favorable license to a competitor of the Florence Machine Company, and Florence sued to get its license fee reduced; the court decided in favor of the pool.Footnote 52 Singer was a defendant in two additional cases in 1859 and 1860.Footnote 53 Both were based on the complaint that Singer had patented another firm's invention; both cases were decided in Singer's favor.Footnote 54
LITIGATION: POOL MEMBERS

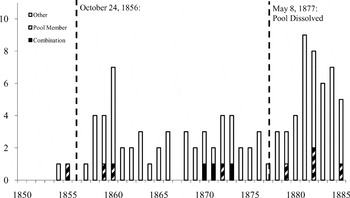
Contrary to the results for member firms, litigation data suggest that the pool increased litigation risks for outside firms. Between 1856 and 1877 the pool initiated 15 legal battles, more than a quarter of all 55 sewing machine cases.Footnote 55 Pool members acting independently initiated another nine cases. Only six of the 30 cases that involved the pool or its members were initiated by outside firms (Figure 2).Footnote 56
LITIGATION: DEFENDANTS IN SEWING MACHINE CASES

Did the Pool Encourage Its Members to Patent More?
The most central prediction of the theoretical literature is that patent pools encourage innovation by increasing expected profits for members and reducing licensing costs for other firms. To test this prediction, we examine whether patenting increased in the years leading up to the pool and continued at a higher level while the pool was active. Theoretical analyses have focused on the effects of patent pools on their members; we extend the analysis to include effects on other firms, which accounted for the majority of patents and improvements in performance.
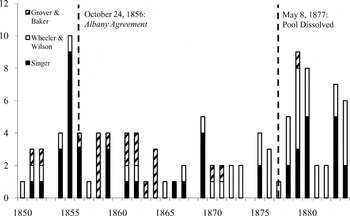
If the prospect of a pool encourages a patent race among prospective members, firms that succeed in joining the pool should have a larger number of patents in the years leading up to the pool. These predictions are borne out in the data. In 1855 members were granted a total of ten patents, compared with an average of less than three patents per year for 1850 to 1854 (Figure 3). This increase in patenting, however, is also consistent with the alternative hypothesis that prospective pool members Singer, Wheeler & Wilson, Grover & Baker, and Elias Howe patented more to protect themselves from litigation. Prospective members mayalso have patented existing innovations more aggressively to improve their bargaining positions in negotiations for the pool. Thus, nine of ten member patents in 1855 were granted to Singer, even though the company contributed no significant inventions to the pool.Footnote 57
SEWING MACHINE PATENTS: POOL MEMBERS

Pool members began to patent less as soon as the pool had been established, producing an average of three patents per year from 1857 to 1861 and only two patents per year from 1866 to 1870. Members continued to patent less until the pool dissolved in 1877, and quickly resumed patenting afterwards, producing five patents in 1878, nine in 1879, and eight in 1880.Footnote 58
Did the Pool Encourage Outside Firms to Patent More?
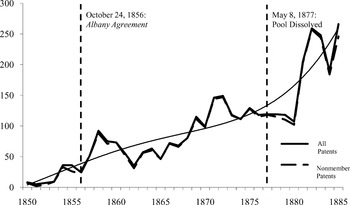
In contrast to patents by members, patents by outside firms spiked just after the pool had been established. The annual number of patents in Figure 4 jumped from 25 in 1856 to almost 100 patents in 1858.Footnote 59 If outside firms failed to enter the pool because they were slower (rather than less productive), this increase is consistent with the idea of a patent race leading up to the pool.Footnote 60 It may, however, also reflect a strategic response to an increase in litigation risks for outside firms after the pool had formed.Footnote 61
U.S. PATENTS FOR SEWING MACHINES

Patenting by outside firms began to decline only two years after the pool had formed. By 1862 the number of patents had fallen to 35 patents per year. The number increased to 149 in 1872 after the Civil War increased demand for sewing machines. After this peak, the number of patents per year declined again until the pool dissolved in 1877. By 1880, only three years after the pool dissolved, the number of patents per year began to rise again, increasing past 250 patents in 1882.
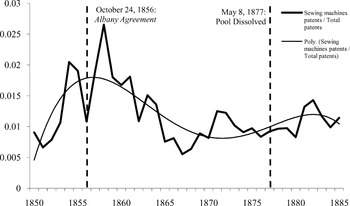
Changes in sewing machine patents as a share of all U.S. patents also indicate that the pool discouraged patenting. An initial increase to 2.7 percent of patents in 1858 eroded to 0.5 percent by 1867 in Figure 5. After the pool dissolved, the share of sewing machine patents recovered, reaching nearly 1.5 percent of all U.S. patents in 1882.
SHARE OF SEWING MACHINE PATENTS AMONG ALL U.S. PATENTS

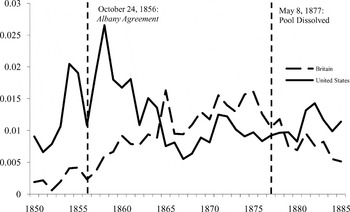
An additional test compares changes in sewing machine patents in the United States with Britain, where the sewing machine industry evolved without a patent pool. This comparison suggests that the decline in innovation during the pool was limited to the United States. British patents followed a more continuous growth path. As a share of all British patents, sewing machine patents continued to increase until the early 1870s and declined after 1874 (Figure 6). In contrast to the U.S. case, the share of sewing machine patents did not increase in Britain after the pool dissolved in 1877.
SHARE OF SEWING MACHINE PATENTS IN ALL PATENTS: UNITED STATES VERSUS BRITAIN

Difference-in-Differences Estimation
To examine the patent data more systematically, we estimate changes in the average number of patents per year by pool members relative to other firms after the pool was established and after it dissolved.

where pit measures the number of patents granted to firm i in year t. The coefficient βPMP for the interaction Pool Member * Pool is the difference-in-differences estimator; it measures the increase in annual patents by pool members relative to patents by other non-licensee firms while the pool was active compared with years before and after the pool.Footnote 62 The coefficient βLP for the interaction Licensee * Pool measures the increase in annual patents by licensees relative to other nonmember firms. We also control for Firm Age as a characteristic that may affect patenting regardless of the pool. Specifically, younger firms may patent more because they are more likely to be based on new technologies. Alternatively, older firms may patent more because they are more familiar with the patent system or because they tend to be larger and produce more, increasing the likelihood of learning-by-doing and purposeful as well as accidental innovation.Footnote 63
To account for unobservable factors that may influence patenting, we include year and firm fixed effects (δt and γi). Year fixed effects measure factors such as the dismissal of strict examiners in the early 1850s or changes in the demand for sewing machines that would have helped to increase the annual number of patents by all firms, independently of the pool.Footnote 64 Firm fixed effects control for differences in the long-run inventiveness of firms or in their propensity to patent. Separate regressions without firm fixed effects distinguish Pool Members and Licensees from other firms. The dummy variable Pool Member equals 1 for the firms Grover & Baker, Singer, and Wheeler & Wilson; the dummy variable Licensee equals 1 for any firm that bought a license from Howe or the pool.
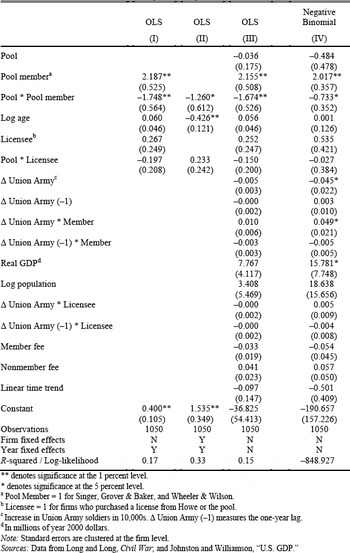
Regression results confirm that members patented less while the pool was active. Statistically significant estimates for βPMP in Table 1 indicate that pool members produced between 1.3 and 1.7 fewer patents per year while the pool was active. Across all years, members produced 2.2 more patents per year.Footnote 65 Additional regressions that estimate year-specific coefficients indicate that members generated between 0.7 and 2.3 fewer patents in the last ten years of the pool compared with the pre- and post-pool period.Footnote 66 Effects on licensees are not statistically significant. The data estimated effect of firm age is also relatively small. Firms that were 10 percent younger produced 0.04 additional patents per year (Table 1, specification II).
DEPENDENT VARIABLE IS PATENTS PER FIRM AND YEAR (1850–1885)

** denotes significance at the 1 percent level.
* denotes significance at the 5 percent level.
a Pool Member = 1 for Singer, Grover & Baker, and Wheeler & Wilson.
b Licensee = 1 for firms who purchased a license from Howe or the pool.
c Increase in Union Army soldiers in 10,000s. ▵ Union Army (–1) measures the one-year lag.
d In millions of year 2000 dollars.
Note:
Standard errors are clustered at the firm level.
Sources:
Data from Long and Long, Civil War; and Johnston and Williamson, “U.S. GDP.”
Alternative specifications, without year and firm fixed effects, control for changes in the demand for sewing machines, which varied over time but not by firm. For example, anecdotal evidence suggests that Singer and other pool members benefitted disproportionately from increases in the demand for sewing machines, with Singer selling “tens of thousands machines.”Footnote 67 To identify these effects, we estimate interaction terms between pool membership and measures for the intensity of the Civil War.Footnote 68 Linear time trends capture changes in patenting over time that may be independent of the pool.Footnote 69
Regression results from this alternative specification confirm that the pool lowered annual patents for its members. Across all years, members produced 2.2 additional patents per year compared with other firms (Table 1, specification III). In comparison, members produced 1.7 fewer patents per year while the pool was active. There are no statistically significant effects for licensees.
The results also indicate that the Civil War had relatively limited effects on sewing machine patents. For every 10,000 person increase in the size of the Union Army, the average member firm produced 0.01 additional patents per year, while nonmember firm produced 0.005 fewer patents per year (see Table 1, specification III).Footnote 70
To account for the large number of zeros in the dependent variable, we repeat the analysis as a negative binomial regression. All key results are robust to this alternative specification. The coefficient on the interaction Pool Member * Pool indicates that the pool reduced the number of member patents by 52 percent. Like OLS, negative binomial regressions yield no evidence that the pool encouraged licensees to patent more.Footnote 71
Did the Pool Encourage Innovation (Rather Than Patenting)?
Two key findings of the patent data suggest that the pool may have encouraged changes in strategic patenting rather than innovation. First, the increase in the number of member patents immediately preceding the pool suggests that prospective members may have patented existing innovations more aggressively to strengthen their bargaining position relative to other members, so that the increase in patents may reflect an increase in the share of patents per innovation, rather than a true increase in innovation.Footnote 72 Second, the spike in patenting for nonmember firms immediately after the creation of the pool may represent a strategic response by nonmembers to a heightened threat of litigation.Footnote 73
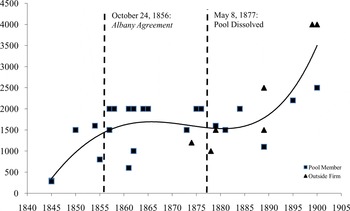
To separate changes in strategic patenting decisions from changes in innovation, we examine data on sewing speeds as an objectively quantifiable measure of performance. Data on sewing speeds in Figure 7 confirm that the pool slowed rather than encouraged rates of innovation. From 1845 until 1856 the maximum number of stitches that a lock-stitch sewing machine could perform increased from 200 to 2,000 stitches per minute. As soon as the pool had been established, innovation appears to have come to a halt, and sewing speeds stayed roughly constant for the duration of the pool. Improvements began to advance again soon after the pool dissolved in 1877. By 1889 the maximum speed of sewing had increased to 2,500 stitches per minute.Footnote 74
STITCHES PER MINUTE

Outside firms produced the fastest machines in 1889 and 1900 (Hurtu & Hautin, an outside firm, with 2,500 stitches per minute in 1889 and Willcox and Gibbs, a licensee with 4,000 stitches per minute in 1900).Footnote 75
CONCLUSIONS
Evidence from the sewing machine industry challenges theoretical predictions and regulators’ expectations that patent pools encourage innovation. In contrast to theoretical predictions, pool members began to patent less as soon as the pool had been established. For example, difference-in-difference estimates indicate that pool members patented less while the pool was active relative to the pre-and post-pool period. Similarly, sewing machine speeds barely changed while the pool was active and then rose after the pool had been dissolved.
Our article also extends the analysis of patent pools to include the effects of pools on outside firms, which account for the majority of innovations. Nineteenth-century data suggest that the sewing machine pool discouraged invention by outside firms and that it had at best statistically insignificant effects on licensees.
What are the mechanisms by which pools discourage innovation? The experience of the sewing machine suggests two main channels by which pools may discourage innovation: increases in litigation risks and changes in the direction of R&D. Increased litigation risks for outside firms lower expected profits and discourage investments in R&D. Increases in litigation may, however, also encourage outside firms to divert their research efforts away from improving key technologies that are covered by the pool towards substitutes that are still “freely” available. These changes in the rate and direction of innovation among outside firms may weaken incentives to innovate for the members of a patent pool.Footnote 76