Introduction
Related to the increasing number of older people in the world's population, worldwide dementia rates are expected to grow in an alarming speed (Kalaria et al., Reference Kalaria2008). According to the World Alzheimer Report (2015), in 2015, 46.86 million people worldwide were living with dementia, with the numbers expected to nearly double every 20 years leading to 74.7 million by the year 2030 and 131.5 million by 2050.
For most people with dementia, family members, especially spouses, assume the role of supporter or caregiver (Brodaty et al., Reference Brodaty, Green and Koschera2003). Family support is essential for maintaining patients with dementia in the community, an important goal because the majority of health care costs associated with dementia are spent on institutional care (Waldemar et al., Reference Waldemar2007). Jerrom et al. (Reference Jerrom, Mian, Rukanyake and Prothero1993) found support for a negative relationship between stress levels in relatives of people with dementia and the duration of community care, and breakdowns of community care were most strongly determined by caregivers’ stress and well-being. These findings underscore the importance of investigating stress in people living with dementia and their caregivers. Both research of the causes of stress and clinical interventions are dependent on the availability of reliable and valid measures of stress in the context of dementia (cf. Lazarus, Reference Lazarus1990).
Prior stress-related research focused on the impact of psychosocial and environmental events on physical and psychological dysfunction. Life-event scales measure stressful events, producing a cumulative stress score usually based on the number of events that occurred within a specific period of time or on the rating of the difficulty in coping with these events (Cohen et al., Reference Cohen, Kamarck and Mermelstein1983). With regard to patients with dementia and their caregivers, a key weakness of scales based on a specific list of events is the insensitivity to chronic stressors in everyday life (Cohen et al., Reference Cohen, Kamarck and Mermelstein1983), and to cognitive impairment with regard to prior events.
Following the notion of stress as a dynamic transaction between the individual and his or her environment (Lazarus and Folkman, Reference Lazarus and Folkman1984), every “objective” event and its impact is, to some degree, determined by an individual's perception of their stressfulness and his or her ability to cope with the stressor. To address this problem, Cohen et al. (Reference Cohen, Kamarck and Mermelstein1983) developed the Perceived Stress Scale (PSS). The PSS measures “the degree to which situations in one's life are appraised as stressful” (Cohen et al., Reference Cohen, Kamarck and Mermelstein1983). It is not dependent on the frequency or presence of specific stressful events but rather samples the amount to which individuals experience their lives as unpredictable, uncontrollable, and overloading. The PSS consists of only 14 items. Its brevity is an advantage particularly with regard to cognitive impairment in patients living with dementia.
The PSS has been translated into several languages, including Spanish (Remor, Reference Remor2006), Arabic (Almadi et al., Reference Almadi, Cathers, Hamdan Mansour and Chow2012), Greek (Andreou et al., Reference Andreou2011), and Japanese (Mimura and Griffiths, Reference Mimura and Griffiths2004). In addition, the PSS has also been used in several studies to investigate the level of perceived stress in caregivers to older adults with dementia (e.g. Bauer et al., Reference Bauer, Vedhara, Perks, Wilcock, Lightman and Shanks2000; Bertrand et al., Reference Bertrand, Fredman and Saczynski2006). Ezzati et al. (Reference Ezzati, Jiang, Katz, Sliwinski, Zimmermann and Lipton2014) validated the PSS in a community-based sample of non-demented elderly adults, showing that the PSS can be used to measure stress in older people.
Previous studies concerning the psychometric properties of the PSS demonstrated adequate results for the tool (e.g. Cohen et al., Reference Cohen, Kamarck and Mermelstein1983; Remor, Reference Remor2006; Andreou et al., Reference Andreou2011; Eklund et al., Reference Eklund, Bäckström and Tuvesson2014). Even though there are many studies dealing with stress in caregivers of patients with dementia, studies examining stress measured with the PSS in patients with dementia are still rare (Arsenault-Lapierre et al., Reference Arsenault-Lapierre, Whitehead, Lupien and Chertkow2012). In addition, to our knowledge, the reliability and validity of the German version of the PSS-14 has not been evaluated yet.
Thus, the aim of this study was to evaluate the 14-item PSS in a sample of patients with mild to moderate dementia and their spousal caregivers using a German version of the PSS.
Methods
The data for this study stem from the baseline assessment of the research project “Fostering autonomy through a combined training and support program in patient/caregiver DYAds in mild to moderate DEMentia (DYADEM): a randomized controlled trial” (DYADEM trial, BMBF 01ET1001A). The full study design is described in detail elsewhere (Häusler et al., Reference Häusler, Krause-Köhler, Niemann-Mirmehdi, Nordheim and Rapp2014). Briefly, the DYADEM study is a randomized controlled trial assessing the effect of a combined training and support program in patient-caregiver dyads. The aim of the intervention was to support patients with dementia and their spouses by strengthening their individual and common coping-abilities in carrying out tasks in their daily lives, thereby increasing quality of life and delaying nursing home placement.
Participants
Couples with one spouse diagnosed with dementia were consecutively recruited from memory clinics and private practices in Berlin, Germany. Inclusion criteria were a diagnosis of dementia in one spouse, residence in the community and willingness to receive a home-based intervention program. Diagnosis of dementia was made according to DSM-IV (American Psychiatric Association, 1994), and extended as specified in the all-cause criteria as provided by McKhann et al. (Reference McKhann2011). Specifically, dementia was diagnosed when cognitive or behavioral symptoms interfere with the ability to function at work or at usual activities, represent a decline from previous level of functioning, are not explained by delirium or major psychiatric disorder, cognitive impairment is detected through a combination of history taking or an objective cognitive assessment, with impairment involving a minimum of two of the following domains: impaired ability to acquire and remember new information, impaired reasoning and handling of complex tasks, impaired visuospatial abilities, impaired languages functions, changes in personality, behavior, or comportment (McKhann et al., Reference McKhann2011).
Exclusion criteria were severe dementia in the index patient as evinced by a score of less than 15 on the Mini-Mental State Examination (Folstein et al., Reference Folstein, Folstein and McHugh1975), a diagnosis of dementia in the second spouse and other psychiatric diseases, such as severe depression, psychotic disorders, and substance-related and addictive disorders in either spouse.
Of 167 dyads contacted, 80 took part in the study. Fifty-one dyads refused to participate reporting reasons such as being overburdened (n = 9), failing to accept the disease (n = 6), nursing home transmission or death (n = 7), or severe somatic diseases in one or both spouses (n = 9), as well as unstated reasons (n = 20). The presence of severe dementia led to the exclusion of 34 dyads. Two patients with dementia and their caregivers were excluded from the present analysis because they had more than six missing values on the PSS. All of the caregivers and patients were German.
Measures
Perceived Stress Scale (PSS; Cohen et al., Reference Cohen, Kamarck and Mermelstein1983). The PSS is a 14-item self-report measure that asks respondents to stipulate the degree to which situations in their lives can be appraised as stressful. Seven items of the PSS-14 are considered negative (1, 2, 3, 8, 11, 12, 14); the remaining seven are positive (4, 5, 6, 7, 9, 10, 13). Items were rated on a 5-point Likert scale (0 = never, 1 = almost never, 2 = once in a while, 3 = often, 4 = very often) with the scores of positive items reversed. Total scores were calculated by adding up all scores, with possible total scores ranging from 0 to 56. A higher score indicates a higher level of perceived stress. Originally the PSS was defined as a single structure, but several studies suggested a two-factor structure as most appropriate (Cohen and Williamson, Reference Cohen, Williamson, Spacapan and Oskamp1988; Hewitt et al., Reference Hewitt, Flett and Mosher1992; Almadi et al., Reference Almadi, Cathers, Hamdan Mansour and Chow2012). While Hewitt et al. (Reference Hewitt, Flett and Mosher1992) termed the first factor “general distress” and the second factor, which involves the reverse-keyed items “perceived ability to cope with current stressors,” more recent work has introduced the terms “negative perception” and “positive perception”. The items were translated by two authors of this article (NK and NR), following a process described in the literature as “Back-Translation” (Smith, Reference Smith and Presser2004) that consists of a four-stage procedure, including a translation of the English 14-item version of the PSS into the German language, back-translation, and two consensus steps.
Geriatric Depression Scale – Short Form (GDS-15; Sheikh and Yesavage, Reference Sheikh and Yesavage1986). The GDS-15 is a 15-item depression screening instrument that was developed from the original version of the Geriatric Depression Scale (Yesavage et al., Reference Yesavage1983). The GDS-15 uses a yes/no response format. The answer “yes” gives a positive score for ten of the questions that were asked (indication of depression); in the remaining five questions the answer “no” indicates depression. Total score ranges from 0 to 15, with a score of 5 or more indicating probable depression. McGivney et al. (Reference McGivney, Mulvihill and Taylor1994) showed that the GDS can be reliably used in patients with mild dementia (MMSE ≥ 15).
Mini-Mental State Examination (MMSE: Folstein et al., Reference Folstein, Folstein and McHugh1975). The MMSE is a standardized screening instrument for cognitive impairment. The MMSE consists of 30 items that test performance in the cognitive domains of orientation in time, orientation to place, registration, attention and calculation, recall, language and visual construction. The MMSE score is the total number of correct answers and ranges from 0 to 30.
Analysis
For the examination of the factor structure of the PSS, an exploratory factor analysis (EFA) was performed. Prior to the analysis, the suitability of the data for a factor analysis was assessed by the Kaiser-Meyer-Olkin (KMO) measure of sampling adequacy (Kaiser, Reference Kaiser1974) and Bartlett's test of sphericity (Bartlett, Reference Bartlett1954). Principal component method and oblique rotation (promax) were used to extract the factors, using Kaiser-Guttman criterion (with an eigenvalue cut-off of 1.0) and Cattell's scree test (Cattell, Reference Cattell1966) to determine the number of factors to retain. We used oblique rotation to permit correlations among factors (Fabrigar et al., Reference Fabrigar, MacCallum, Wegener and Strhan1999).
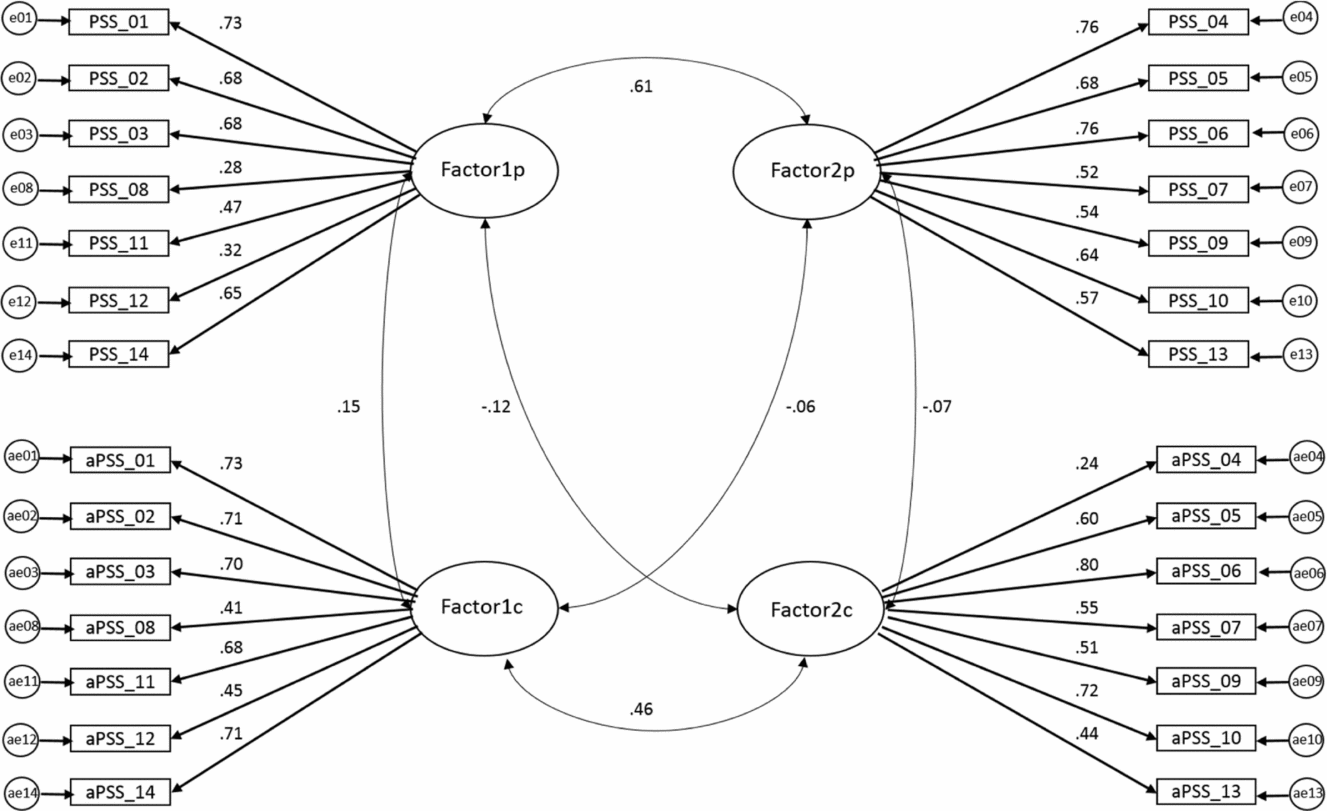
The confirmatory factor analysis (CFA) was performed additionally. CFA was used to confirm the factor structure that was identified in the EFA and to further elaborate the model. To account for non-independence between patients and caregivers, measurement models were organized as shown in Figure 1. In this model, couples became the unit of analysis. Maximum likelihood estimation and associated fit indices were used to compare the observed model with a one-factor model. Specifically, we used normed chi-square (NSC) (χ²/df), accepting values of less than 3 (Schermelleh-Engel et al., Reference Schermelleh-Engel, Moosbrugger and Müller2003), the root mean square error of approximation (RMSEA), using values of 0.05 to 0.08 indicate a good model fit (Brown and Cudeck, Reference Brown, Cudeck, Bollen and Long1992), and the normed fit (NFI) and comparative fit indices (CFI), using a value of each ≥ 0.95 as indicative of good fit (Hu and Bentler, Reference Hu and Bentler1999). Furthermore, to compare the two models, the Akaike information criterion (AIC; Akaike, Reference Akaike1987) and the Browne–Cudeck criterion (BCC; Browne and Cudeck, Reference Brown and Cudeck1989) were used. The model with lower values can be seen as more adequate, whereas the absolute AIC and BCC value is considered irrelevant.
Confirmatory factor analysis of the two-factor model of the PSS. Patient data (PSS) are shown on top left (negative perception (general distress): factor1p) and right (positive perception (perceived ability to cope with current stressors): factor2p); caregiver data (aPSS) are shown on bottom left (negative perception (general distress): factor1c) and right (positive perception (perceived ability to cope with current stressors): factor2c), e = error term, PSS = Perceived Stress Scale.

With the exception of the CFA, all analyses were conducted separately for patients and caregivers. Descriptive statistics (mean, standard deviation, and range) were calculated with the PSS and the GDS-15 scores. The reliability of the scale was evaluated using Cronbach's α (internal consistency). Evidence of the convergent validity was examined by calculating Pearson-product-correlations between the PSS score and the GDS-15 score. A positive correlation between the two scales was expected. To test if the difference between the correlation coefficients between the GDS-15 score and the two factors of the PSS were significant, Fisher's z was calculated (Uitenbroek, Reference Uitenbroek1997).
Sub-group sensitivity analysis was performed for men and women to further evaluate the validity of the PSS-14 by addressing possible gender differences in perceived stress. Independent sample t-tests were used to compare male and female participants, separated according to participant role.
All statistical analyses were performed with SPSS version 22 for Windows (SPSS Inc., Chicago, IL), except for the CFA, which was conducted using AMOS (Arbuckle, Reference Arbuckle2006). Statistical tests were two-tailed, and results were considered significant at p < 0.05.
Results
Descriptives
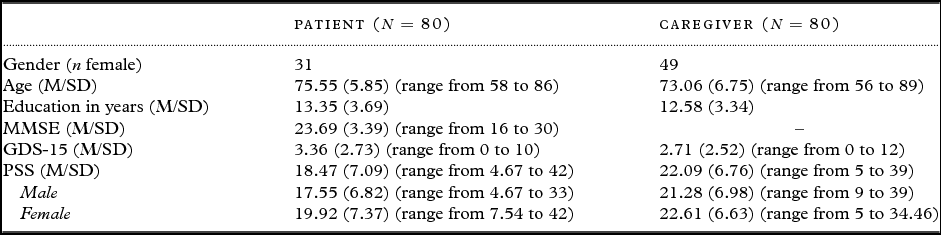
Table 1 displays the demographic characteristics as well as descriptives for the scales separately for patients and caregivers. The rather high MMSE-score reflects high education levels (nearly 13 years of education on average with 41.8 % having had higher education) and a large number of patients with a mild form of dementia. The most common diagnosis of the patients was Alzheimer's disease (78.1%). The remaining diagnoses of the patients included vascular dementia (6%), dementia in other diseases classified elsewhere (4.9%), and unspecified dementia (11%).
Characteristics of the 80 participating dyads

MMSE: Mini-Mental State Examination; GDS-15: Geriatric Depression Scale Short Form; PSS: Perceived Stress Scale; M: mean; SD: standard deviation.
PSS factorial structure
Using principal component method with oblique rotation, the KMO measure of sampling adequacy was 0.819 and Barlett's test of sphericity was 344.989 (p < 0.001) for “patients” and for “caregivers” the KMO measure of sampling adequacy was 0.725 and Bartlett's test of sphericity was 355.542 (p < 0.001), thus supporting suitability of the PSS data for factorial analysis.
Three factors with eigenvalues exceeding 1.00 were found within the patient-group, explaining 35.2%, 12.2%, and 9.5% of the variance. For the caregivers four factors with higher eigenvalues than 1.00 were found, explaining 31.8%, 15.6%, 10.7%, and 7.4% of the variance. An examination of the scree plots suggested a solution of two factors as more appropriate, accounting for 47.4% of the variance for both patients and caregivers. Oblique rotation was performed with these two factors. Factor loadings greater than 0.40 were considered for further interpretation. The rotated solution revealed that all items of negative perception (general distress) loaded higher on component 1 than on component 2 and all items of positive perception (perceived ability to cope with current stressors) loaded higher on the second factor than the first factor. Items and their factor loadings are shown in Table 2. Alpha coefficients were calculated for both factors (for the first factor, α = 0.737 and α = 0.805 and for the second factor, α = 0.821 and α = 0.748 for patients and caregivers respectively) indicating high internal consistency. The correlation between factor 1 and factor 2 was 0.350 (p < 0.001) for patients and 0.337 (p < 0.001) for caregivers, showing a moderate, significant relationship between the two factors. Table 2 shows the items and factor loadings for the two EFAs.
Comparison of the oblique rotation of the two-factor solution for patients and caregivers

Note. **p < 0.01.
Factor 1: negative perception (general distress); factor 2: positive perception (perceived ability to cope with current stressors).
Confirmatory factor analysis
All confirmatory analyses were performed using the maximum likelihood estimation method. Both the two-factor model and a one-factor model were tested. The two-factor model is presented in Figure 1.
The NSC indicated a good fit (χ²/df < 3) for the two-factor model and the one-factor model, but showed better results for the two-factor model than for the one-factor model. Examining the RMSEA, we found a value of 0.081 for the two-factor model and 0.102 for the one-factor model. NFI and CFI for the two-factor model were 0.520 and 0.737 and for the one-factor model were 0.416 and 0.579, respectively.
Comparing the two-factor solution to the one-factor solution, the likelihood ratio test revealed the latter to fit the data significantly worse than the former (see Table 3). Both NSC and the RMSEA indicated a good fit for the two-factor model, but NFI and CFI presented values that suggest that the model could be improved. AIC and BCC were lower in the two-factor model. In the two-factor model, the correlation between the factors was 0.61 and 0.46 for patients and caregivers, respectively. The standardized regression coefficients for factor 1 ranged from 0.28 to 0.73 in patients and from 0.41 to 0.73 in caregivers. For factor 2 the standardized regression coefficients ranged from 0.52 to 0.76 in patients and from 0.24 to 0.80 in caregivers.
Results of confirmatory factor analyses of model testing of PSS-14

df, degree of freedom; RMSEA, root mean squared error of approximation; NFI, normed fit index; CFI, comparative fit index; AIC, Akaike information criterion; BCC, Browne–Cudeck criterion.
Reliability and convergent validity
Factor 1 showed a reliability of α = 0.737 for patients and α = 0.805 for caregivers. Factor 2 showed a reliability of α = 0.821 for patients and α = 0.748 for caregivers. These values are consistent with the results from Cohen et al. (Reference Cohen, Kamarck and Mermelstein1983), who identified a reliability ranging between α = 0.84 and α = 0.86 for the original version of the PSS.
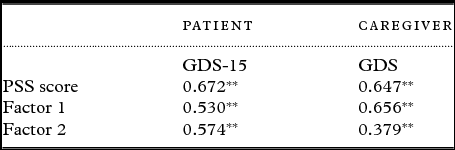
To examine the convergent validity of the PSS, the correlations between the PSS factors and the GDS-15 score were calculated, expecting a positive relationship between depressive symptomatology and the perceived stress factors (see Table 4). These results indicate that people who have higher values in depressive symptomatology also have higher perceived stress levels. In patients, the correlations between depression and the two PSS factors did not differ significantly (Bonferroni-corrected critical p = 0.0125; z = –0.44). However, there was a significant difference between the correlation of factor 1 and GDS-15 and factor 2 and GDS-15 (z = 2.67) for caregivers.
Convergent validity of PSS to GDS-15 in dementia patients and caregivers

**After Bonferroni corrections, p < 0.001.
GDS-15: Geriatric Depression Scale Short Form; PSS: Perceived Stress Scale; factor 1: negative perception (general distress); factor 2: positive perception (perceived ability to cope with current stressors).
Concordance of stress and depressive symptom ratings between spouses
To examine concordance of health status between the dyad members’ correlations for perceived stress and depression symptoms were calculated. No associations were found between patients and caregivers, neither for perceived stress (r = –0.015, p = 0.896, ns.) nor for depression symptoms (r = 0.027, p = 0.813, ns.). Also, for the two factors, there was no significant correlation found between patient and caregiver in the perceived stress scores (factor 1: r = 0.130, p = 0.249, ns. and factor 2: r = -0.120, p = 0.288, ns.).
Sensitivity of the scale to gender effects
For both patients and caregivers, the mean score for women (M = 19.92, SD = 7.37 and M = 22.61, SD = 6.63) was higher than the mean score for men (M = 17.55, SD = 6.82 and M = 21.28, SD = 6.98) but these differences did not reach statistical significance (in patients, t(78) = –1.469, ns. and in caregivers, t(78) = –0.861, ns.). There was a similar trend as well for factor 1 (negative perception) (in patients, t(78) = –1.169, ns. and in caregivers, t(78) = –0.877, ns.) and factor 2 (perceived ability to cope with current stressors) (in patients, t(78) = –1.412, ns. and in caregivers, t(78) = –0.452, ns.) with no significant difference between men and women.
Discussion
The aim of the present study was to examine the factorial structure, psychometric characteristics, convergent validity, and gender differences of the 14-item version of the PSS in a sample of dementia patients and their caregivers.
The current findings reveal that the PSS-14 is a reliable and valid instrument and can be used for the assessment of perceived stress in patients with mild to moderate dementia and patients’ caregivers.
EFA showed a two-factor solution to best represent the data. With all items of negative perception (1, 2, 3, 8, 11, 12, and 14) displaying higher factor loadings on factor one and all positive perception items (4, 5, 6, 7, 9, 10, and 13) on factor two (Table 2), this result is consistent with the Arabic version (Almadi et al., Reference Almadi, Cathers, Hamdan Mansour and Chow2012) and the Japanese version (Mimura and Griffiths, Reference Mimura and Griffiths2004) and similar to the English version (Hewitt et al., Reference Hewitt, Flett and Mosher1992), lending some evidence to the notion of a first factor representing “general stress” and a second factor representing “perceived ability to cope with current stressors” (Hewitt et al., Reference Hewitt, Flett and Mosher1992). Performing CFA with a model accounting for non-independence between patients and caregivers, the two-factor model indicated a better fit than the one-factor model for the data.
Separating the sample into patients and caregivers, internal consistency analyses showed good α coefficients close to the values that Cohen et al. (Reference Cohen, Kamarck and Mermelstein1983) identified in the original version of the PSS.
Regarding convergent validity, as expected, the correlations between the GDS-15 score and the PSS were positive for patients and caregivers alike, which indicates that higher scores in depressive symptomatology were associated with higher levels in perceived stress. This result corresponds to other studies (Ramírez and Hernández, Reference Ramírez and Hernández2007; Andreou et al., Reference Andreou2011; Ezzati et al., Reference Ezzati, Jiang, Katz, Sliwinski, Zimmermann and Lipton2014) and provides evidence for the convergent validity of the scale.
The sensitivity of the scale concerning gender differences was examined by comparing the scores of men and women. Previous literature reported different results according to gender effects. Hewitt et al. (Reference Hewitt, Flett and Mosher1992) and Remor (Reference Remor2006) found significant gender differences, with women reporting significantly higher perceived stress scores than men. Other studies (e.g. Cohen et al., Reference Cohen, Kamarck and Mermelstein1983; Ramírez and Hernández, Reference Ramírez and Hernández2007) also reported higher means in women, but the difference between men and women did not reach statistical significance. In the present study, we also found higher means for women but no statistically significant difference. However, given the small sample size for gender comparisons in the caregiver and patient sample, this result should be interpreted with caution. In addition, because of the small sample size multiple group CFA was not used to investigate whether the measurement models were the same for men and women. This approach should be considered in future studies.
We did not find a significant association between patients’ and caregivers’ depression symptoms or perceived stress. In a review of studies assessing the relationship between patient and caregiver depression, Patten (Reference Patten2014) showed that informant source influenced the concordance of symptoms: when caregivers rated patients’ depression levels, there was a significant association between their own depression symptoms and their partners’ depression symptoms. In contrast, clinician ratings of depression in caregivers and patients yielded no significant associations. In our study, the patients rated their own depression symptoms, and we may thus not have found a stronger association with caregiver's depression. Another important factor that may influence the association between depression symptoms in dyads is the severity of the symptoms. There is limited evidence that concordance is more likely when symptoms of depression are more severe in the partner with dementia (Patten, Reference Patten2014). The mean of the GDS-15 in this study was below the cut-off score of five for both patient and caregiver.
One limitation of the study is the relatively small sample size. Couples satisfying the inclusion criteria were not easily identified and less than half of the contacted couples took part in the study. Further studies should be conducted to cross-validate the measurement structure found in this sample. Additionally, we did not explore the test–retest reliability of the PSS in the current study. In their study, Cohen et al. (Reference Cohen, Kamarck and Mermelstein1983) proposed two intervals for the PSS, two days and six weeks. The time interval between the measures in the present study was six months and therefore too long to assess test–retest reliability. In future research on the German version of the PSS, test–retest reliability should be tested for shorter time intervals in order to provide information about the stability of the PSS.
In sum, we found indication that the PSS is a reliable and valid instrument that can be used to assess perceived stress in both dementia patients in mild to moderate stages of the disease and their caregivers. The observed two-factorial structure was similar to investigations on the PSS in other samples. Both the overall scale and the two sub-factors showed good internal reliability and convergent validity.
Conflict of interest
None.
Description of authors’ roles
Study concept and design was made by Deeken, Rapp and Knoll. Häusler and Nordheim were responsible for the data acquisition. Data analyses and interpretation were performed by Deeken and Rapp. Knoll and Rieckmann translated the Perceive Stress Scale into the German language. All authors contributed to and approved the final manuscript.
Key points:
-
• The PSS has high internal consistency for both dementia patients and caregivers (α = 0.83 and α = 0.82, respectively).
-
• Convergent validity for the PSS was confirmed by the positive relationship between the PSS and the GDS-15.
-
• A two-factor structure was found in an exploratory factor analysis and a better fit for this two factor structure compared to one factor was found in a confirmatory factor analysis.
-
• The PSS seems suitable to assess perceived stress in (mild to moderate) dementia patients and their caregivers.
Acknowledgments
This study was funded by German Federal Ministry of Education and Research (DYADEM trial, BMBF 01ET1001A).
Supplementary material
To view supplementary material for this article, please visit https://doi.org/10.1017/S1041610217001387