


1. INTRODUCTION
Laser based accelerators (Tajima et al., Reference Tajima and Dawson1979; Baiwen et al., Reference Baiwen, Ishiguro, Škoric, Takamaru and Sato2004; Giulietti et al., Reference Giulietti, Galimberti, Giulietti, Gizzi, Labate and Tomassini2005; Kruer, Reference Kruer1988; Shi et al., Reference Shi2007; Karmakar & Pukhov, Reference Karmakar and Pukhov2007; Liu et al., Reference Liu, Cheng, Qian, Ge, Zhang and Wang2009) and laser induced fusion (Canaud et al., Reference Canaud, Fortin, Garaude, Meyer and Philippe2004; Deutsch et al., Reference Deutsch, Furukawa, Mima, Murakami and Nishihara1996, Reference Deutsch, Bret, Firpo, Gremillet, Lefebrave and Lifschitz2008; Regan et al., Reference Regan, Bradley, Chirokikh, Craxton, Meyerhofer, Seka, Short, Simon, Town, Yaakobi, Carill and Drake1999; Hora, Reference Hora2007; Imasaki & Li, Reference Imasaki and Li2008; Hong et al., Reference Hong, He, Wen, Du, Teng, Qing, Huang, Huang, Liu, Wang, Huang, Zhu, Ding and Peng2009; Stancalie, Reference Stancalie2009) using laser-plasma interaction (Hora & Hoffmann, Reference Hora and Hoffmann2008; Borghesi et al., Reference Borghesi, Kar, Romagnani, Toncian, Antici, Audebert, Brambrink, Ceccherini, Cecchetti, Futchs, Galimberti, Gizzi, Grismayer, Lyseikina, Jung, Macchi, Mora, Osterholtz, Schiavi and Willi2007; Laska et al., Reference Laska, Jungwirth, Krasa, Krousky, Pfeifer, Rohlena, Velyhan, Ullschmied, Gammino, Torrisi, Badziak, Parys, Rosinski, Ryc and Wolowski2008; Dromey et al., Reference Dromey, Bellei, Carroll, Clarke, Green, Kar, Kneip, Markey, Nagel, Willingale, Mckenna, Neely, Najmudin, Krushelnick, Norreys and Zepf2009; Hong et al., Reference Hong, He, Wen, Du, Teng, Qing, Huang, Huang, Liu, Wang, Huang, Zhu, Ding and Peng2009; Kline et al., Reference Kline, Montgomery, Rousseaux, Baton, Tassin, Hardin, Flippo, Johnson, Shimada, Yin, Albright, Rose and Amiranoff2009; Kulagin et al., Reference Kulagin, Cherepenin, Hur, Lee and Suk2008; Malekynia et al., 2009; Nakamura et al., Reference Nakamura, Mima, Sakagami, Johzaki and Nagatomo2008; Sharma & Sharma, Reference Sharma and Sharma2009) are attracting a lot of interest. The inertial fusion program requires the anomalous absorption of laser light by the plasma, whereas the plasma-based beat-wave accelerator concept relies on the radiation induced high phase velocity electron plasma (Langmuir) waves that can accelerate electrons to extremely high energies. In the case of laser induced fusion, the efficient absorption of laser light depends on stimulated Raman scattering, and further nonlinear interaction of Langmuir wave (LW) and laser beam affects Raman scattering and hot electron generation. Similarly, in the beat wave process, the nonlinear properties of generated LW at the difference frequency can affect the particle acceleration. Therefore, in both the cases a deviation from the coherent nature of LW can affect the laser-plasma interaction significantly.
The coherence in LW may be deviated due to filamentation (Kaw et al., Reference Kaw, Schmidt and Wilcox1973; Deutsch et al., Reference Deutsch, Bret, Firpo, Gremillet, Lefebrave and Lifschitz2008) of laser beam in plasmas. The incident laser beam gets filamented on account of ponderomotive nonlinearity (Hora, Reference Hora1969), relativistic nonlinearity (Esarey et al., Reference Esarey, Ting and Sprangle1988) or by other mechanisms (Sodha et al., Reference Sodha, Ghatak and Tripathi1976). When a high power laser beam (having time scale τ = r t/c s, where rt is the initial beam width and cs is the ion sound speed), propagates through the plasma, the ponderomotive force becomes finite and leads to the redistribution of the electrons. In this region, the laser beam in under-dense plasma undergoes self-focusing, as soon as the total power P of the laser beam exceeds the critical value Pcr .required for self-focusing (Akhamanov et al., 1968). A lot of theoretical and experimental work has been reported related to beat wave excitation by two laser beams (Darrow et al., Reference Darrow, Umstadter, Katsouleas, Mori, Clayton and Joshi1986), and a significant amount of work has been done theoretically (Davies et al., Reference Davies, Fajardo, Kozlova, Mocek, Polan and Rus2009) experimentally (Tajima, Reference Tajima and Dawson1979), and numerically (Nicholas et al., Reference Nicholas and Sajjadi1986) to study the filamentation of single and two laser beams. But the stochastic acceleration of the electron has not been studied extensively in laser plasma interaction. The possible role of chaos in stochastic heating of electrons has been pointed out by Tajima et al. (2006) and Kanapathipillai (Reference Kanapathipillai2006). Mulser et al. (Reference Mulser, Kanathpillai and Hofmann2005) have studied theoretically very efficient nonlinear absorption mechanisms in clusters. Stochastic heating was evidenced by Patin et al. (Reference Patin, Lefebvre, Bourdier and Humières2006, Reference Patin, Bourdier and Lefebvre2005a, Reference Patin, Bourdier and Lefebvre2005b, Reference Patin, Bourdier and Lefebvre2007) with the help of particle-in-cell simulation in high power laser plasma interaction. Sharma et al. (Reference Sharma, Sharma and Chauhan2007) have studied stochastic heating due to the filamentation induced localization. But no attempt has been done to study stochastic acceleration in the filamentation induced turbulence in beat wave process.
Due to filamentation of the laser beam, intensity singularity is built up in a finite distance, and hence, multiple hot spots are formed. These hot spots may act as the source of further nonlinear interaction such as parametric instabilities or particle heating. These hot spots may affect the LW to the extent that the LW does not remain a plane wave and it gets highly localized in the filamentary structure of the laser beam. This localization can take place in the presence of single laser beam. But in the presence of two laser beams (as used in the beat wave process), the localization of the LW and its effects has not been studied in detail. When two filamented laser beams is beat and the LW is generated at the difference frequency, then the response of this LW will depend on the driver force of these filamented laser beams. The response of the LW to this driver force is complex and not exactly at Δk (Δk = k 1 − k 2, where k 1 and k 2 are the wave number associated with the first and second pump wave, respectively). Therefore, the generated LW at difference frequency is also expected to have a very broad spectrum. Interaction of electrons with these LW turbulent fields leads to stochastic acceleration. This is the motivation of this paper to study the beat wave process in the presence of filamentary structures of the laser beams.
In this paper, the modeling of the filamentation process of two simultaneously propagating laser beams has been done by taking into account the ponderomotive nonlinearity. LW excitation has been investigated at the beat wave frequency when the laser beams are having filamentary structures. Modeling of this LW has been done with the help of a driven oscillator. Our results demonstrate that the LW is having a turbulent spectrum. We calculated the spectral index of the complex turbulent spectrum of this LW. The mechanism of the stochastic acceleration has been presented in the presence of this Langmuir turbulence.
The organization of this paper is as follows: The formulation of the equations governing the nonlinear effective dielectric constant of the plasma and the differential equations governing the nature of the laser intensities is presented in Section 1. The effect of the cross-focusing of the laser beams on the excitation of the LW is studied in Section 2, with a discussion of the Langmuir wave turbulence. Section 3 presents the theory of stochastic acceleration in the localized Longmuir fields. A brief conclusion is summarized in Section 4.
2. CROSS FOCUSING OF LASER BEAMS
Consider the propagation of two coaxial Gaussian laser beams of frequencies ω 1 and ω 2 along the z direction. The initial intensity distributions of the beams are given by

Where r is the radial coordinate of the cylindrical coordinate system and r 1 and r 2 are the initial beam widths. The expression for the ponderomotive force in the presence of two laser beams can be written as

and the modified electron density due to ponderomotive force is (Sodha et al., Reference Sodha, Ghatak and Tripathi1976)

where  , e and m are the electric charge and mass, respectively, M is the mass of ion, k β is the Boltzmann's constant, T 0 is the equilibrium temperature of the plasma and N 0 is the electron density in the absence of the laser beams.
The effective dielectric constant of the plasma at frequencies ω1 and ω2 is given by

where the plasma frequency ωp0 is given by ωp02 = 4πN 0e 2/m.
The wave equation governing the electric vectors of the two laser beams in plasma can be written as

In writing Eq. (5), we have neglected the ∇(∇ × E) term which is justified as long as  . Assuming the variations of the electric fields to be equal to E 1,2 = A 1,2 (x,y,z)e −ik 1,2z, the wave equation becomes

A 1,2 is a complex function of space. Further, it is assumed that the variation of A 1,2 may be presented by (Akhmanov et al., Reference Akhmanov, Sukhorukov and Khokhlov1968).

where A 1,2 and S 1,2 are real functions of space. Substituting the value of A 1,2 from Eq. (7) into Eq. (6) and separating real and imaginary parts of the resulting equation the following set of equations is obtained.
The real part of Eq. (6) is

where

are the laser beam intensities, f 1,2 are the dimensionless beam width parameters for beam 1 and 2, respectively, and
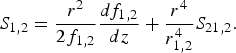
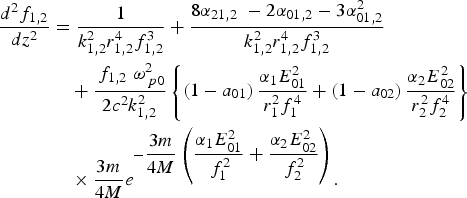
By substituting Eqs. (4), (9), and (10) into Eq. (8) and equating the coefficient of r 2 on both sides of the resulting equation, the governing equation of beam width parameters f 1,2 is:
In a similar way, by equating the coefficient of r 4 on both sides of the resulting equation, we obtained the following equations
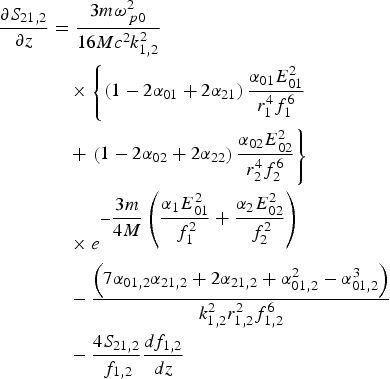
Again, the imaginary part of Eq. (6) is given by

Substituting Eqs. (9) and (10) into Eq. (13) and equating the coefficient of r 2 on both sides of the resulting equation, we obtained the equations for the coefficient α01,2

In a similar way, by equating the coefficient of r 4, the equation for the coefficient
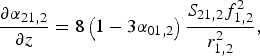
is obtained. Eq. (9) gives the intensity profile of the laser beams in the plasma along the radial direction. The intensity profile of both laser beams depends on the beam width parameters f 1,2 and the coefficients (α01,2 and α21,2) of r 2 and r 4 in the non-paraxial region. Eq. (11) determines the focusing/defocusing of the laser beams, along with the distance of propagation in the plasma. In order to have a numerical appreciation of the cross-focusing in the non-paraxial region and the effect of the changing of the parameters of the plasma and laser beams, we have performed the numerical computation of Eqs. (11), (12), (14), and (15). We have also solved the coupled equations and obtained the numerical results for typical plasma and laser beam parameters. The following set of the parameters has been used in the numerical calculation:r 1 = 15µm, r 2 = 20µm, ω1 = 1.776 × 10¹⁴ rad/S, ω2 = 1.776 × 10¹⁴ rad/S and ωpo = 0.3ω1. For an initial plane wave front of the laser beams, the initial condition used here is f 1,2 = 1, df 1,2/dz = 0, α01,2 = α21,2 = 0 and S 21,2 = 0 at z = 0.
Figures 1a and 1b show the intensity profile in the non-paraxial region observed for the first laser beam at incident first laser beam intensity α1E 102 = 0.5 and α1E 102 = 0.7, respectively. Figures 2a and 2b show the intensity profile observed for the second laser beam at the incident first laser intensity α1E 102 = 0.5 and α1E 102 = 0.7, respectively, where the intensity of the second laser beam is α2E 202 = 0.9. Figures 2a and 2b explicitly illustrates the effect of the first laser beam on the focusing/defocusing and intensity profile of the second laser beam. It is seen that the rate of focusing of second laser beam becomes slower and the intensity of laser beam also decreases with the increase of power of the first laser beam. This is due to the contribution of the first laser beam in Eq. (11), which governs the beam width profile f 2.
(Color online) Variation of the intensity (E 1 · E 1*/E 1002) of laser beam 1 with normalized distance and the radial distance at different values of laser beam 1 intensities. (a) α1E 102 = 0.5 (b) α1E 102 = 0.7.

(Color online) Variation of the intensity (E 2 · E 2*/E 1002) of laser beam 2 with normalized distance and the radial distance at different values of laser beam 1 intensities (a) α1E 102 = 0.5 (b) α1E 102 = 0.7.

3. EXCITATION OF BEAT WAVE AT DIFFERENCE FREQUENCY
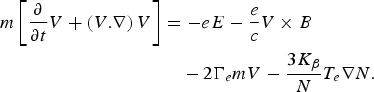
In order to observe the effect of cross-focusing of both laser beams on the LW, the excitation of the LW by the beat wave process has been studied. To study this excitation, we start with the following equations:
The continuity equation

The momentum equation
Poisson's equation

where N is the total electron density, E is the sum of electric field vectors of the electromagnetic waves and the self consistent field, V is the sum of drift velocities of the electron in the electromagnetic field and self consistent field, other symbols have their usual meanings.
Using Eqs. (16), (17), and (18), we obtain the following equation governing the LW in a hot plasma:
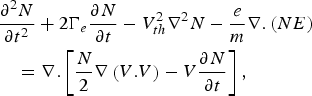
where Γe is the Landau damping factor given by Krall and Trivelpiece (Reference Krall and Trivelpiece1973), V th2 is the thermal velocity of the electron. Therefore the equation for the LW at the difference frequency (Δω = ω1 − ω2) reduces to

where N 1 is the component of electron density oscillating at frequency Δω. The drift velocities of electrons in the pump field at the frequency ω1 and ω2, V 1,2 are

Where

Eq. (20) contains two Langmuir waves (both at different frequency), the first one is supported by the hot plasma and the second by the source term at the difference frequency. The solution of Eq. (20) in the Wentzel-Kramers-Brillouin approximation can be expressed as

N 10 is a slowly varying real functions of the space coordinate. Using Eqs. (19), (20), (21), and (22), the governing equation of the ion density oscillating at the difference frequency (Δω = ω1 − ω2) can be written as

Where

To analyze the profile of the LW at the difference frequency (substituting N 1 from Eq. (22) intp Eq. (20) and using Poisson's equation), one can obtain the electric vector E (Δω) of the plasma wave excited at the difference frequency as

This is the expression for the electric vector of the excited by the two laser beams LW at the difference frequency (Δω), when the effect of cross-focusing of two laser beams and self-focusing of plasma wave is taken into account. Eq. (24) gives the behavior of the electric field of the excited LW at the plasma frequency (ωp0 = ω1 − ω2). The same set of parameters as used in Section 1 has been used for the numerical calculation. The results are presented in the form of Figures 3a and 3b and it shows that the LW is also having the splitted profile with minimum power on the axis. Figures 3a and 3b shows the effect of change in the power of the first laser beam on the power of the excited LW. The power of the LW decreases with the increase of power of the second laser beam.
(Color online) Variation of the normalized intensity (E · E*/E 1002) of Electron Plasma Wave with normalized distance and the radial distance at different values of laser beam 1 intensities (a) α1E 102 = 0.5 (b) α 1E 102 = 0.7.

As the dynamics of the LW is becoming complex, it is further diagnosed by constructing the phase portrait of this dynamical system. Figure 4 presents the phase-space plot (dE/dz, E) for the LW at the difference frequency of two laser beams and it clearly expresses the chaotic nature of the observed phase pattern.
(Color online) Phase plot (i.e. dE/dz vs E) for the electric field of the Langmuir wave.

Eq. (22) has been solved numerically by using a finite difference method, for the typical set of parameters as used in Section 1. By using the Poisson equation, we have plotted the power spectrum of the LW as shown in Figure 5. It is observed that the power spectrum is broadened. The observed spectrum is having a high fluctuation level in the electric field, as it is clearly depicted in Figure 4. This broadened spectrum of LW is at difference frequency Δω and it is on account of the driver term in Eq. (23). The driver term in Eq. (23) is contributed by the beating of two laser beams, which are localized (having a hot spot/being filamented). Therefore, the driver term is having a broadened spectrum near Δk consequently; the driven LW (as given by Eq. (23)) gives the spectral response of Langmuir turbulence, as observed here. If one studies the Langmuir turbulent spectrum, it is easily noticeable that the spectrum is having one breaking at k ~ 4.5. Although, in laser plasma interactions, this type of breaking is not observed in the study of Langmuir turbulence, but breaking is observed in the case of Alfven wave turbulence in space plasmas. Our simulation results show the breaking point in the spectrum and due to this, the whole spectrum can be divided in two regions. Both the regions are having a power dependence  where η = 11/2 for region 1 and η = 7/2 for region 2. This LW having broadened spectra can lead to the stochastic acceleration of electrons. One mechanism of stochastic acceleration is also suggested in Section 4.
(Color online) Power spectrums (|E k|2vs k) for the electric field of the Langmuir wave.

4. STOCHASTIC ACCELERATION
It is obvious from the previous discussion that the fluctuating electric fields of the LW are having a broad spectrum. From an initially Maxwellian distribution, the evolution of the velocity distribution function due to the LW's-particle interaction is modeled within the Fokker-Planck diffusive formalism where major attention is drawn to the possible shape of the diffusion operator generating energetic electron tails in velocity space. For the quasi-linear theory to be applicable, stochastic particle motion or a continuous spectrum of fluctuating fields must be present to describe the particle diffusion in the stochastic or fluctuating field regime, respectively. Our numerical results show the fluctuating chaotic electric fields in the wave number spectrum. The interaction of electrons with the localized and fluctuating fields can be described by the quasi-linear diffusion equation (Ichimaru, Reference Ichimaru1973; Fuches, Reference Fuches, Krapehev, Ram and BERS1985; Rozmus, Reference Rozmus, Sharma, Samson and Tighe1987)

where D(v) is the diffusion coefficient and f(t,v) is the velocity distribution function; the diffusion coefficient in the quasi-linear theory form is (Fuches, Reference Fuches, Krapehev, Ram and BERS1985; Rozmus, Reference Rozmus, Sharma, Samson and Tighe1987)

Where lA is the periodicity length and e is electronic charge. The value of |E k| in Eq. (26) for continuously changing k can be found from the overall shape of the Fourier spectrum of the electric field, and the approximate form  , where k max and k min are the wave numbers at the edges of the fluctuating field region, k min ≤ k ≤ k max, and η is the spectral index.
It is obvious from Figure 5 that the spectrum is having two types of scaling in the region I and region II. Let us consider the electron entering in the chaotic region from the region I with a velocity v = ωp/k max, which is almost oN the order of v th. By the stochastic process the maximum velocity of the electron will be ωp/k after passing through this region. In this way, particle gets the energy enhancement in accordance with the difference of k max and k. Further the particle enters in region II with the velocity = ωp/k and gains energy by the stochastic process until its velocity is = ωp/k min. In particular, in region I, the energy enhancement is almost two times the energy of the particle at the beginning. After passing through region II the energy of the particle is enhanced almost four times (of the energy when the particle enters this region). The distribution function f(v) can be assumed to be independent of time and reaches its constant value if the observation times t obs > t d (where t d is the characteristic time of the ponderomotive nonlinearity to set up; and this is on the order of r 0/c s; where r 0 is the transverse scale size of the electrostatic plasma wave and c s is the ion sound speed). In our simulations, this condition is very well satisfied and hence, one can obtain from Eq. (25) and Eq. (26) the distribution function. This is given by f(v) ∝ v 2−η; and this distribution function is sensitive to the spectral index η.
5. CONCLUSION
In this paper, we have studied the beat wave excitation of LW when the two laser beams are filamented. The excited LW is modeled with the help of a driven oscillator and we found that LW is having a turbulently broadened spectrum. We have also proposed the stochastic acceleration process of the electrons in the presence of this Langmuir turbulence. Typical energy gain and distribution function of the accelerated electrons (depending on the spectral index η) has also been presented. This work should find applications in the beat wave based plasma accelerators.



