Allocating valuable resources is one of the central functions of government. Understanding how politics shapes their geographic distribution has long motivated research into how those with discretion over money, programs, and projects decide where to send them. Much of this work focuses on how the alignment between the politics of a geographic area and the politics of those in charge affects who gets what. These questions, and consistent published findings of distributive particularism, cross institutions, levels of government, and subfields (for example, Berry, Burden and Howell Reference Berry, Burden and Howell2010; Dahlberg and Johansson Reference Dahlberg and Johansson2002; Kriner and Reeves Reference Kriner and Reeves2015; Reeves Reference Reeves2011). In a prominent American politics example, in what they call ‘presidential particularism’, Kriner and Reeves (Reference Kriner and Reeves2015) show that administrations steer money to the areas of ‘swing’ states and to ‘core’ states in which their supporters live.
We ask how a different set of executives, US governors, allocated a different type of resource – tax-advantaged ‘opportunity zone’ (OZ) status for economic development. We argue that this is an ideal case for expanding the study of distributive politics mechanisms in two dimensions – type of distributor and type of resource distributed – and for evaluating the links between electoral institutions and particularism. This case is substantively important and empirically advantageous. New federal policy gave all US governors one shot at designating a predetermined fraction (25 per cent) of their eligible low-income census tracts (LICs) from a transparent and exogenously determined list. Selected tracts would become more attractive for economic development. This case allows us to observe fifty political executives from both parties given similar constrained opportunities to distribute valuable resources across a well-defined set of geographies.
We assess how well ‘gubernatorial particularism’ explains distributive decisions alongside (a) policy need and (b) a more novel alternative geographic mechanism that we call ‘spreading the wealth by subunits’. The latter captures the idea that leaders may work to allocate at least some resources to each geographic unit (for example, county) such that each gets something and distributions are more proportional geographically than they are by other variables.
Analyzing thousands of decisions by fifty governors, we find considerable evidence that Republicans and Democrats spread the wealth by geography. In particular, eligible areas in counties that contained few options were disproportionately selected. The fact that Democrats do this is particularly noteworthy since it is likely to disadvantage their voters given residential patterns. We also find evidence that policy need matters. However, we find little general evidence that governors systematically prioritized ‘their’ partisan areas.
Focusing on gubernatorial particularism itself fills an important gap. Recent studies of the presidency have demonstrated the importance of incorporating executives into the distributive politics literature (for example, Kriner and Reeves Reference Kriner and Reeves2015; Larcinese, Rizzo and Testa Reference Larcinese, Rizzo and Testa2006). However, there are only a small number of presidencies to study, and numerous other executives in the US system have discretion over important resources (Nicholson-Crotty Reference Nicholson-Crotty2015). Moreover, the theoretical derivation of presidential particularism emphasizes institutions that do not vary across presidents, and that do not affect governors and other elected officials – most prominently, votes aggregated by winner-take-all subunits. Substantively, as the response to the COVID-19 pandemic has made clear, states' and governors' discretion over resources shapes critical outcomes (Michener Reference Michener2018). However, we know little about state or gubernatorial distributive politics (but see, for example, Ansolabehere and Snyder Reference Ansolabehere and Snyder2006; Nicholson-Crotty Reference Nicholson-Crotty2015).
Our empirical setting enables us to test whether fifty executives engaged in particularism as a rule, if at all. Within the broader field, this study speaks to how distributive politics depends on what politicians allocate, and who is doing the allocating. Our findings highlight the value of not only extending the literature to the states and governors, but also to other types of political resources.
Mechanisms and Measurement: Opportunity Zones
The Opportunity Zones program was added to the Republicans' 2017 tax law by Senator Tim Scott (R South Carolina), and pitched as a bipartisan way to generate investment in parts of the country that had been left behind (Tankersley Reference Tankersley2018). It was based on a prior bill with bipartisan sponsors in both chambers. The originator of the idea, and a key backer, was a bipartisan think tank, the Economic Innovation Group (EIG) that tends to focus on market-based policies (that is, access to capital). The EIG white paper outlining the idea was headlined by Jared Bernstein and Kevin Hassett (senior advisors to Presidents Biden and Trump, respectively) (Tankersley Reference Tankersley2018).
The program created a new financial instrument – ‘opportunity funds’ – which must invest 90 per cent of their assets in businesses or properties located in designated opportunity zones (OZs) to qualify for three significant tax advantages. First, capital gains taxes on other investments that are rolled into opportunity funds are deferred for up to 10 years. Secondly, the taxes owed decline the longer money is in a fund due to ‘basis step up’. Thirdly, new gains made in opportunity funds are exempt from taxation as long as the funds are held for 10 years.
We focus on the designation process. Congress empowered governors to designate (subject to certification by the Treasury) up to 25 per cent of their eligible ‘economically distressed’ tracts (poverty and income criteria plus those contiguous to them if selected) as qualified opportunity zones (QOZs). These one-shot designations would be permanent until 2026 (Lowry and Marples Reference Lowry and Marples2020). The eligible sets provided governors with considerable options, including the potential to target allies. As Appendix Figure 1 shows, every governor had ample flexibility to allocate many or all QOZs to areas they won in their last election. Moreover, ‘Treasury applied little scrutiny to the selections before approving’ (Elliott, Ernsthausen and Edwards Reference Elliott, Ernsthausen and Edwards2019), to the point that Congressional Democrats accused it of ‘not exercising meaningful oversight’ (Jagoda Reference Jagoda2020). While it is too early to evaluate the program's overall impact, especially given the pandemic economy, views on how effectively it has generated the development and distribution of benefits it promised are decidedly mixed (for example, Gose Reference Gose2020; Theodos, Jorge and Meixell Reference Theodos, Jorge and Meixell2020), and some seemingly scandalous designations have emerged (for example, Elliott, Ernsthausen and Edwards Reference Elliott, Ernsthausen and Edwards2019; Jagoda Reference Jagoda2020).
Designating QOZs shares important similarities with more familiar forms of distributive politics such as allocating grants, infrastructure projects, or disaster aid. Most importantly, QOZs were considered to be a constrained, geographically allocated, valuable resource. Despite some early concerns (and more recent developments noted above), US Conference of Mayors President Steven Benjamin cited mayors' excitement and deemed them a ‘true once-in-a-generation chance to reconnect communities with capital investment’.Footnote 1 Nearly two-thirds (60 per cent) of mayors believed OZs would have a ‘large and positive’ impact on their cities, and more than three-quarters believed that residents and small businesses would benefit (Einstein et al. Reference Einstein2020). Another similarity with other distributive cases is that many factors, technocratic and political, are likely to affect disbursement. Some roads or schools may merit improvements more than others, and some eligible tracts may offer more economic promise with fewer downsides. One key advantage of this case is the ability to approximate policy need – an attribute it shares with disaster relief (for example, Reeves Reference Reeves2011).
There are potential differences as well. One is the possibility that much of the value of OZs might accrue to outside investors – a potentially influential constituency. However, this is also true of some infrastructure projects that may largely benefit interests from outside the immediate proximity. Another potential difference is that OZs may raise concerns about local externalities (such as gentrification) and thus generate local opposition. While this is true in some cases, mayors were generally not concerned (Einstein et al. Reference Einstein2020). Moreover, other distributive resources also vary along this dimension. While unrestricted grants may always be welcome, some infrastructure projects raise similar issues. Moreover, a program meant to encourage long-term private investment through tax incentives may not present easy and immediate opportunities for economic credit claiming (Jensen and Malesky Reference Jensen and Malesky2018). Additionally, the potential for blame could be unusually constraining in this case. Decisions may be more directly attributable to the governor rather than obscured in a large bureaucracy as in presidential particularism (Kriner and Reeves Reference Kriner and Reeves2015). It is also easy to identify areas that were denied. Lastly, this program was effectively one shot (more like disaster relief than an ongoing stream of grants) and brand new. Also like disaster relief, but not necessarily other types of funding, leaders could exercise discretion within an exogenously determined set of possibilities. It is plausible that these differences shaped the behavior we document. Perhaps a one-shot program does not provide the same political benefits because it is not a signal of more to come, or perhaps governors responded to the program's novelty (with no chances to adjust later) by spreading selections around and hoping that some designations would pan out.
Data, Mechanisms, and Measurement Data
We assembled a data set of all eligible tracts using information provided by the Treasury Department, the American Community Survey (ACS) and a measure of attractiveness to capital from the Urban Institute (Theodos, Meixell and Hedman Reference Theodos, Meixell and Hedman2018).Footnote 2 This final measure (UI Investment Score) captures prior investment activity based on lending data. We merged these data with county-level gubernatorial election results for the most recent election, and with the party affiliations of the state legislators representing each tract.Footnote 3 We exclude Alaska because its gubernatorial election results are not available at the county level, and West Virginia because the governor changed parties shortly after the 2016 election. Overall, there were 30,852 LICs that could be designated as QOZs, and an additional 10,249 census tracts that were contiguous to LICs and could be designated only if a neighboring LIC was also designated. Of these contiguous tracts, only 201 were designated as QOZs, and we exclude them from our main analysis (but see Appendix Table 8). We use counties to measure geographic disbursement and particularism for several reasons beyond data availability. For example, they are the highest level of geographic aggregation in states, and the most salient subunit in many. Additionally, some governors explicitly included counties in their plans (see below). Finally, counties make it relatively easy for governors who are so inclined to designate near their voters. The majority of counties (unlike smaller units) had at least one eligible tract, and governors likely know (with ease) which counties include large numbers of supporters.
We test three types of mechanisms. The first is political alignment. Specifically, we focus on ‘core’ targeting. The literature is split on whether leaders direct resources to areas in which their supporters live or areas represented by political allies (for example, Berry, Burden and Howell Reference Berry, Burden and Howell2010; Dynes and Huber Reference Dynes and Huber2015; Kriner and Reeves Reference Kriner and Reeves2015; Larcinese, Rizzo and Testa Reference Larcinese, Rizzo and Testa2006). We test whether governors target (1) their supporters in the electorate using county-level governor vote share or (2) areas represented by their elected allies using the partisan match between the governor and local representatives. The general tenor of the literature leads to a strong expectation that we should find effects. However, the leading theory of presidential particularism (Kriner and Reeves Reference Kriner and Reeves2015) provides reasons (for example, no Electoral College) that we may not find them among governors. Some posit that politicians target ‘swing’ areas (for example, Kriner and Reeves Reference Kriner and Reeves2015). Because governors do not face an equivalent of swing states, we do not feature this prediction (but see Appendix Table 7).
The second mechanism is policy fit. Even allowing for specific scandalous selections, governors may, in general, target based on economic conditions (for example, Theodos, Meixell and Hedman Reference Theodos, Meixell and Hedman2018). A finding that policy need shaped decisions would join Reeves (for example, 2011) as a notable instance in which need was measurable and correlated with outcomes. One possibility is that the neediest tracts were prioritized. An alternative is that areas that were already doing relatively well, and that may have been the most attractive to investors, were. For the former we test for a relationship with tract-level poverty rates and median income. For the latter, places that were already attractive to investment using ‘UI Investment Score’.
The third mechanism is spreading the wealth geographically. Here, leaders may tend to make sure that each area gets something, such that the distribution is more proportionate geographically than it is by population or other traits. Closely related, they may make sure that no areas get what appears to be ‘too much’. While there is considerable theoretical and empirical work on the first two mechanisms, this one is more novel. We derive it from a combination of stylized facts and broader themes in the literature about population density and power. The motivating stylized observations include the fact that some states (for example, Washington, Massachusetts, North Carolina) explicitly mentioned county minimums or highlighted county allocations (see the Appendix for details), and survey data that mayors perceived ‘a desire to spread’ zones to be an important influence on their governors (Einstein et al. Reference Einstein2020). In the broader literature, Rodden (Reference Rodden2019) argues that city interests are consistently under-represented relative to their size and economic power (see also, for example, Payson Reference Payson2020; Weir, Wolman and Swanstrom Reference Weir, Wolman and Swanstrom2005), yet rural residents believe cities get favorable treatment (Cramer Walsh Reference Cramer Walsh2012). More generally, leaders may believe that places that are already receiving resources may not notice the marginal ones they are not getting, but that giving some places nothing would be conspicuous and violate a particular conception of fairness. They may also believe that geographic dispersion has more policy benefits, or they may be responding to a more nebulous tendency to value even arbitrary geographic designations. For all of these reasons, governors may disproportionately distribute resources to places in which they have fewer opportunities to distribute them. We test for this using the variable 1/# of LICs in the County, which is at its maximum if a county only has one LIC. This variable represents the probability that a LIC in the county would be chosen if the governor were to randomly select one LIC in each county (below and in the Appendix we discuss robustness to other measures).
Results
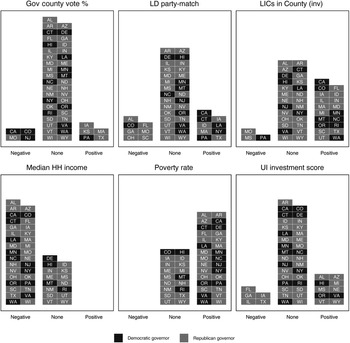
We begin our analysis with simple t-tests comparing the levels of the variables of interest in the LICs that were and were not designated in each state. These bivariate tests provide an easy way to visualize the prevalence of associations, or lack thereof, across fifty different sets of decisions while providing full transparency (Lenz and Sahn Reference Lenz and Sahn2020). For each variable in each state, Figure 1 reports whether the difference between selected QOZs and non-selected eligible tracts is positive and statistically significant, negative and statistically significant, or not significantly different (see Appendix Table 2 for the underlying differences by state).
T-tests comparing variables of interest between QOZs and eligible non-QOZs
Gov county vote %, LD party-match, LICs in County (inv), Median HH income, Poverty rate, UI investment score, Democratic governor, Republican governor
Note: ‘Negative’(‘Positive’) corresponds to a negative (positive) significant difference between QOZs and non-selected LICs. ‘None’ indicates no significant difference. Full results available in Appendix Table 2.

This analysis yields no evidence of systematic political particularism. Only five governors appear to favor tracts in counties that supported them – four go the other way. Similarly, governors in nine states appear to favor co-partisan state legislators, while those in seven states disproportionately selected tracts in areas represented by the other party. For both voter match and legislator match mechanisms, by far the most common outcome was no political differences between selected and non-selected tracts.
We find considerable support for the spreading the wealth and policy need hypotheses. Governors in nine states placed a QOZ in every county with at least one LIC, and 80 per cent of eligible counties received a QOZFootnote 4. Nineteen governors designated a higher proportion of tracts in counties with fewer eligible options to choose from. Only three did the opposite. Substantial majorities of governors favored tracts with lower median household incomes and higher poverty levels (even within a universe of economically distressed places). Regarding attractiveness to investors, 10 governors favored qualified tracts with higher prior capital flows, while five favored those with fewer. There was no relationship in the vast majority of cases. We can think of a few explanations for this limited, if anything, relationship regarding attractiveness to investors. They range from relatively well-off tracts being not attractive enough to justify prioritizing investor interests, to governors responding to investors whose priority tracts were idiosyncratic (Elliott, Ernsthausen and Edwards Reference Elliott, Ernsthausen and Edwards2019), to governors earnestly avoiding places with more prior economic activity.
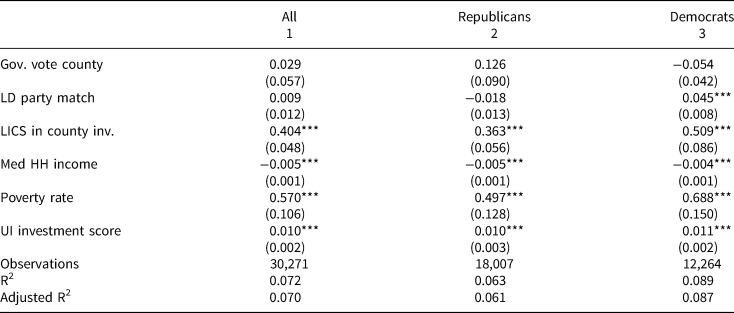
The bivariate analysis provides considerable support for both the policy need and spreading the wealth hypotheses. However, it also shows that even these mechanisms only play out in roughly two-thirds and two-fifths of states, respectively. We now turn to ordinary least squares (OLS) models (Table 1) pooling (a) all states and (b) states by governor party to test the mechanisms alongside each other and with controls.
OLS regression results

Note: Models include state fixed effects. Standard errors clustered by state. * p < 0.05; ** p < 0.01; *** p < 0.001
These models corroborate the bivariate plots. They provide strong support in the aggregate for both spreading the wealth by geographic subunits and policy need. They do so when pooling all governors, as well as across party lines. Democrats, whose voters are more concentrated in denser areas, still disproportionately distribute resources to smaller counties with fewer LICs. The spreading the wealth finding is especially noteworthy because it has not been the focus of other distributive politics work. Since it speaks to broader questions about the primacy of (potentially) arbitrary geographic units it has implications for various forms of equity. These effects are robust to alternative operationalizations. In the Appendix, we report models that use the log of the LICs variable and a dichotomous version (three or fewer LICs in the county).
Additional analysis suggests that most of the spreading the wealth concerns counties with very few eligible tracts, and that it is not simply a reflection of an urban/rural divide. Tracts in census-defined metro areas were selected at a 23.5 per cent rate compared to the 25 per cent base rate. Tracts in counties that had three or fewer eligible ones were selected 38 per cent of the time. Tracts in the largest 5 per cent of counties (averaging 112 eligible LICs) were selected 22 per cent of the time. (Appendix Table 10 includes urban/rural classification codes). Governors tended to make sure each county got at least one selection, but did not dramatically keep them away (proportionately) from large counties. As an additional test, we conducted a simulation in which we randomly selected 25 per cent of the eligible LICs in each iteration and counted the unique number of counties with at least one selected. Across 10,000 draws, the average number of unique counties was 891, and the maximum was 968. In actuality, 2,036 unique counties received a QOZ.
The models provide no evidence that governors disproportionately targeted supporters' areas. Governor vote share is not significant in any of the three pooled models, and is not even consistently signed. The LD party match variable is significant in the model for Democrats only, though it is also inconsistently signed across models, and there was no strong theoretical reason to only expect an effect using that measure of particularism for that political party. Additional models in the Appendix further support this null finding. Appendix Table 3 includes different measures of the spreading the wealth variable, and models with and without the two biggest states (Texas and California). It consistently shows no aggregate political effects. Appendix Table 4 shows political effects in some specifications for Republican governors. It also shows that what significant results exist are largely driven by Texas. Appendix Table 5 shows political effects in some specifications for Democratic governors. Critically, the results are unstable: some models show vote share effects, some exhibit legislator match effects and some show neither. Moreover, the coefficient signs, irrespective of significance, are inconsistent. Appendix Table 6 estimates Model 1 from Table 1 separately for each state. It shows very few positive and significant estimates for governor vote share or LD match when controlling for the other variables of interest, and it shows a few going in the other direction.
In sum, the t-tests strongly contradict political particularism, and modeling does not support a different conclusion. The signs are inconsistent, and any such effects one could claim are sensitive to which controls are included and to their operationalization. It is likely that a small number of governors disproportionately allocated resources to their supporters' areas. It is also very unlikely that governors consistently did so. For example, Appendix Table 6 demonstrates a large positive effect of the governor's county vote in Texas, Georgia and Washington, and negative effects in Idaho, Illinois and New Jersey. These models highlight the benefits of having fifty analogous sets of decisions. None of this means that politics do not matter. Indeed, the most defensible conclusion may be that governors believed that spreading benefits around or conforming to particular notions of fairness was more politically advantageous than particularistic targeting.
Conclusion
Our analysis of OZ allocations shows that governors generally focused on spreading them around while also taking policy need into account. Analyzing fifty sets of decisions, we show that these are common tendencies, but far from universal laws. Just as significant is what we do not find: generalized gubernatorial particularism.
We believe these results demonstrate the need for additional research in at least two areas. The first concerns the role of geographic ‘fairness’ mechanisms and subunits in distributive politics. We find that both Democratic and Republican governors engage in spreading resources around despite the relative concentration of Democratic voters in a smaller number of counties. Executives of both parties may view achieving some level of subunit fairness as politically valuable when making decisions. This captures an additional potential force that is adverse to denser, more populous (and frequently more diverse) areas. The Electoral College and the Senate provide clear reasons to expect state-level targeting and relative geographic uniformity in federal policy. The lack of an Electoral College may help explain why we do not observe particularism in this case (but see particularism in other systems, for example, Dahlberg and Johansson Reference Dahlberg and Johansson2002). However, it cannot speak to why we see the primacy of subunits in a one-person-one-vote context. Why we see this, whether it really speaks to counties as political subunits or as a simple proxy for geography, and how spreading the wealth manifests at other levels of government are all important questions. Finally, we note an interesting additional implication. To the extent that studying governors can speak to how presidents might behave in a hypothetical world without the Electoral College, this case suggests that established subunits, and literally spreading things around, are powerful forces such that small states would not be left behind, as some argue.
It is also possible, and perhaps likely, that it is the nuances of the OZ resource that engendered geographic spreading and suppressed particularistic targeting. The second area for future research is thus how variations in the resource being distributed affect distributive politics. In this case, perhaps the resource was too intangible, worked on too long a time horizon, or provided benefits that are too diffuse. Or perhaps the uncertainty of a brand new one-shot program that relied on an indirect mechanism shaped the decisions. Yet another possibility on the political side is that the outside stakeholders were relatively influential compared to the voters, or that the nature of this program created strong asymmetries in which giving some places nothing would be especially conspicuous compared to the benefits of giving larger places a full share.
Irrespective of the exact reasons, our findings highlight, across decision makers and cases, variation in particularism and other distributive tactics. Other work shows that particularism frequently appeals to elected officials and that vote aggregation institutions shape how it manifests. Our work shows that restraints on particularism, and prods toward other distributive priorities, sometimes predominate. We believe a natural next step would be more studies of the same resources that the federal executive branch distributes (such as disaster declarations and grants) in states and cities. This and other attention to the sources of variation in resource distribution may help us understand what constrains naked partisanship, what makes some decisions responsive to actual policy need, and which conceptions of fairness, or perceptions of political interest, shape distributive decisions. They may also help further unpack the power that political boundaries and subunits have, even when we do not use them to aggregate votes, and even how these forces layer onto big questions about the urban–rural divide and basic access to resources and attention.
Supplementary material
Online appendices are available at https://doi.org/10.1017/S0007123421000272.
Data availability statement
Replication data for this letter can be found in Harvard Davaverse at: https://doi.org/10.7910/DVN/MY3GI1
Acknowledgements
We thank Julia Payson, Mark Rom, Doug Kriner, Andrew Reeves, Josh McCrain, and Nate Jensen for helpful comments and critiques, and Alex Fouirnaies for sharing data on state legislators.