Introduction
In the year 2016, non-communicable diseases (NCDs) accounted for 39.5 million of the global 54.7 million deaths (GBD, 2017). The morbidity burden of NCDs has been rising fast, particularly over the past 25 years – an increase of 14.4 percentage points from 57.9% in 1990 to 72.3% in 2016. Furthermore, cardiovascular disease accounted for one-third of these NCD deaths (GBD, 2017). In the year 2010, cardiovascular and circulatory diseases together caused about 11.8% of the total DALYs (disability-adjusted life years) globally (Murray et al., Reference Murray, Vos, Lozano, Naghavi, Flaxman and Michaud2012). Over 80% of global deaths due to NCDs occurred in low- and middle-income countries (LMICs), with India’s share being 9.8 million deaths (WHO, 2017). Similar to global trends, in India, the number of deaths due to NCDs rose from 3.4 million in 1990 to 6.1 million in 2016 (nearly 61.8% of all deaths); these were primarily attributable to cardiovascular diseases (28.1%), chronic respiratory diseases (10.9%) and diabetes (3.1%) (IHME, 2016). Recent estimates by the Registrar General of India (2015) revealed that NCDs accounted for over 45% of all deaths across all age groups in India in 2004–06 (Registrar General of India, 2015). The same report also noted that while cardiovascular diseases topped the list with the highest share of deaths (27.8%), respiratory diseases emerged as the fourth leading cause of death (8.6%) at ages 30–69 years. Prabhakaran et al. (Reference Prabhakaran, Jeemon, Sharma, Roth, Johnson and Harikrishnan2018) observed a rise in the crude prevalence rate for ischaemic heart disease and a fall for rheumatic heart disease during 1990 to 2016 the country. However, the prevalence rate for asthma did not show any change over the same period (Salvi et al., Reference Salvi, Kumar, Dhaliwal, Katherine, Agrawal and Koul2018).
The social determinants of health are key to a healthy life (WHO, 2003, 2017). Between 1990 and 2015, global exposure to unsafe sanitation, household air pollution, childhood underweight, childhood stunting and smoking has decreased by more than 25%. However, the exposure for several occupational risks has increased by more than 25% over the same period (GBD, 2016). Socioeconomic and demographic factors have been shown to be significantly associated with an increased risk of NCDs (Gupta et al., Reference Gupta, Gupta, Sarna, Rastogi, Gupta and Kothari2003; Zachariah et al., Reference Zachariah, Thankappan, Alex, Sarma and Vasan2003; Ahmed et al., Reference Ahmed, Hadi, Razzaque, Ashraf and Juvekar2009; Kinra et al., Reference Kinra, Bowen, Lyngdoh, Prabhakaran, Reddy and Ramakrishnan2010; Agardh et al., Reference Agardh, Allebeck, Hallqvist, Moradi and Sidorchuk2011; Corsi & Subramanian, Reference Corsi and Subramanian2012; Hosseinpoor et al., Reference Hosseinpoor, Bergen, Mendis, Harper, Verdes and Kunst2012; Kar et al., Reference Kar, Narayanan, Ramalingam, Naik and Sujiv2015; Chowdhury et al., Reference Chowdhury, Uddin, Haque and Ibrahimou2016; Kumar & Ram, Reference Kumar and Ram2017; Yin et al., Reference Yin, Wu, Cui, Hao, Liu and Li2017). Previous research has documented occupation as one of the most important determinants of several NCDs, including high blood pressure, diabetes, asthma and heart disease, primarily as engagement in occupations with exposure to harmful substances may be more than for workers in other occupations. For example, higher systolic blood pressure has been shown to be more common among blue-collar workers (Tenkanen et al., Reference Tenkanen, Sjoblom, Kalimo, Alikoski and Harma1997; Undhad et al., Reference Undhad, Bharodiya and Sonani2011; Gupta et al., Reference Gupta, Deedwania, Sharma, Gupta, Guptha and Achari2012), civil servants (Bunker et al., Reference Bunker, Ukoli, Nwankwo, Omene, Currier and Holifield-Kennedy1992), information technology and service workers (Babu et al., Reference Babu, Mahapatra and Detels2013) and tea-garden workers (Hazarika et al., Reference Hazarika, Biswas, Narain, Kalita and Mahanta2002). In contrast, the prevalence of hypertension has been found to be lower among middle socioeconomic categories engaged in occupations involving manual and non-manual work compared with low and high socioeconomic categories (Gupta et al., Reference Gupta, Deedwania, Sharma, Gupta, Guptha and Achari2012) and occupations involving moderate or high physical activity (Zachariah et al., Reference Zachariah, Thankappan, Alex, Sarma and Vasan2003).
The risk of diabetes has been observed to be higher among adults working in unskilled and semi-skilled manual occupations (Heden et al., Reference Heden, Novak, Hansson, Lappas, Wilhelmsen and Rosengren2014), among professionals and senior clerical staff (Gupta et al., Reference Gupta, Deedwania, Sharma, Gupta, Guptha and Achari2012) and farmers (Cox et al., Reference Cox, Niskar, Narayan and Marcus2007; Juntarawijit & Juntarawijit, Reference Juntarawijit and Juntarawijit2018) and in occupations with longer sitting times (Uffelen et al., Reference Uffelen, Wong, Chau, Ploeg, Riphagen and Gilson2010). An increased risk of asthma has also been observed in: adult workers with high exposure to wood dust, welding fumes or hairdressing chemicals (Jeebhay & Quirce, Reference Jeebhay and Quirce2007); farmers, painters, spray painters, plastic workers and cleaners (Kogevinas et al., Reference Kogevinas, Anto, Sunyer, Tobias, Kromhout and Burney1999); agriculture and fishery workers and craft-related trade workers (Abrahamsen et al., Reference Abrahamsen, Fell, Svendsen, Andersson, Toren and Henneberger2017); plant machine operators and assemblers, mining constructors, those in the manufacturing sector and transport workers (Agrawal et al., Reference Agrawal, Pearce, Millett, Subramanian and Ebrahim2014); and workers in health care and ancillary occupations (Mirabelli et al., Reference Mirabelli, Zock, Plana, Anto, Benke and Blanc2007; Delclos et al., Reference Delclos, Gimeno, Arif, Burau, Carson and Lusk2007; Arif et al., Reference Arif, Delclos and Serra2009; Liss et al., Reference Liss, Buyantseva, Luce, Ribeiro, Manno and Tarlo2011; Vizcaya et al., Reference Vizcaya, Mirabelli, Anto, Orriols, Burgos and Arjona2011; Lillienberg et al., Reference Lillienberg, Andersson, Janson, Dahlman-Hoglund, Forsberg and Holm2013; Kim et al., Reference Kim, Toren, Lohman, Ekerljung, Lotvall and Lundback2013). Occupations dominated by standing work (Hayashi et al., Reference Hayashi, Iso, Cui and Tamakoshi2016; Smith et al., Reference Smith, Ma, Glazier, Gilbert-Ouimet and Mustard2018) and those requiring long working hours and sedentary behaviours (Virtanen et al., Reference Virtanen, Heikkila, Jokela, Ferrie, Batty and Vahtera2012; Lee et al., Reference Lee, Hong, Min, Kim, Kim and Kang2016; Ma et al., Reference Ma, Wang, Chen, Shi, Wang and Khurwolah2017; Lim et al., Reference Lim, Park, Kong, Sim, Kim and Kim2017) are associated with an increased risk of heart disease. Agricultural workers have a lower risk of cardiovascular diseases than technician and managers (Davis-Lameloise et al., Reference Davis-Lameloise, Philpot, Janus, Versace, Laatikainen and Vartiainen2013).
Only a handful of studies (Gupta et al., Reference Gupta, Al-Odat and Gupta1996; Hazarika et al., Reference Hazarika, Biswas, Narain, Kalita and Mahanta2002; Gupta et al., Reference Gupta, Gupta, Sarna, Rastogi, Gupta and Kothari2003; Zachariah et al., Reference Zachariah, Thankappan, Alex, Sarma and Vasan2003; Agnihotram & Chattopadhyay, Reference Agnihotram and Chattopadhyay2004; Mohan et al., Reference Mohan, Mathur, Deepa, Deepa, Shukla and Menon2008; Kinra et al., Reference Kinra, Bowen, Lyngdoh, Prabhakaran, Reddy and Ramakrishnan2010; Undhad et al., Reference Undhad, Bharodiya and Sonani2011; Corsi & Subramanian, Reference Corsi and Subramanian2012; Gupta et al., Reference Gupta, Deedwania, Sharma, Gupta, Guptha and Achari2012; Babu et al., Reference Babu, Mahapatra and Detels2013; Agrawal et al., Reference Agrawal, Pearce, Millett, Subramanian and Ebrahim2014; Kar et al., Reference Kar, Narayanan, Ramalingam, Naik and Sujiv2015; Kumar & Ram, Reference Kumar and Ram2017; Prabhakaran et al., Reference Prabhakaran, Jeemon, Sharma, Roth, Johnson and Harikrishnan2018; Salvi et al., Reference Salvi, Kumar, Dhaliwal, Katherine, Agrawal and Koul2018) have addressed the factors associated with the prevalence of NCDs in India. Even so, the available studies have typically been limited to small areas. India has committed to the recently declared Sustainable Development Goals (SDGs), which emphasize reducing premature deaths due to NCDs over the next 15 years (SDG target 3.4) (United Nations, 2015) and assuring universal health coverage, endorsing the WHO call for a 25% reduction in adult deaths due to NCDs between 2008 and 2025 (WHO, 2013; Norheim et al., Reference Norheim, Jha, Admasu, Godal, Hum and Kruk2015). It is thus important for India to have a baseline understanding of the key predictors of NCDs if the nation wants to achieve these SDGs.
The present study thus is a modest attempt to explore the socioeconomic and demographic factors associated with four selected NCDs (high blood pressure, diabetes, asthma and heart disease) among adults engaged in various types of occupations. The study had three specific objectives. First, to examine levels and changes in the prevalence of these four NCDs by socioeconomic and demographic attributes; second, to examine the association of socioeconomic and demographic characteristics with each selected disease for people engaged in different types of occupations; and third, to identify the socioeconomic and demographic predictors of these NCDs.
Methods
Data
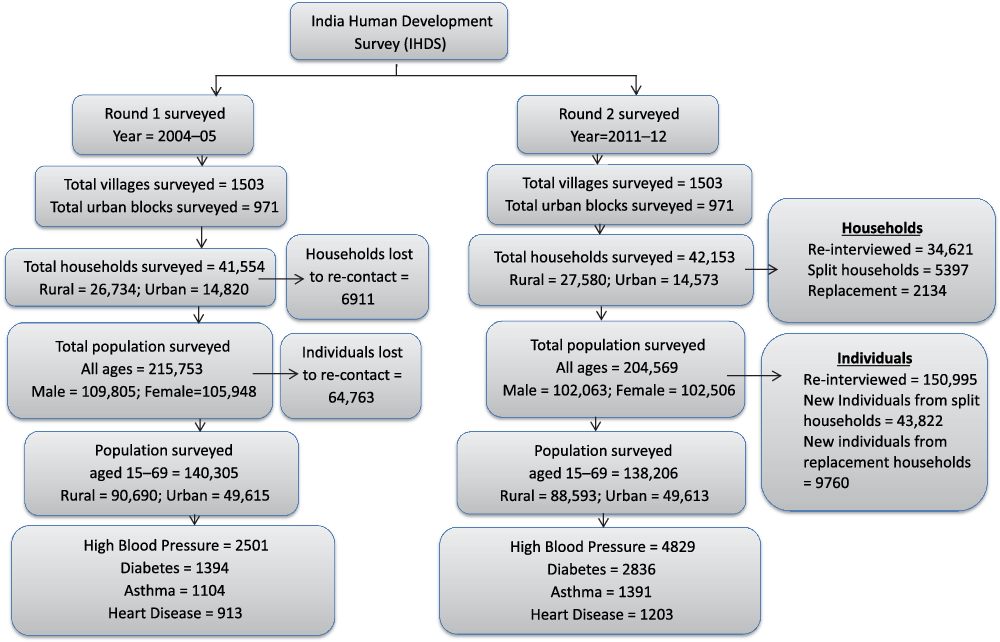
The study used data from the India Human Development Survey (IHDS), a nationally representative longitudinal survey conducted at the two time points 2004–05 (Desai et al., Reference Desai and Vanneman2010) and 2011–12 (Desai et al., Reference Desai and Vanneman2015). The IHDS Round 1 (2004–05) and IHDS Round 2 (2011–12) surveyed a total of 41,554 and 42,153 households, respectively, from urban and rural areas from all the states and union territories (UTs) of India, with the exception of the UTs of Andaman/Nicobar and Lakshadweep.
Survey design
The IHDS is a nationally representative sample survey of households where the first sampling unit is the village in rural areas and Census Enumeration Blocks (CEBs) in urban areas. The surveys follow a two-stage stratified random sampling design. The selection of the urban sample in IHDS 2004–05 was done by first listing all urban areas in a state by their population size. Then, a number of blocks/wards were selected from each urban area based on probability proportional to size (PPS). A complete house listing was drawn up in the selected blocks and a sample of fifteen households was selected randomly from each block. For the rural sample, while half of the households interviewed in the 1993–94 Human Development Profile of India (HDPI) were included, the other half were drawn from districts surveyed in the 1993–94 HDPI, along with the remaining districts located in the states/UTs not covered in that survey. Similar to the IHDS 2004–05, the IHDS 2011–12 was also a nationally representative survey covering households in villages and urban areas of India across its states and union territories. The IHDS 2011–12 primarily re-interviewed households originally interviewed in IHDS 2004–05. In cases where the households surveyed in IHDS 2004–05 subsequently split into two or more households, all the split households were re-interviewed if they were located in the same village/urban areas. Furthermore, in a few cases where households could not be re-contacted, additional new households were randomly sampled and interviewed. Further details of the IHDS 2004–05 and IHDS 2011–12 can be found in Desai et al. (Reference Desai, Dubey, Joshi, Sen, Shariff and Vanneman2009) and Desai and Vanneman (Reference Desai and Vanneman2018), respectively.
The IHDS collected information on health, employment, education, economic status and so on, and canvassed separate questionnaires at the community, household and individual levels. The information on household socioeconomic conditions was obtained from the household head. The household data file also included data on household businesses, and wage and salary work-related occupation for each household member. The individuals data file contained information on major morbidities, age, sex, education, marital status and sex, among other factors. These two data files were merged for the present analysis.
The IHDS included fourteen major morbidities, namely cataracts, tuberculosis, high blood pressure, heart disease, diabetes, leprosy, cancer, asthma, polio, paralysis, epilepsy, mental illness, sexually transmitted diseases (STDs)/AIDS and other long-term diseases. The respondents of the household questionnaire were asked to report about the morbidity status of each household member. The question asked was: ‘Has any member of the household ever been diagnosed as having [name of NCD] by a doctor?’ The question was repeated for each NCD, one at a time. However, analysis was carried out for four NCDs only, mainly due to number of cases (for details, see Fig. 1). The selected morbidities were: high blood pressure, diabetes, asthma and heart disease. Furthermore, the analysis was restricted to individuals aged 15–69 years as: 1) the cases of disease at ages 15–69 account for the majority of all cases of the four selected NCDs (around 81% in both rounds); 2) the predictors of morbidity among children, as well as at older ages, may be different from those at ages 15–69 years (WHO, 2009, 2019); and 3) adult health in India has received less attention in past research.
Description of the procedure for the analysis of the two rounds of IHDS data.

Variables
The dependent variable was number of people diagnosed with each NCD in each of the two surveys. The response was coded as ‘0’ for no (not diagnosed with NCD), ‘1’ for yes (diagnosed with the NCD) and ‘2’ for cured (diagnosed with NCD and cured). This variable was dichotomized, with ‘0’ for no response and ‘1’ for yes (diagnosed with and/or NCD cured). For household member’s occupation, the question asked was: ‘Besides the work on household and household business what work did [household member’s name] do last year for payment in cash or kind?’ Using the revised 2004 National Classification of Occupations (Government of India, 2004), the occupation of the household members was classified into five categories: non-workers (reference), legislators/senior officials/professionals, skilled agricultural/elementary workers, craft/machine-related trade workers and ‘other’ workers.
Place of residence was classified as rural (reference) and urban. Caste of the household head was classified into three categories: Scheduled Caste (SC)/Scheduled Tribe (ST) (reference), Other Backward Classes (OBC) and non-SC/ST/OBC. Religion of the household head was classified in the three categories of Hindu (reference), Muslim and non-Hindu/Muslim. Household economic status (wealth) was measured by the Monthly Per Capita Expenditure (MPCE) of the household with a reference period of 30 days and was classified into five quintiles: poorest (reference), poor, middle, rich and richest. Sex was classified as male (reference) and female. Years of schooling completed was classified into five categories: not educated (reference), completed 5 or fewer years of schooling (1–5 years), completed 6–8 years of schooling, completed 9–12 years of schooling and completed more than 12 years of schooling. The age of the household member was classified into four categories: 15–29 years (reference), 30–44 years, 45–59 years and 60–69 years.
Analysis
The prevalence rate of each NCD was defined as the number of person(s) ever diagnosed with the NCD per 1000 population at ages 15–69 years. The group comparisons were performed using bivariate methods to examine the statistical significance of differences across socioeconomic and demographic subgroups for each NCD separately. Multiple linear logistic regression analysis was conducted to identify socioeconomic and demographic predictors of the NCD. Similar to previous studies (Clayton, Reference Clayton1991; Friedenreich, Reference Friedenreich1993; Cameron & Trivedi, Reference Cameron and Trivedi2005), odds ratios were estimated on pooled data of IHDS Rounds 1 and 2 with a dummy variable included for time of survey to examine the effect of time on the dependent variable. The odds ratios were estimated using two models: Model 1 adjusted for age only and Model 2 adjusted for all other socioeconomic and demographic variables included in the analysis, besides age. National weights were applied to restore representativeness. All analysis was conducted in Stata 13 statistical software packages (Stata Corp, 2013).
Results
Prevalence rates of the four NCDs in the Indian population
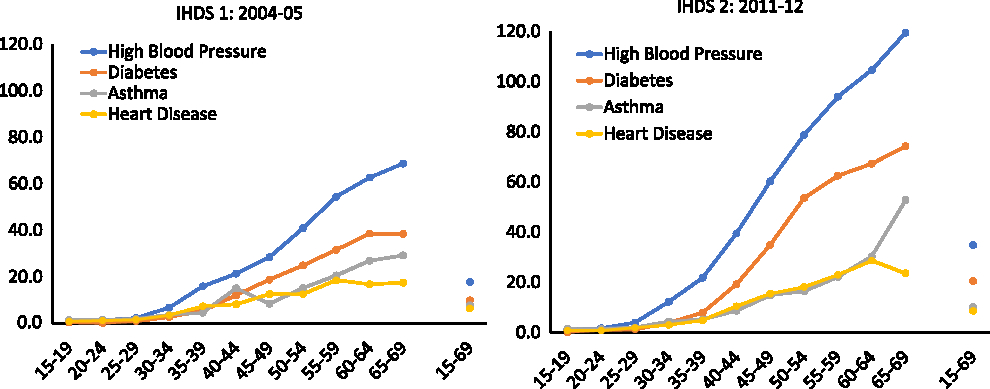
The prevalence rates of the four selected NCDs increased notably between 2004–05 and 2011–12, and the increase was steepest for high blood pressure and diabetes. For every 1000 adults aged 15–69 years, 17.8 adults were diagnosed with high blood pressure in 2004–05, and this increased to 34.9 adults in 2011–12 – a three-fold increase in just 7 years (Fig. 2). The prevalence rate doubled for diabetes over the same period – from 9.9 to 20.5 per 1000 adults aged 15–69 years. The corresponding change was much smaller for asthma (from 7.9 to 10.1 adults) and heart disease (from 6.5 to 8.7 adults).
Prevalence rates of high blood pressure, diabetes, asthma and heart disease per 1000 adults aged 15–69 years, India, 2004–05 and 2011–12.

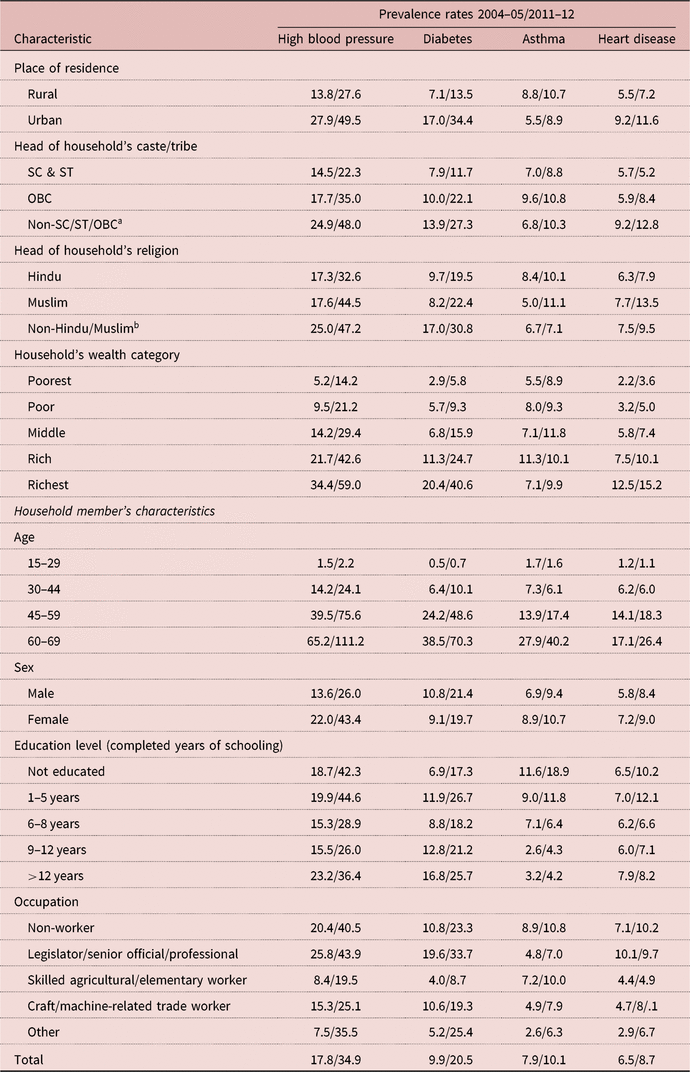
The prevalence rates of high blood pressure, diabetes and heart disease were higher for adults living in urban areas, and for those in the non-SC/ST/OBC and richest wealth categories (Table 1). Conversely, the prevalence rates of asthma were higher for adults living in rural areas, and for those from Other Backward Classes and the middle wealth class. Females showed a relatively higher prevalence of high blood pressure than males, whereas the sex differences in the prevalence of diabetes, asthma and heart disease were narrower. Household economic status showed a prominent positive gradient with the prevalence rates of high blood pressure and diabetes. Age of the adult showed a prominent gradient in the prevalence rates for all four NCDs. For example, compared with adults living in the poorest households, the prevalence of high blood pressure increased 4–7 times for adults in the richest households (from 5.2 to 34.4 per 1000 in 2004–05 and from 14.2 to 59.0 per 1000 in 2011–12). In 2011–12, the prevalence rates rose from 2.2 and 0.7 for adults aged 15–29 years to 111.2 and 70.3 for those aged 60–69 years, respectively, for high blood pressure and diabetes. Similar patterns could be seen for 2004–05 for asthma and heart disease. The prevalence rates were higher among less-educated adults for high blood pressure, asthma and heart disease. However, for diabetes, they were higher for adults who had completed 1–5 years, or more than 12 years, of schooling. Between 2004–05 and 2011–12, the increase in prevalence rates was faster for adults in Muslim households for all NCDs – from 17.6 to 44.5 adults for high blood pressure, from 8.2 to 22.4 adults for diabetes, from 5.0 to 11.1 adults for asthma and from 7.7 to 13.5 adults for heart disease. Similarly, prevalence rates for high blood pressure and diabetes rose faster for adults living in in the poorest and poor category households.
Prevalence rates of selected NCDs per 1000 adults aged 15–69 years in India by socioeconomic and demographic characteristics, 2004–05 and 2011–12

a Includes Brahmin, forward/general and other castes.
b Includes Sikh, Christian, Buddhism, Jain and other religions.
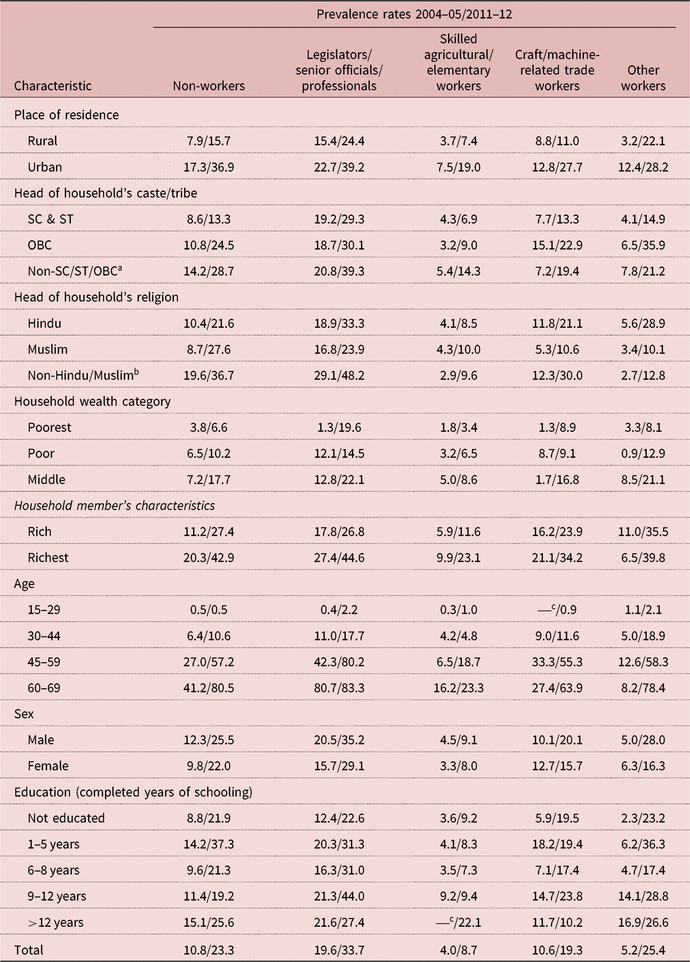
The non-workers and legislators/senior officials/professionals showed a higher prevalence of high blood pressure (20.4–40.5 adults and 25.8–43.9 adults, respectively), diabetes (10.8–23.3 adults and 19.6–33.7 adults, respectively) and heart disease (7.1–10.2 adults and 10.1–9.7 adults, respectively). The skilled agricultural/elementary workers, on the other hand, showed lower prevalence rates of these NCDs (varying between 4.0 and 19.5). While asthma prevalence rates were higher for non-workers and skilled agricultural/elementary workers (8.9–10.8 adults and 7.2–10.0 adults, respectively), they were lower for other workers (2.6–6.3 adults). Further, between 2004–05 and 2011–12, the prevalence rate of high blood pressure and diabetes more than doubled among skilled agricultural/elementary workers and non-workers. Correspondingly, among other workers, the prevalence rates increased more than five times for high blood pressure and diabetes and by three times for asthma (Table 1).
Patterns of prevalence rates of NCDs by socioeconomic and demographic groups
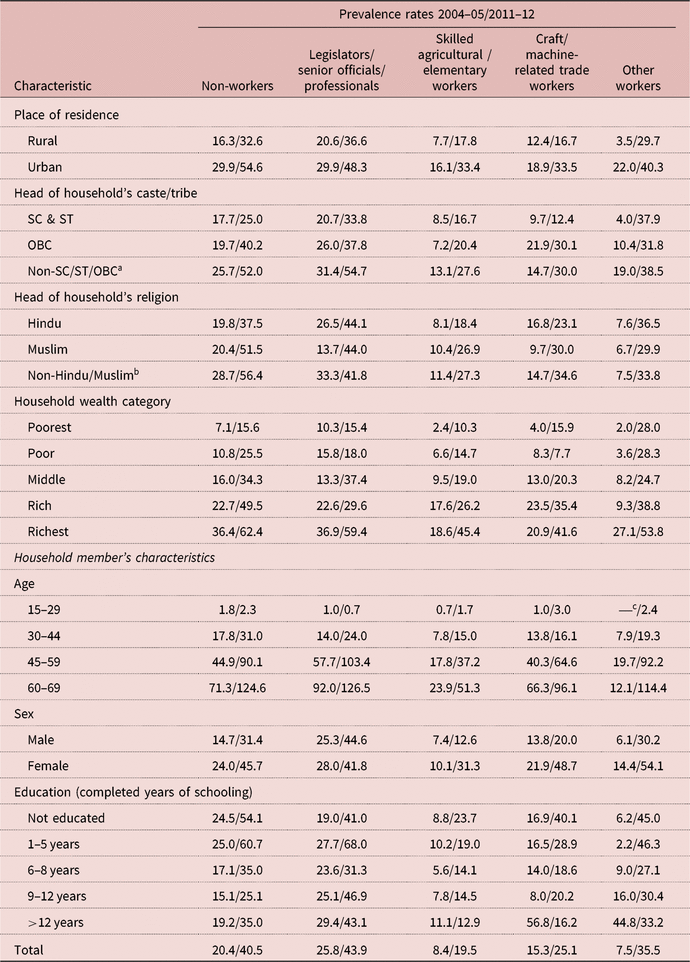
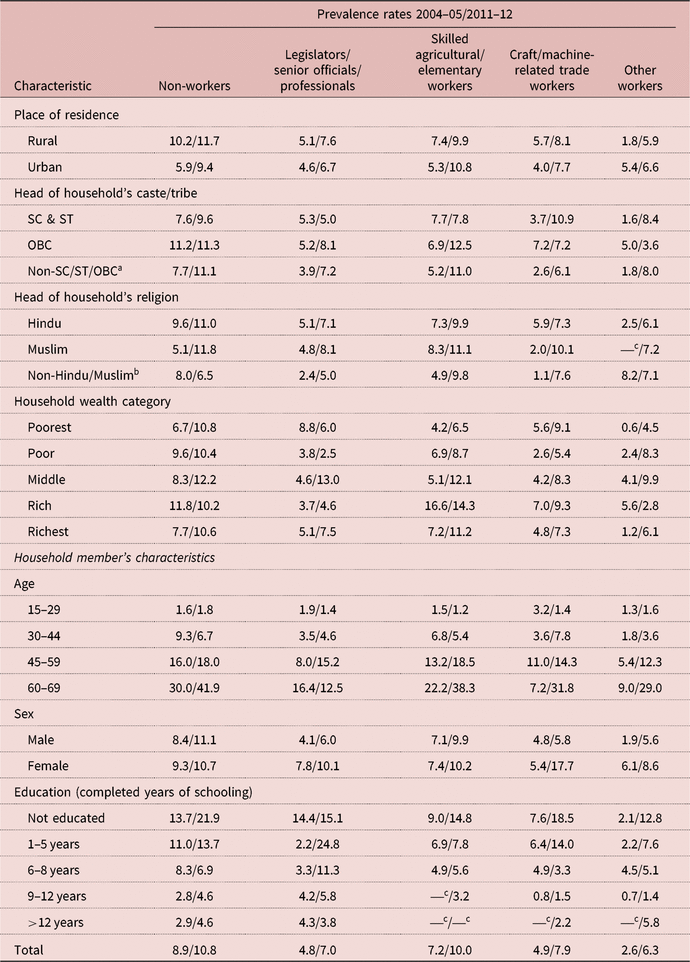
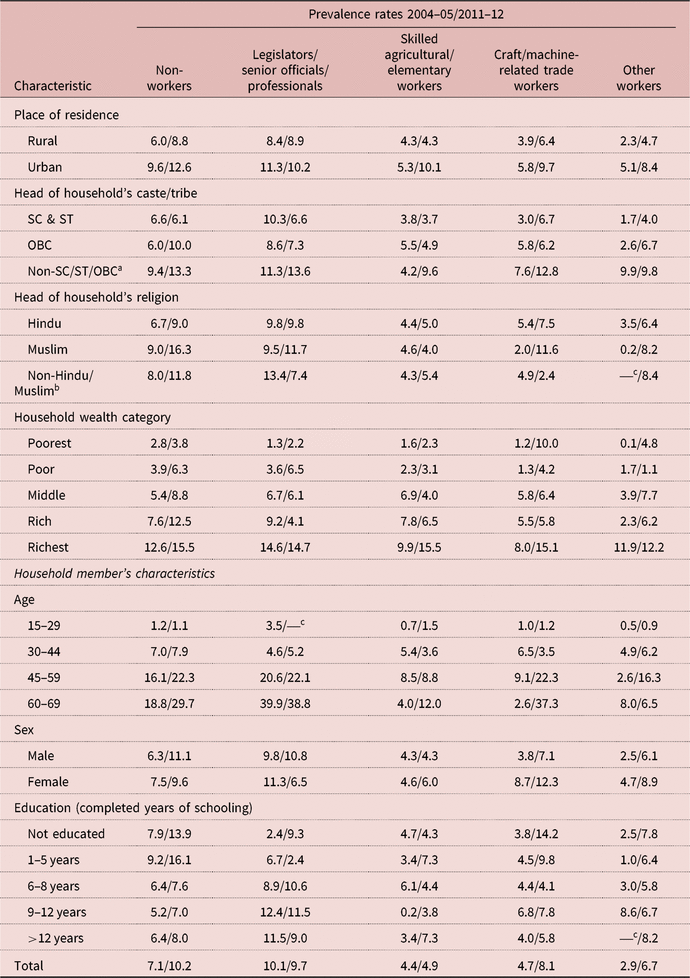
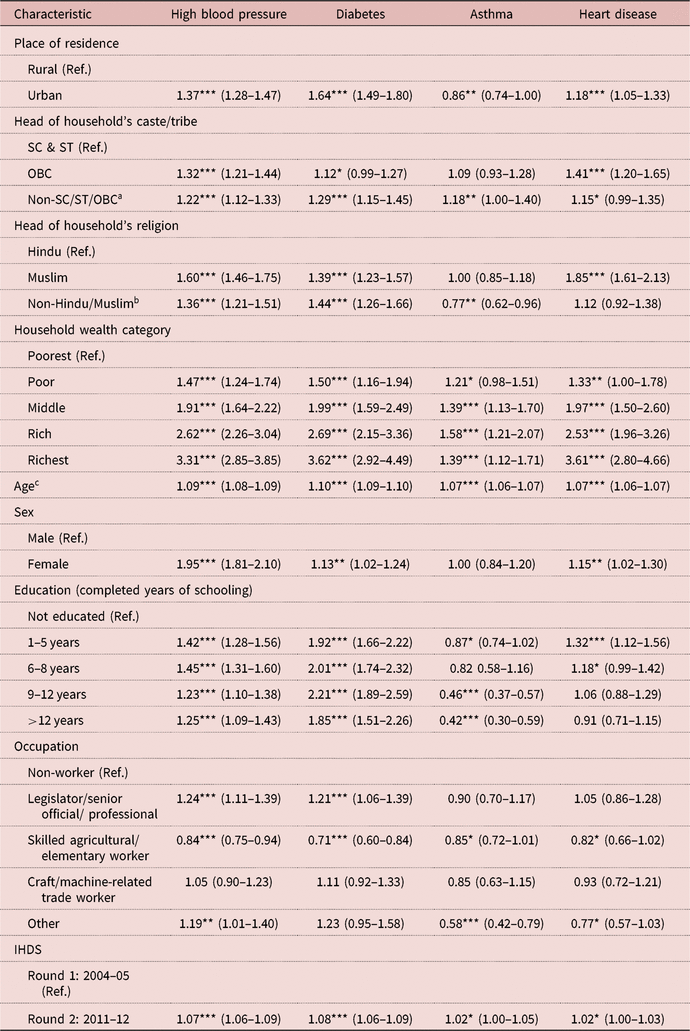
The occupation-specific prevalence rates differed for adults working in different occupation categories and socioeconomic and demographic subgroups (Tables 2–5).
Prevalence rates of high blood pressure by socioeconomic and demographic characteristics and by household member’s occupation per 1000 adults aged 15–69 years in India, 2004–05 and 2011–12
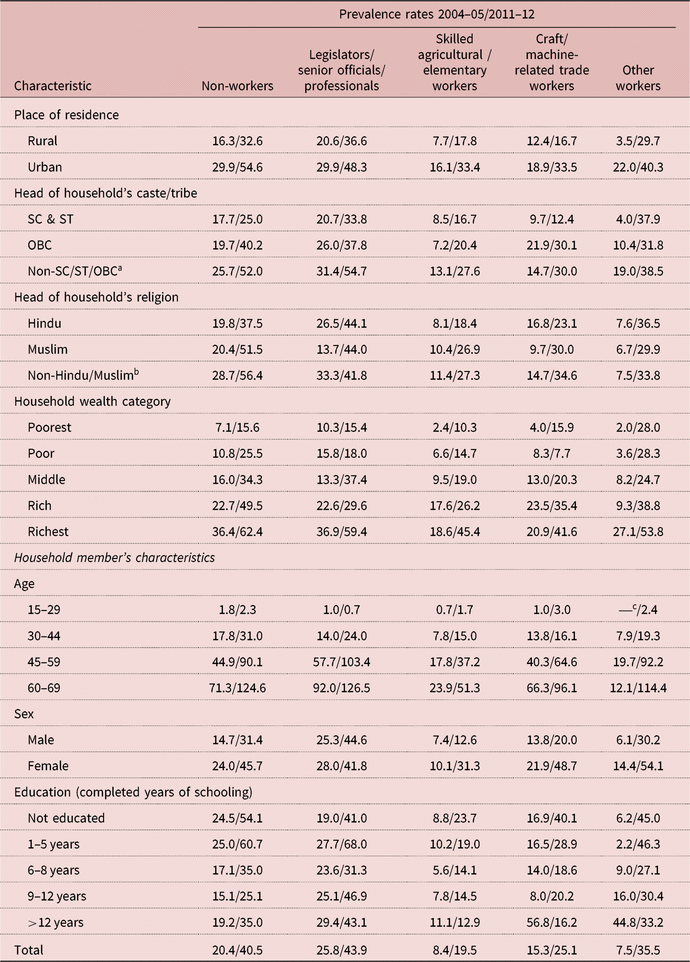
a Includes Brahmin, forward/general and other castes.
b Includes Sikh, Christian, Buddhism, Jain and other religions.
c Not calculated due to inadequate number of diagnosed cases.
Prevalence rates of diabetes by socioeconomic and demographic characteristics and occupation per 1000 adults aged 15–69 years in India for the time periods 2004–05 and 2011–12

a Includes Brahmin, forward/general and other castes.
b Includes Sikh, Christian, Buddhism, Jain and other religions.
c Not calculated due to inadequate number of diagnosed cases.
Prevalence rates of asthma by socioeconomic and demographic characteristics and occupation per 1000 adults aged 15–69 years in India, 2004–05 and 2011–12

a Includes Brahmin, forward/general and other castes.
b Includes Sikh, Christian, Buddhism, Jain and other religions.
c Not calculated due to inadequate number of diagnosed cases.
Prevalence rates of heart disease by socioeconomic and demographic characteristics and occupation per 1000 adults aged 15–69 years in India, 2004–05 and 2011–12

a Includes Brahmin, forward/general and other castes.
b Includes Sikh, Christian, Buddhism, Jain and other religions.
c Not calculated due to inadequate number of diagnosed cases.
High blood pressure
The change in the prevalence rates of high blood pressure varied notably across socioeconomic and demographic subgroups for different occupation categories (Table 2). For instance, among non-workers, the prevalence rates increased rapidly for adults in Muslim households, poor wealth class, males and adults with fewer than 5 years of schooling compared with their respective counterparts. For legislators/senior officials/professionals, the increase in prevalence rate was relatively higher for adults in Muslim households, middle wealth class and adults with 1–5 years of schooling than among their respective counterparts. For skilled agricultural/elementary workers, the increase was higher for females, those not educated, in OBC and the poorest wealth class. For craft/machine-related trade workers, while the prevalence rates increased faster for non-Hindu adults, those living in the poorest households and those who were not educated, they declined for adults with more than 12 years of schooling (from 56.8 adults in 2004–05 to 16.2 adults in 2011–12). Though at much lower levels, the prevalence rates showed sharp rises among young adults aged 15–29 working in craft/machine-related trade and among skilled agricultural/elementary workers.
Diabetes
The patterns of diabetes prevalence rates by subgroups were similar to what has been observed for overall population, but they varied considerably across socioeconomic and demographic subgroups (Table 3). For example, among non-workers, diabetes prevalence rose faster for Muslims, adults from middle and rich wealth classes and those with 5 or fewer years of schooling. Among legislators/senior officials/professionals, the diabetes prevalence rates increased faster for adults from the poorest households. Adults from non-SC/ST/OBC and OBC households, in non-Hindu/Muslim households and those with more than 12 years of schooling and who worked in skilled agricultural/elementary occupations. Craft/machine-related trade workers in urban areas, from non-SC/ST/OBC households and the poorest and middle wealth classes experienced steep rises in the diabetes prevalence rates. These increased between 7 and 13 times over the period for other workers in rural areas, from poor households and those not educated.
Asthma
The changes in the prevalence rates of asthma for subgroups were different from those observed for the other NCDs included in the analysis (Table 4). For instance, among non-workers, they nearly doubled for urban adults, those in non-SC/ST/OBC and Muslim households, middle wealth households, and those not educated. Conversely, they declined for non-workers in non-Hindu/Muslim households and adults with 6–8 years of schooling. The asthma prevalence rates increased more than twice for non-Hindu/Muslims, middle wealth households and those with 1–8 years of schooling for legislators/senior officials/professionals. Conversely, these rates slightly declined for adults in the poorest and poor households and at ages 60–69 years. Among skilled agricultural/elementary workers, the increase was faster for adults living in non-SC/ST/OBC, OBC and middle wealth households, and among adults with 9–12 years of schooling. Among craft/machine-related trade workers, the prevalence rates increased 2–5 times faster in urban areas, adults in SC/ST and non-SC/ST/OBC, non-Hindu, poor and middle wealth households, among older and female adults and those with 5 or fewer years of schooling (including the non-educated).
Heart disease
The prevalence rates for heart disease increased markedly among non-workers in Muslim households and those with fewer than 5 years of schooling (Table 5). While the prevalence rate of heart disease increased significantly among legislators/senior officials/professionals in Muslim households, and those from the poorest and poor households and non-educated adults, they either remained unchanged or declined in the remaining subgroups. Skilled agricultural/elementary workers showed a faster rise in the prevalence of heart disease in urban areas, in the richest households, at ages 60–69 years and among adults with higher education, whereas the rates remained almost unchanged for other subgroup. Among craft/machine-related trade workers, the heart disease prevalence rates showed faster increases for adults in Muslim households, poorest, poor and richest households, at older ages, and among those with no education. The rates for other workers showed a 5–8 times rise for Muslim and non-Hindu/Muslim households, the poorest households and among adults with 6 or more years of schooling.
Results of multiple linear logistic regression analysis
The odds ratios for each NCD by socioeconomic and demographic factors were estimated using two models. In Model 1, the adjusted odds were estimated after adjusting for age of the adult only. In Model 2, the odds were estimated after adjusting for all socioeconomic and demographic variables included in the analysis. The patterns of estimated odds ratios in Model 1 by socioeconomic and demographic subgroups were similar to the patterns observed in Model 2. However, the estimated odds in Model 1 were on the slightly higher side. Thus, it was decided to present results from Model 2 only. Compared with 2004–05, the odds ratios of diagnosed cases were higher for the year 2011–12 for all four NCDs, meaning that more adults in 2011–12 were diagnosed with each NCD (Table 6). In comparison to rural adults, the odds ratios were higher for urban adults for high blood pressure (OR = 1.37; CI = 1.28–1.47), diabetes (OR = 1.64; CI = 1.49–1.80) and heart disease (OR = 1.18; CI = 1.05–1.33), but were lower for asthma (OR = 0.86; CI = 0.74–1.00). Similarly, the odds ratios were 1.12–1.41 times higher for adults living in non-SC/ST/OBC households and by 1.15–1.29 times for those in OBC households for high blood pressure, diabetes and heart disease compared with adults in SC/ST households.
Disease-specific adjusted odds ratios (95% CIs) computed using logistic regression (Model 2, adjusted for all variables) using pooled data from two round of the IHDS, India

*p<0.10; **p<0.05; ***p<0.01.
a Includes Brahmin, forward/general and other castes.
b Includes Sikh, Christian, Buddhism, Jain and other religions.
c Age is taken as continuous variable for each household member.
For asthma, however, the odds ratios were higher for OBC households (OR = 1.18; CI = 1.00–1.40). Muslim adults showed significantly higher odds ratios for high blood pressure, diabetes and heart disease (OR = 1.39–1.85). While non-Hindu/Muslim adults showed significantly higher odds ratios for high blood pressure (OR = 1.36; CI = 1.21–1.51) and diabetes (OR = 1.44; CI = 1.26–1.66), they were lower for asthma (OR = 0.77; CI = 0.62–0.96).
Compared with the poorest households, the odds ratios increased significantly for all NCDs, with an upward increment in wealth class (from poorest to richest). The odds were consistently 3–4 times high for adults in richest households for high blood pressure (OR = 3.31; CI = 2.85–3.85), diabetes (OR = 3.62; CI = 2.92–4.49) and heart disease (OR = 3.61; CI = 2.80–4.66), but they were similar for asthma. A one-year increase in age resulted in a rise in odds ratio by 1.07 to 1.10 for all four NCDs, meaning a one-year increase in age increased morbidity risk of these NCDs by nearly 7–10%. Female adults showed nearly twice the odds of high blood pressure than male adults (OR = 1.95; CI = 1.81–2.10) and 13–15% higher odds of diabetes and heart disease. There were no sex differences in odds ratios for asthma. Education of the adults showed a statistically significant relation with high blood pressure and diabetes, with 5 or fewer years of schooling. Compared with the non-educated adults, the morbidity risk of high blood pressure was 42% to 45% higher for adults with 8 or fewer years of schooling and by 23% to 25% for those with more than 8 years of schooling. The corresponding odds ratios for diabetes varied between 1.85 and 2.21 times higher for adults with any years of schooling. Nonetheless, the adults with more than 12 years of schooling showed relatively lower odds (1.25 for high blood pressure and 1.85 for diabetes). The association between education and heart disease was less consistent. However, adults with 1–5 years of schooling had higher odds of heart disease (OR = 1.32; CI = 1.12–1.56) and 1.18 (CI = 0.99–1.42) for those with 6–8 years of schooling. Conversely, the odds ratio for asthma decreased with an advancement in completed years of schooling of the adult (from 0.87 to 0.42).
Compared with non-workers, the odds were significantly higher for legislators/senior officials/professionals for high blood pressure (OR = 1.24; CI = 1.11–1.39) and diabetes (OR = 1.21; CI = 1.06–1.39). The other workers showed significantly higher odds for high blood pressure (OR = 1.19; CI = 1.01–1.40) and higher but statistically insignificant odds (OR = 1.23; CI = 0.95–1.58) for diabetes. The odds ratios for skilled agricultural/elementary workers were significantly lower for each of the four NCDs (varying between 0.71 for diabetes and 0.85 for asthma). The odds ratios for craft/machine-related trade workers were higher for high blood pressure and diabetes and lower for asthma and heart disease, but the relationship was statistically insignificant.
Discussion
In the year 2016, NCD deaths in India crossed the 6 million mark, accounting for nearly 61.8% of all deaths in the country. Four NCDs, viz. high blood pressure, diabetes, asthma and heart disease, together were responsible for 34.4% of all adult deaths in India (IHME, 2017). The present study examined the changes in the prevalence rates of, and socioeconomic and demographic risk factors associated with, these four NCDs for India using data from Rounds 1 and 2 of the nationally representative IHDS. The study found that older adults, females and urban residents, and those from non-SC/ST/OBC and the richest households, showed the higher prevalence rates of high blood pressure, diabetes and heart disease. However, asthma prevalence rates were lower for males, urban adults and those from non-SC/ST/OBC, SC/ST, Muslim and the poorest households. A positive association was observed between education and the prevalence rates of asthma and heart disease, and a negative association between education and diabetes. Kinra et al. (Reference Kinra, Bowen, Lyngdoh, Prabhakaran, Reddy and Ramakrishnan2010) and Corsi and Subramanian (Reference Corsi and Subramanian2012) reported that diabetes and high blood pressure were more common among socioeconomically deprived Indians with poor food habits (low intake of fruit and vegetables). People with lower educational attainment have been shown to have an increased risk of diabetes in India (Gupta et al., Reference Gupta, Gupta, Sarna, Rastogi, Gupta and Kothari2003; Kar et al., Reference Kar, Narayanan, Ramalingam, Naik and Sujiv2015), whereas hypertension has been found to be more common among the socioeconomically privileged population (Kar et al., Reference Kar, Narayanan, Ramalingam, Naik and Sujiv2015). Kumar and Ram (Reference Kumar and Ram2017) also observed a higher prevalence rate of asthma among less-educated and poorer people. They further estimated that, in 2015, the overall morbidity burden of asthma was nearly 65 million and more than 82 thousand deaths were attributed to asthma in India.
The caste differentials in the prevalence rates of high blood pressure, diabetes and heart disease widened over the analysis period, but they have reduced for high blood pressure and heart disease by household wealth class. Furthermore, differentials in the prevalence rates have widened for asthma and heart disease and have reduced for high blood pressure.
The study noted higher prevalence rates of all four NCDs among non-workers than workers. Legislators/senior officials/professionals showed higher prevalence rates of high blood pressure, diabetes and heart disease. Professionals usually have long sitting hours at the work place, with less opportunity for physical movement, and at the same time they are more likely to have modern sedentary lifestyles. Babu et al. (Reference Babu, Mahapatra and Detels2013) also observed higher prevalence rates of hypertension and prehypertension for adults working in the information technology and service sectors. The prevalence rates of high blood pressure and diabetes were relatively higher among craft/machine-related trade workers who, like professionals, also spend long working days that require less movement. On the other hand, the prevalence rates of these three NCDs were lower among skilled agricultural/elementary workers as well as other workers who may be more likely to conduct physically intensive/rigorous activities and may have less exposure to a modern life style. An important finding of the study is that the prevalence of high blood pressure among non-workers was close to the levels observed for legislators/senior officials/professionals. A comparison of the socio-demographic composition of non-workers with legislators/senior officials/professionals revealed that non-workers tended to be older, female and non-educated compared with the latter, who tended to be young, male and highly educated (with more than 12 years of schooling).
The skilled agricultural/elementary workers and non-workers showed higher prevalence rates of asthma, whereas these were lower for adults in other occupations. Niedhammer et al. (Reference Niedhammer, Chastang and David2008) too observed higher prevalence rates for asthma among non-workers and skilled agricultural/elementary workers. Non-workers are likely to spend most of their time at home, resulting in greater exposure to indoor pollutants (as a result of use of unclean cooking fuel, particularly in rural areas) as well as poor ambient air pollution (more importantly in urban areas due to residence in congested localities and overcrowded housing and higher vehicular pollution) (WHO, 2018).
The morbidity risk of these NCDs was found to be significantly associated with the type of occupation of the adults. The legislators/senior officials/professionals had significantly high odds of being diagnosed with high blood pressure and diabetes compared with the non-workers, whereas this risk was lower for asthma. The craft/machine-related trade workers had a significantly higher risk of being diagnosed with high blood pressure, but were less likely to be diagnosed with asthma or heart disease. The skilled agricultural/elementary workers, on the other hand, were found to have a significantly lower risk of being diagnosed with high blood pressure, diabetes and heart disease. Furthermore, other workers had a significantly higher risk of being diagnosed with high blood pressure but lower risk of asthma and heart disease.
The other socioeconomic and demographic characteristics considered in this study were also found to have differential morbidity risks for these selected NCDs. For instance, urban adults had an elevated morbidity risk of high blood pressure, diabetes and heart disease compared with their rural counterparts. Conversely, rural adults had an elevated risk of asthma. These results are consistent with the global literature (Gupta et al., Reference Gupta, Al-Odat and Gupta1996; Mohan et al., Reference Mohan, Mathur, Deepa, Deepa, Shukla and Menon2008; Agrawal et al., Reference Agrawal, Pearce, Millett, Subramanian and Ebrahim2014). This can be attributed to the fact that urban adults usually have sedentary life styles, whereas rural Indians generally perform vigorous activities leading to a lowest prevalence of diabetes. The findings reveal that adults in economically better off household have a significantly increased morbidity risk of all four NCDs. For example, compared with the adults in poorest households, adults in the richest households had a 3–4 times increased risk of high blood pressure, diabetes and heart disease. Similarly, adults in the rich and richest households had a 39–58% higher risk of asthma. Similar observations have been made in previous studies in India (Agnihotram & Chattopadhyay, Reference Agnihotram and Chattopadhyay2004; Kumar & Ram, Reference Kumar and Ram2017).
Older adults and the female sex are generally disadvantaged. While females were observed to have nearly twice the risk of being diagnosed with high blood pressure and a 13–15% elevated risk of being diagnosed with diabetes and heart disease, the risk of asthma was similar for both sexes. The morbidity risk of high blood pressure and diabetes increased with an improvement in the educational status of the adults, but it became protective for asthma and heart disease. In general, adults from non-Hindu households had a significantly elevated morbidity risk from all four NCDs. Furthermore, adults in under-privileged/backward castes and tribes had a significantly elevated morbidity risk from high blood pressure, diabetes and heart disease. The risk of asthma, however, was significantly lower for the adults in SC/ST households.
The Government of India has made significant efforts in the past and has implemented several policies initiatives and special programmes towards curbing these non-communicable diseases. The National Program on Prevention and Control of Cancer Diabetes, Cardiovascular diseases and Stroke (NPCDCS) launched in 2010 aimed to prevent and control NCDs, create awareness on lifestyle changes, promote the early detection of NCDs and build capacity in health systems to tackle NCDs. Additionally, it has initiated multiple programmes, including the National Tobacco Control Program (NTCP) in 2007–08 and Rashtriya Arogya Nidhi set up in 2009 (Ministry of Health and Family Welfare, 2019). The Rashtriya Arogya Nidhi financially supports poor people suffering from major life-threatening diseases for treatment and surgery. India’s National Health Policy 2017 strongly recommended an increase in public spending on health to more than 8% of the state government budget by 2020. This policy also supported an integrated approach with screening for the most prevalent NCDs with secondary prevention that should make a significant impact on the reduction of morbidity and preventable mortality (ICMR et al., 2017). A review of strategy suggests that the public health efforts have laid greater emphasis on malnutrition and reproductive health (National Institute of Health and Family Welfare, 2014).
Being the second largest country in the world, and set to become the most populous country very soon (United Nations, 2019), India alone accounts for about 17% of the 1.9 million cases of occupational diseases globally. However, little attention has been paid to reducing occupational disease through programmatic efforts in India (National Institute of Health and Family Welfare, 2014). There has been a lack of systematic strategies at both national and sub-national level to tackle poor working conditions and compromised environments in the country. Although the National Health Policy of 1983 and 2002 had occupational health as a component, the only scheme to address the issue has been the National Program for Control and Treatment of Occupational Diseases launched in 1998–99 by the Government of India. Since then, aspects of occupational morbidity have been changing in India and the prevalence of NCDs such as high blood pressure, diabetes, asthma and heart disease has been rising rapidly. This transition poses a serious challenge to an already inadequate and inefficient health delivery system. It is therefore important for India to not only address these emerging issues in its health delivery system, but also to collect evidence and information on occupational and work place exposure to potential health hazards and associated morbidity and mortality.
The study used longitudinal data to examine the levels and changes in prevalence rates of four important NCDs based on diagnosed cases. It further investigated occupation as a determinant of the condition. However, it was not possible to establish a casual linkage between the occupation of the adult and diseases, as occupation was recorded at the time of the survey. It was not known from the data if the person suffering from a certain NCD was engaged in a different occupation before or at the time of onset of the disease. Secondly, for a country such as India, which has huge sub-national diversity, it would have been more meaningful to undertake the analysis either at the state level or at regional level. This could not be done as the data were not suitable for sub-national analysis (Desai et al., Reference Desai, Dubey, Joshi, Sen, Shariff and Vanneman2009).
In conclusion, India is experiencing a sharp rise in the burden of non-communicable diseases. High blood pressure, diabetes, asthma and heart disease are the most common of all the known NCDs found among adults in India. The present research found a steep rise in the prevalence rates of high blood pressure and diabetes in India over the analysis period, cutting across various socioeconomic and demographic subgroups. The type of occupation of adults emerged as a significant predictor of all four NCDs. Legislators/senior official/professionals were found to be most vulnerable to high blood pressure, diabetes and heart disease, whereas non-workers were at higher risks of asthma. The analysis calls for greater attention towards addressing the occupational health of the adult population in India. The Government of India should also initiate organized efforts towards ensuring strict implementation of safety measure and protocols in the work place.
Acknowledgment
The research study was based on a secondary data source of India Human Development Survey Round 1 (IHDS: 2004–05) and Round 2 (IHDS: 2011–12). The data are publicly available for research: Round 1 (https://doi.org/10.3886/ICPSR22626.v8); Round 2 (https://doi.org/10.3886/ICPSR36151.v2). The datasets can be downloaded upon acceptance of terms of use.
Funding
This research received no specific grant from any funding agency, commercial entity or not-for-profit organization.
Conflicts of Interest
The authors have no conflicts of interest to declare.
Ethical Approval
The study was based on a publicly available secondary data source – the India Human Development Survey (IHDS) – jointly organized by the University of Maryland and National Council of Applied Economic Research (NCAER), New Delhi. The authors assert that all procedures contributing to this work comply with the ethical standards taken by University of Maryland and National Council of Applied Economic Research. Therefore, no ethical concerns were required for this research work.