


Introduction
Early Antarctic international programmes (e.g. FIBEX, SIBEX/BIOMASS, BROKE, SO-GLOBEC, CCAMLR) were undertaken to increase understanding of the structure and dynamic functioning of the Antarctic marine ecosystem (Hempel Reference Hempel1983, Nicol et al. Reference Nicol, Pauly, Bindoff and Strutton2000, Atkinson et al. Reference Atkinson, Siegel, Pakhomov and Rothery2004). Many of these programmes focussed on the assessment of stocks of the Antarctic krill Euphausia superba Dana, which was perceived to be a key component of the ecosystem. Antarctic krill was thought to form the vital link in the classic short phytoplankton-krill-whale food chain as well as being essential prey for numerous other predators such as fur seals, penguins and fish (Hecq Reference Hecq2003). Other authors (e.g. Everson Reference Everson and Laws1984, Yamada & Kawamura Reference Yamada and Kawamura1986, Conover & Huntley Reference Conover and Huntley1991, Hosie et al. Reference Hosie, Cochran, Pauly, Beaumont, Wright and Kitchener1997, Reference Hosie, Schultz, Kitchener, Cochran and Richards2000, Hofmann et al. Reference Hofmann, Klinck, Daly, Torres and Fraser2002, Kaufmann et al. Reference Kaufmann, Fisher, Gill, King, Laubacher and Sullivan2003) have highlighted that planktonic organisms, such as copepods, the ice krill Euphausia crystallorophias Holt & Tattersall and some fish larvae, also represent a significant component of zooplankton biomass, sometimes exceeding that of krill, and form important alternative pathways in the Antarctic food web as food for fish, birds and mammals (Williams Reference Williams, Siegfried, Condy and Laws1985, Green & Williams Reference Green and Williams1986, Foster et al. Reference Foster, Cargill and Montgomer1987, Arnould & Whitehead Reference Arnould and Whitehead1991, Hosie et al. Reference Hosie, Cochran, Pauly, Beaumont, Wright and Kitchener1997, Rodary et al. Reference Rodary, Wienecke and Bost2000).
Most information on the larval ecology of Antarctic euphausiids comes from the Atlantic sector of the Southern Ocean (e.g. Fevolden Reference Fevolden1979, Reference Fevolden1980, Hempel et al. Reference Hempel, Hempel and de Baker1979, Makarov Reference Makarov1979, Brinton & Townsend Reference Brinton and Townsend1984, Rakusa-Suszczewski Reference Rakusa-Suszczewski1984), with less information available from East Antarctica through the BIOMASS cruise in the Prydz Bay region (Hosie & Kirkwood Reference Hosie and Kirkwood1986, Hosie et al. Reference Hosie, Ikeda and Stolp1988) and the BROKE survey (Nicol et al. Reference Nicol, Pauly, Bindoff and Strutton2000). These mostly sampled offshore areas or near the shelf break where Euphausia superba is often abundant.
There have been few zooplankton studies on the continental shelf of East Antarctica. Since 2004, the Institute Paul-Emile Victor (IPEV) has carried out surveys of phyto-, zoo- and ichthyoplankton of the coastal zone of East Antarctica between 139 and 146°E, from Terre Adélie to Mertz Glacier Tongue (MGT). The Mertz Glacier is the largest glacier in the region, though smaller ones, including the Astrolabe and Zélée glaciers, are also present in the western part of the area. The shelf is divided into large bays: Commonwealth Bay, Watt Bay and Buchanan Bay (Fig. 1). The Adélie Bank, a long plateau at about 200 m depth, is located between the Astrolabe Glacier and Commonwealth Bay. Innershelf depressions (500–1000 m) are present, with the largest one between Watt Bay and the MGT known as the Adélie Depression (142–146°E), which is closed by a threshold (Williams & Bindoff Reference Williams and Bindoff2003). A second depression is present along the Adélie Bank which opens to the north towards very deep waters (500–1000 m). From a hydrodynamical point of view, the study area is characterized by the presence of gyres, which were studied during surveys such as BROKE (Nicol et al. Reference Nicol, Pauly, Bindoff and Strutton2000), the formation of Antarctic Deep Water, the influence of the large Mertz Glacier Tongue and the northern position of Terre Adélie and Georges V Land in East Antarctica. The region is also characterized by very strong katabatic winds that influence surface water currents (Wendler et al. Reference Wendler, Stearns, Weidner, Dargaud and Parish1997), the dynamics of polynyas, and then could play an important role in structuring the spatial distribution of larval euphausiids. Moreover, because of its more latitudinal position northerly compared to other Antarctic coasts, it is a good place to look at the consequences of environmental changes on the marine ecosystem of the East Antarctic shelf. Apart from these local features, the region away from glacial influence appears typical of more than 50% of the Antarctic coastline. This emphasizes the scientific interest of the area studied where ecosystem functioning is largely unknown.
Positions of a. sampling stations, and b. bathymetry of the study area during the 2004 survey (data source: ETOPO2v2, NOAA, GDC).

During a survey in January 2004, we studied the relationships between the distribution of euphausiid larvae and biotic and abiotic factors along the coast of Terre Adélie. This study took place within a long-term programme (Ichtyologie Côtière en Terre Adélie, ICOTA) that is established in Terre Adélie (East Antarctica 66°40′S, 140°E) and has been undertaken each summer from 1996–2008). This programme ended with the January–February 2008 CEAMARC surveys (Collaborative East Antarctic Marine Census). The programme is part of CAML (Census of Antarctic Marine Life - IPY 53) supported by research vessels of three countries (Australia, Japan and France). To continue national and international efforts in this area, a new programme (Integrated Coastal Ocean Observations in Terre Adélie, ICO2TA) will continue the pelagic monitoring of this area which might be considered in the near future as a legacy site of the CAML initiative.
Methods
The survey was conducted from the RS l'Astrolabe across the area 139°–145°E from 19–28 January 2004 (Fig. 1). The water was free of sea ice, while icebergs were observed only near the glaciers. Eleven transects were occupied, generally sampling south to north, and these extended to a maximum of 20 nautical miles northwards from the southern extent, which was determined by ice conditions or navigational safety considerations. In total, 38 stations were sampled; 15 stations in the western part of the survey were selected to sample the foraging area of Adélie penguins who were feeding their chicks at the colony near Dumont d'Urville, and 23 stations covered the area from Dumont d'Urville to the MGT. The 15 western sampling stations were selected in conjunction with satellite tracks (Argos) of 10 penguins (C. Bost, personal communication 2008). Samples were collected at all stations. However, at station 29, macrozooplankton could not be sampled, so this station is excluded from analyses presented here.
Throughout the survey, regular measurements (1 per minute) of sea surface temperature (SST) and salinity (SSS) were taken with an onboard Seabird surface thermosalinometer. At each station a SBE25 CTD measured temperature and salinity down to 1000 m or to the seabed if the depth was less than 1000 m. Niskin bottles were used to sample water at different depths for each station (approximately 5 m, 25 m, 75 m and 150 m) in order to study concentrations of oxygen, nutrients, total carbon and nitrogen, photosynthetic pigments and abundance of the microplankton community (Bean et al. Reference Beans, Hecq, Chalon, Koubbi, Vallet, Wright and Goffart2008).
Water samples for nitrate and nitrite (20 ml) were collected directly from the Niskin bottles using polyethylene syringes. Polyethylene flasks were filled approximately two-thirds full, immediately frozen vertically and stored at -20°C until analysis. Syringes and flasks had previously been soaked in 10% HCl for 24 h and rinsed three times with Milli-Q water and sample water. Nutrients were determined using a Technicon AutoAnalyser II. Nitrate and nitrite analysis followed Tréguer & Le Corre (Reference Tréguer and Le Corre1975). OSIL marine nutrient standards were used for calibrations.
Macrozooplankton was collected by oblique tows of a double-framed bongo net with 500 µm mesh and 60 cm mouth diameter (Smith & Richardson Reference Smith and Richardson1977). Tows were carried out at a speed of 2 knots from the surface to near the sea bed for depths shallower than 200 m or a depth of 200 m. The volume of water filtered by each net was measured with a flowmeter and used to calculate macrozooplankton abundances. Samples were fixed immediately on board with 5% neutral formalin in seawater.
In the laboratory, euphausiid larvae were sorted, identified and counted. All individuals were separated into the following stages: nauplius I and II, metanauplius, calyptopis I to III, and furcilia I to VI, according to Kirkwood (Reference Kirkwood1982). Fish larvae, euphausiid adults, copepods, amphipods and other taxa were sorted, identified and counted. These date will be presented in later papers.
A Geographic Information System (GIS) (ArcGis 9.1; ESRI) was used to produce distribution maps of the euphausiid larvae and environmental variables. Environmental and biological data were imported into the GIS as point georeferenced data. Interpolations of surface temperature and salinity were calculated to generate raster layers (based on pixels) using the Geostatistical Analyst extension of ArcGis. Geostatistics are methods which allow the estimation of a value at an unsampled location (Rivoirard et al. Reference Rivoirard, Simmonds, Foote, Fernades and Bez2000). Areas where interpolations are not accurate enough are withdrawn from the map depending on the standard deviation map obtained as well when kriging is processed.
Multivariate analyses were performed using CANOCO version 4.53 (Biometrics, Waginengen). Redundancy analysis (RDA) was used to examine the relationships between the euphausiid larvae and the environmental variables for the 37 sampling sites. RDA is a direct gradient analysis technique where the ordination axes are constrained to be linear combinations of environmental factors. RDA was chosen as the appropriate ordination method based on gradient lengths, as determined by detrended canonical correspondence analysis, being less than 2 (Lepš & Šimlauer Reference Lepš and Šimlauer2003). The forward selection option of RDA, which is analogous to the technique of stepwise multiple regression, was used to determine the minimum number of explanatory factors that could explain statistically significant (P ≤ 0.05) proportions of variation in the euphausiid larvae data. The significance of these variables was assessed using Monte Carlo permutation tests (with 499 unrestricted permutations).
Results
Environmental variables
The surface temperature of the water varied from -0.88°C at station 17 near the MGT to 0.33°C at station 30 near the coast in Commonwealth Bay (Fig. 2a). The mean surface temperature was -0.23 ± 0.29°C over the whole study area. The coldest sea surface temperatures (SST) were on the eastern side of the study region, along the MGT just above the deepest part of the Adélie Depression (Fig. 2a). In this region, the mean surface temperature was -0.53 ± 0.16°C. Warmer surface water (mean 0.04 ± 0.25°C) occurred on the Adélie Bank, on the north-eastern part of Commonwealth Bay and on the shelf bordered on the west by the d'Urville Trough. In the foraging area of Adélie penguins (western part of the study area), the SST varied between -0.4° to +0.2°C with a mean of -0.15 ± 0.19°C. The SST was closely related to the topographic features. The coldest water was above the trough and the depression, and the warmest surface waters were over shallow region of the shelf.
Maps showing a. Sea Surface Temperature, and b. Sea Surface Salinity during the 2004 survey (Beans et al. Reference Beans, Hecq, Chalon, Koubbi, Vallet, Wright and Goffart2008).

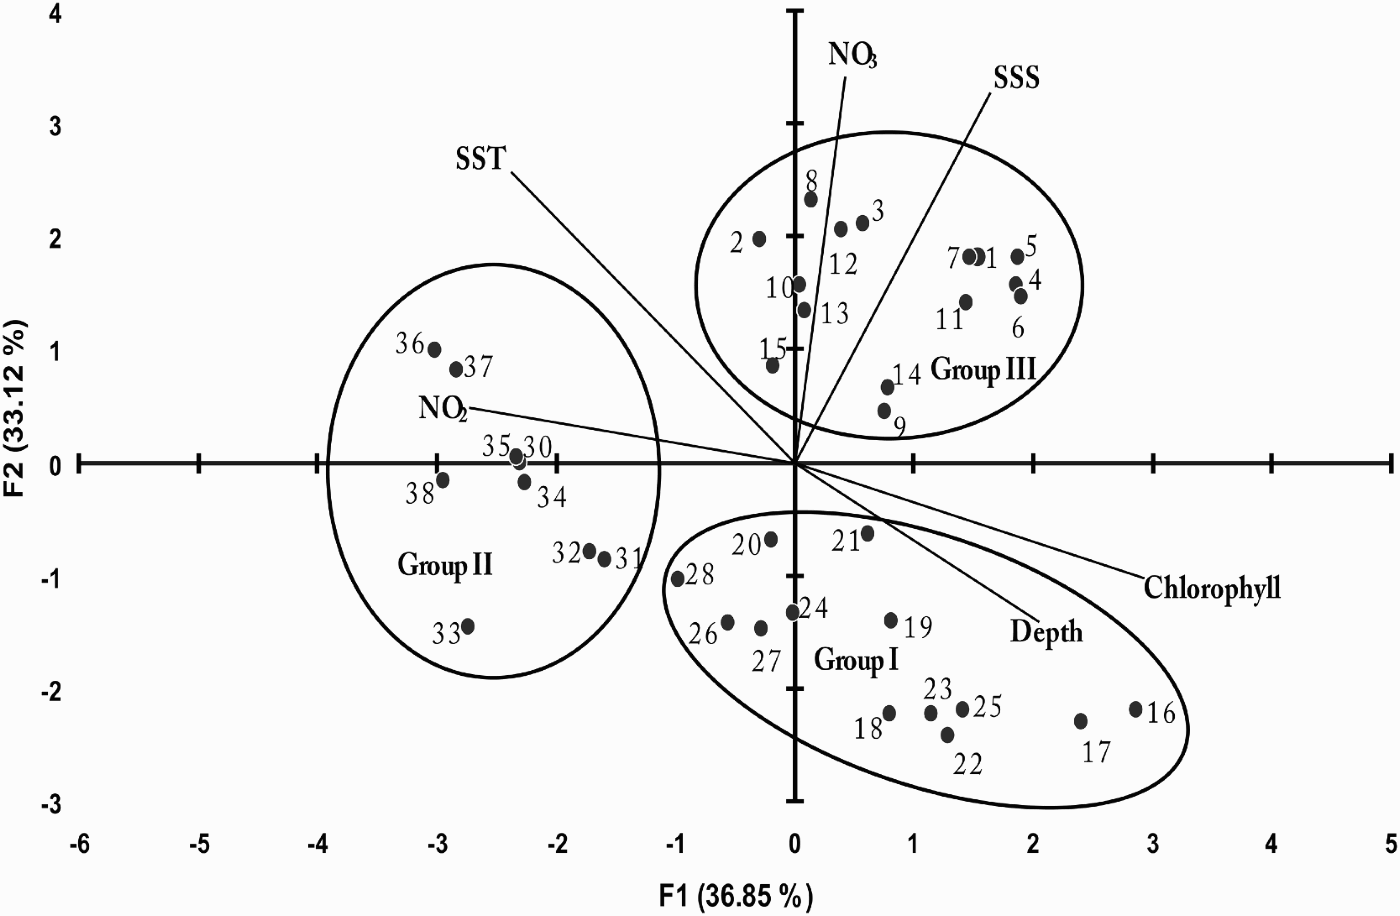
A salinity gradient was observed from the coast to the offshore waters in the eastern part, with the freshest water offshore and along the northern edge of the MGT (Fig. 2b). The maximum sea surface salinity (SSS) was observed above the d'Urville Trough with an average of 34.2 ± 0.1 and along a coastal horizontal layer as far as Commonwealth Bay (Fig. 2b). From this bay, fresher waters (SSS < 33.9) predominated towards the Mertz Glacier and further offshore. Relationships between the sampling sites based on the environmental data were assessed with a PCA (Fig. 4). Figure 4 shows a biplot of the scores derived from PCA axes 1 and 2, which accounted for 37 and 33% of the variation in the environmental data, respectively. Sites near the MGT (16, 17 and 18) grouped with several in Watt Bay (from 19 to 28; Group I). They were characterized by the deepest water, low sea surface temperature and salinity, low concentration of nitrite (mean NO2 = 0.18 ± 0.01 µM) and nitrate (mean NO3 = 31.22 ± 0.48 µM), and higher concentration of chlorophyll a (mean chlorophyll a = 0.86 ± 0.34 µg·l-1) (Fig. 3). Group II, which grouped sites occurring in Adélie Bank, tended to have relatively shallow water depth, higher SST and concentration of nitrite (mean NO2 = 0.21 ± 0.01 µM), low SSS, lower concentration of chlorophyll a (mean chlorophyll a = 0.29 ± 0.04 µg·l-1) and high concentration of nitrate (mean NO3 = 32.16 ± 0.42 µM) (Fig. 3). Group III grouped sites occurred mainly over shelf waters from Dumont d'Urville. They were characterized by higher SSS and concentration of nitrate (mean NO3 = 33.49 ± 0.82 µM), and low SST, concentration of nitrite (mean NO2 = 0.19 ± 0.02 µM) and concentration of chlorophyll a (mean chlorophyll a = 0.69 ± 0.14 µg·l-1) (Fig. 3).
Chlorophyll a (µg·l-1), nitrate and nitrite (µM) concentrations during the 2004 survey.

Ordination diagram showing the position of the sampling sites (1 to 38) on a biplot of the first two axes of a Principal Components Analysis (PCA) of environmental data (depth, SST, SSS, nitrite, nitrate and chlorophyll).
Euphausiid larvae composition
The larvae of two species of euphausiids, Thysanoessa macrura and Euphausia crystallorophias, were observed. The most abundant species was E. crystallorophias, which occurred at all but three stations (Fig. 5). Two naupliar stages of this species, nauplius I and II, and four furcilia stages, furcilia II, III, IV and V, were not observed (Table I; Fig. 6a). Metanauplii were observed at eleven stations (Table I), but their abundance was low (Fig. 5). A few specimens of furcilia VI were found at two stations (Figs 5a & 6a). Calyptopis stages of this species, representing 92% of all stages found in our samples, were dominated by calyptopis I (67%, Fig. 6a). Abundances of the calyptopis stages were the highest in our samples and maxima were observed over the Adélie Bank, with 37 ind. 100 m-3 (Fig. 5b). Of these, abundance of calyptopis I were maximal with 33 ind. 100 m-3 (Fig. 5b; Table I). Metanauplius and calyptopis I stages showed a major aggregation north of Port Martin, while a patch of calyptopis I was observed near the Mertz Glacier and a patch of metanauplii and calyptopis I west of Dumont d'Urville (Fig. 5).
Distribution and abundance of the larvae of Euphausia crystallorophias: a. distribution and abundance of all stages in all stations, and b. map of abundances of calyptopis stages.

Frequency distribution of developmental stages within each species. Metanauplius (MN), calyptopis I, II, III (CI, CII, CIII), furcilia I, II, III, IV, V, VI (FI, FII, FIII, FIV, FV, FVI).

Distribution and abundance of the larvae of Thysanoessa macrura: a. distribution and abundance of all stages in all stations, and b. map of abundances of furcilia stages.

Characteristics of developmental stages for Euphausia crystallorophias and Thysanoessa macrura in summer 2004. Frequency = (number of sampling sites where stages are collected) × 100/total number of sampling sites.

Thysanoessa macrura was observed at 23 stations (Fig. 7), especially near the Mertz Glacier and over the shelf facing Port Martin. Two naupliar stages of this species, I and II, metanauplii and two furcilia stages, IV and V, were not collected (Fig. 6b & 7). Furcilia stages represented around 87% of all T. macrura larvae (Fig. 6b). The calyptopis I stage of this species was only observed north of Dumont d'Urville, with an abundance of 3.2 ind. 100 m-3, while calyptopis II and III were collected near the MGT. However, their abundances remained very low (< 1ind. 100 m-3) (Fig. 7a; Table I). Most of the furcilia I, II, III and IV were observed near the Mertz Glacier and on Adélie Bank (Fig. 6b). Abundances of T. macrura furcilia stages were the highest for this species in our samples (Table I) and maxima were observed over the shelf north of Watt Bay over the Adélie Depression, with 5.9 ind. 100 m-3. In this area, furcilia I reached 3.7 ind. 100 m-3 (Fig. 7b; Table I).
Correlations between euphausiid larvae distribution and environmental data
Relationships between the distributions of larvae and the environmental data were assessed with a RDA (Fig. 8). For E. crystallorophias two environmental variables explained statistically significant proportions of variation in the developmental stages data: SSS (P < 0.01) and depth (P < 0.05). Two canonical axes were necessary for the interpretation because the variance percentage of the species-environment relation explained by the first canonical axis was only 63%. SSS was negatively correlated (-0.99) with the first axis and the depth was positively correlated (0.99) with the second axis. Metanauplius, calyptopis I and furcilia I stages were negatively correlated with depth and were independent of SSS (Fig. 8a). Calyptopis II and III were negatively correlated with SSS and independent of depth. Furcilia VI was highly correlated with depth and independent of SSS. From these results, it appears that young larval stages tend to inhabit shallower waters while the older stages tend to inhabit deeper water.
Redundancy analysis (RDA) of a. log-transformed abundance of Euphausia crystallorophias and environmental parameters (sea-surface salinity and depth), and b. log-transformed abundance of Thysanoessa macrura and environmental parameters (chlorophyll a and nitrate, NO3) from the 2004 survey.

For T. macrura, chlorophyll a (P < 0.05) and nitrate concentrations (P < 0.05) could explain significant proportions of variation in larval stage distribution (Fig. 8b). The first axis explained approximately 70% of variance of the species-environment. Chlorophyll a concentration was highly correlated with both axis 1 (0.78) and axis 2 (0.62). Nitrate concentration was highly negatively correlated with axis 2 (-0.93). Calyptopis I and furcilia VI were highly correlated with chlorophyll a concentration and were independent of nitrate concentration. Calyptopis II and III and furcilia II were negatively correlated with nitrate concentration and were independent of chlorophyll a concentration. Furcilia I and III were negatively correlated with the chlorophyll a concentration and were independent of nitrate concentration. These results suggest that T. macrura larvae were more dependent on biotic factors than E. crystallorophias ones.
Discussion
Environmental data
Gradients in SSS was identified from the coast to offshore and from west to east. In the eastern part of the survey region, lower salinity water was observed offshore and along the northern edge of the MGT. The main current could explain this accumulation of freshened ice shelf water (ISW) because it flowed eastward and packed together the sea ice in the vicinity of the MGT. (Whitworth et al. Reference Whitworth, Orsi, Kim and Nowlin1998; Fig. 9). The lower salinity Adélie Antarctic Surface Water (AASW) formed close to the surface, under melting sea ice, from spring to late summer and overlaid the entire continental shelf (Vaillancourt et al. Reference Vaillancourt, Sambrotto, Green and Matsuda2003, Whitworth et al. Reference Whitworth, Orsi, Kim and Nowlin1998, Bindoff et al. Reference Bindoff, Rosenberg and Warner2000, Reference Bindoff, Williams and Allison2001). The saltiest area was located in the west between the region offshore from Dumont d'Urville and the area north of Port Martin.
Oceanographic regime of the George V Coast (modified from Harris et al. Reference Harris, Brancolini, Armand, Busetti, Beaman, Giorgetti, Presti and Trincardi2001). ACoastC = Antarctic Coastal Current, MCDW = Modified Circumpolar Deepwater, HSSW = High Salinity Shelf Water, ISW = Ice Shelf Water, WW = Winter Water, ALBW = Adélie Land Bottom Water. The position of the core NBP01-01 JPC10 is indicated. Inset is the location of the Mertz Ninnis Trough (MNT) on the East Antarctic Margin.

From the statistical analyses we could distinguish three main zones from Terre Adélie to the MGT. Zone 1 was located in front of Dumont d'Urville in the western part of the study area. It was characterized by high salinity and nitrate concentration, and low biomass (0.38–0.94 µg chl a.l-1) and abundance (394–9058 cells.l-1) of diatoms; the diverse diatom community was characterized by larger species such as Corethron pennatum and Rhizosolenia spp. (Beans et al. Reference Beans, Hecq, Chalon, Koubbi, Vallet, Wright and Goffart2008). Zone 2 was located in waters over the Adélie Bank where the depth was shallowest. In this part of the study area, SST and nitrite concentrations were highest while chlorophyll a concentrations remained low because of a low abundance (1190–5431 cells. l-1) of diatoms (Beans et al. Reference Beans, Hecq, Chalon, Koubbi, Vallet, Wright and Goffart2008), coinciding with presence of herbivorous zooplankton such as fish larvae Pleuragramma antarcticum in high abundance (Koubbi et al. in press). This zone had less vertical stratification compared to the Adélie depression zone (zone 3) (Sultan, personal communication 2008) and lower SSS. Zone 3 was located in the eastern part of the survey region near the Mertz Glacier Tongue. This area was characterized by low SST and nitrate concentration but high chlorophyll a concentration. The high chlorophyll a concentrations corresponded to the highest diatom abundances (6507–70274 cells. l-1 at 5 m), though diversity was low, being dominated by Fragilariopsis spp. (Beans et al. Reference Beans, Hecq, Chalon, Koubbi, Vallet, Wright and Goffart2008). Zone 3 had dense water formation where high salinity shelf waters (HSSW) accumulated (Fig. 8). The HSSW is formed in winter from brines rejected during sea ice formation and is incorporated into the regional circulation. Gordon & Tchernia (Reference Gordon and Tchernia1972) identified this HSSW as an important source of deep water, and named it the Adélie Land Bottom Water (ALBW). The densest part of the water column is trapped within the depression. The MGT isolates the Adélie Depression from the East Drift, allowing the Mertz Glacier Polynya to be formed and maintained throughout the entire winter (Williams & Bindoff Reference Williams and Bindoff2003). An important cyclonic gyre transports water within the depression and can explain lowest sea surface temperature and salinity. Salinity might be more stable spatially than any other parameters in the neritic zone during the summer period, because of ice melt during spring and katabatic winds that modify the characteristics of the sea surface by changing water circulation, cooling the surface layer and creating upwelling that could bring cold and salty waters up to the surface.
General composition of euphausiid larvae
Our main objective during this study of the coastal zone from Terre Adélie to Mertz Glacier Tongue (MGT) in Eastern Antarctica was to assess the summer variability in abundance and development of euphausiid larvae. During our survey E. crystallorophias was the dominant euphausiid species, with a mean density of 10 ind. 100 m-3, while no larvae of Antarctic krill, Euphausia superba, were found. This confirms previous reports (Nordhausen Reference Nordhausen1994, Zhou et al. Reference Zhou, Nordhausen and Huntley1994, Kirkwood Reference Kirkwood1996, Falk-Petersen et al. Reference Falk-Petersen, Sargent, Lønne and Timofeev1999) showing that E. crystallorophias is restricted to the near-coastal waters of Antarctica where it is the dominant species of euphausiid.
Some specimens of the oceanic species Thysanoessa macrura were observed. This species had a mean density of 1 ind. 100 m-3 over the entire study area. Spawning of E. crystallorophias occurs earlier in the year than E. superba (Fevolden Reference Fevolden1979, Reference Fevolden1980, Hosie & Kirkwood Reference Hosie and Kirkwood1986, Harrington & Thomas Reference Harrington and Thomas1987, Kirkwood Reference Kirkwood1996, Daly & Zimmerman Reference Daly and Zimmerman2004), thereby reducing competition for food between the larvae of these species (Makarov Reference Makarov1979, Fevolden Reference Fevolden1980). This also seems to be the case in our study where E. crystallorophias and T. macrura seem likely to have spawned earlier than E. superba, according for the lack of larvae of this last species in our samples.
Composition of developmental stages
Euphausia crystallorophias requires 150 to 180 days to develop from the egg to furcilia VI if the food supply is adequate (Ikeda Reference Ikeda1986, Harrington & Thomas Reference Harrington and Thomas1987, Kirkwood Reference Kirkwood1996). During this investigation, the calyptopis I was by far the most common stage of E. crystallorophias, with only a few metanauplii, calytopis II and III, and furcilia I and VI observed. This observation suggests a recent spawning in this species. Several authors (Fevolden Reference Fevolden1979, Reference Fevolden1980, Hosie & Kirkwood Reference Hosie and Kirkwood1986, Harrington & Thomas Reference Harrington and Thomas1987, Kirkwood Reference Kirkwood1996, Daly & Zimmerman Reference Daly and Zimmerman2004) also noted a large January peak of E. crystallorophias calyptopis I to III in the Southern Ocean. It seems that, as suggested by Fevolden (Reference Fevolden1980), the spawning season of this species possibly occurred in December in the study area. Moreover, Pakhomov & Perissinotto (Reference Pakhomov, Perissinotto, Battaglia, Valencia and Walton1997) found that spawning for E. crystallorophias coincided with the opening of coastal polynyas. However, because of the presence of furcilia I and VI in this study area, especially near the MGT where the polynya developed, we suggest that the spawning period of E. crystallorophias may have started earlier, in September 2003. If the food supply was not adequate in September 2003, it is possible that the furcilia I and VI recorded in the present study may have overwintered from the previous summer spawning.
The larvae of Thysanoessa macrura were older than those of E. crystallorophias. Larvae of T. macrura were mostly at the furcilia I, II and III stages. T. macrura is believed to be an oceanic species. Its development involves the sinking of eggs to great depth and the subsequent developmental ascent of larvae (Marr Reference Marr1962, Hempel et al. Reference Hempel, Hempel and de Baker1979, Harrington & Thomas Reference Harrington and Thomas1987), similar to E. superba (Marr Reference Marr1962). The 200 m net tows we used may have missed the early stages of T. macrura since nauplius, metanauplius and calyptopis stages of T. macrura are concentrated at depths greater than 200 m (Makarov Reference Makarov1979, Harrington & Thomas Reference Harrington and Thomas1987). This may explain why we found calyptopis I of T. macrura at station 2 where the depth was only 166 m, because they could not sink deeper. Moreover, because the most common stages observed were the first three furcilia stages, spawning by T. macrura must have occurred some months earlier. This is consistent with Makarov (Reference Makarov1979) and Hosie & Kirkwood (Reference Hosie and Kirkwood1986) who noted early spawning in September with a protracted spawning season. Thus, it is probable that the calyptopis I stages were derived from later spawning than those of the furcilia larvae.
Spatial distribution of euphausiid larvae
Euphausia crystallorophias larvae were found mainly over the Adelie Bank and near Dumont d'Urville, where the depth was the shallowest. A patch was also found near the MGT (station 17: deep depth, high SSS and very low SST) with a maximum abundance reaching 37.6 ind. 100 m-3. According to previous observations in different regions of the Southern Ocean, the spatial distribution is very patchy for all stages of the life cycle of this species (Fevolden Reference Fevolden1979, Reference Fevolden1980, Kittel & Stepnik Reference Kittel and Stepnik1983, Hosie & Kirkwood Reference Hosie and Kirkwood1986, Brinton & Townsend Reference Brinton and Townsend1991, Hosie Reference Hosie1991, Pakhomov & Perissinoto Reference Pakhomov, Perissinotto, Battaglia, Valencia and Walton1997). Menshenina & Spiridonov (Reference Menshenina and Spiridonov1991) found an inverse relationship between the mean water temperatures at which different species of euphausiid were collected and their larval duration. Thus, the slow larval development of E. crystallorophias may result from the fact that it is a cold-water stenothermic species, restricted to water temperatures of less than 0°C (Kirkwood Reference Kirkwood1996). The RDA also showed that E. crystallorophias larvae were more influenced by abiotic than biotic factors (Fig. 8a). However, in this investigation, E. crystallorophias larvae were found in higher abundance over the Adélie Bank where the SST was higher than 0.2°C. Furthermore, the distribution of E. crystallorophias larvae was significantly correlated with depth or SSS, but not SST. This could be explained by the relationship between the spatial distribution of E. crystallorophias larvae and their development stages. Calyptopis I, the most common development stage of E. crystallorophias, was negatively correlated with depth and was found mostly in shallower waters over the Adélie Bank (station 37: abundance = 33 ind. 100 m-3, depth = 194.5 m), and near Dumont d'Urville (station 2: abundance = 29 ind. 100 m-3, depth = 166 m) (Fig. 5b). In both areas, SST and SSS were highest (station 37: SSS = 34, SST = 0.21°C; station 2: SSS = 34.3, SST = 0.26°C, Fig. 2a). However, the distribution of calyptopis II, III and furcilia VI stages corresponded more with the definition of cold-water stenothermic species as by Kirkwood (Reference Kirkwood1996). Maximum abundance of these developmental stages occurred near the MGT in deeper water (depth = 1023 m) where SST was lowest (-0.88°C). Younger development stages of E. crystallorophias were found in the western part of the study area (metanauplius and calyptopis I stages) and older stages in the eastern part near the MGT (calyptopis II and III and Furcilia VI).
In contrast, T. macrura larvae were observed at higher abundance in the eastern part of the study region, where the sea surface salinity was low. As with E. crystallorophias, the distribution of development stages of T. macrura followed a gradient from west to east, with calyptopis I occurring near Dumont d'Urville and furcilia VI observed near the MGT. These spatial distributions of development stages of both E. crystallorophias and T. macrura larvae could be explained by the physical differences of the eastern and western parts of the study area. In fact, the water circulation by gyres near the MGT could be the key to euphausiid larvae accumulation of all developmental stages at the same place. In contrast, near Dumont d'Urville, wind will favour advection of larvae seawards, with young stages near the coast and older stages offshore. Nevertheless, the spatial distribution of T. macrura larvae was significantly correlated with biotic factors as chlorophyll a and nitrate concentrations. The negative correlation with nitrate, found in RDA analyses, is possibly a positive correlation with nitrate depletion during the season, which is in turn an index of the net community production for the season (Jennings et al. Reference Jennings, Gordon and Nelson1984).The positive correlation with chlorophyll a suggested that they are more dependent on phytoplankton stocks than the calyptopis stage of E. crystallorophias. Falk-Petersen et al. (Reference Falk-Petersen, Sargent, Lønne and Timofeev1999) highlighted that T. macrura is more herbivorous than E. crystallorophias in that it probably feeds more exclusively on phytoplankton, whereas E. crystallorophias is a typical omnivore – well adapted to utilize a bloom situation, to feed on microzooplankton or, when necessary, decaying organic matter (Falk-Petersen et al. Reference Falk-Petersen, Sargent, Lønne and Timofeev1999). It is also possible that diet requirements may change during development. Further diet studies on each developmental stage of euphausiid larvae may allow us to understand better the link between spatial distribution of euphausiid larvae and the biotic environment in the Southern Ocean.
Acknowledgements
We thank the Captain Yvon Guédez and the crew of the RS l′Astrolabe, Alain Pottier and Patrice Godon for logistics onboard and adaptation of l′Astrolabe for allowing scientific work. We also thank Patrice Pruvost and Camille White for help with the field work. Funding was provided by IPEV and Zone Atelier Antarctique (INSU-CNRS) to Philippe Koubbi. We also thank Anne-Sophie Quilliet for help with the laboratory work, Janine Cuzin, Jean-Philippe Labat and Stéphanie Sabini for their help with the taxonomic identifications. This work was supported by the Australian Government's Cooperative Research Centres Programme through the Antarctic Climate and Ecosystems Cooperative Research Centre (SW Wright). Work of Anne Goffart (MARE publication no. 149) was supported by BELSPO (Belgium) under contracts PELAGANT (EV/12/30A) and PADI (SD/BA/851).



