“‘Enthusiasm gap’ conveys the impression that it's all about who has the most yard signs, or who is screaming and shouting the loudest, or who is most inclined to talk politics around the water cooler.”
Nate SilverFootnote 1 October 6, 2010; fiverthirtyeight.com
The popular political narrative of 2010 is that a “tea-infused” Republican Party mobilized an angry electorate. Polls taken in the run-up to Election Day indicated that Republicans were more excited to vote than Democrats (Abramson, Aldrich, and Rohde Reference Abramson, Aldrich and Rohde2011, 298), and this was borne out at the polls. Although the turnout estimate of 41.6%Footnote 2 is typical of the long observed, lower participatory rates in off-year congressional elections (Campbell Reference Campbell, Campbell, Converse, Miller and Stokes1966; Flanigan and Zingale Reference Flanigan and Zingale2010; Glaser Reference Glaser, McPhee and Glaser1962; Hill Reference Hill2006), the portion of the voting electorate identifying with the GOP increased from 33% to 35% between 2008 and 2010, while the portion identifying with the Democrats decreased from 40% to 35% (all while the overall distribution of partisans in the broader public remained the same across years) (Abramson, Aldrich, and Rohde Reference Abramson, Aldrich and Rohde2011, 299).
As the quote in opening epigraph reminds us, “enthusiasm gaps” should be observed among committed partisans and activists who will nearly always vote but whose enthusiasm for a candidate may determine their willingness to engage in persuasive political dialogue around the water cooler, to volunteer for a candidate, or to post a sign in their front yard. Yet frequently “enthusiasm gap” has been used incorrectly to describe the different levels of success each party has in mobilizing peripheral voters to turnout to vote.
Thus, to examine the enthusiasm gap in the 2008 and 2010 elections, we argue that the appropriate evidence comes from nonvoting forms of participation. Although survey data often include batteries of these participatory acts, those self-reports are often susceptible to exaggerations and misreports. Instead, we examine the enthusiasm gap in its most visible manifestation: displaying yard signs in front of residential properties.
When compared to acts such as contributing money, voting, campaign volunteering, or attending rallies, displaying yard signs is perhaps the most public act of political participation. And, as tools of party mobilization, yard signs may convey political information to all residing in or passing through a space, and may produce responses, often leading to “sign wars.”Footnote 3 Indeed, for many people, neighborhood yard signs may be the way that political campaigns and election seasons are most directly experienced. We expect that both aggregate and individual-level patterns of this visible form of political participation will accord nicely with both the outcome and the received wisdom surrounding the last two national elections.
In the following sections, first, we introduce our study and its site. Then, we consider the factors that influenced the decision to display a sign in 2008 and 2010 (both in terms of individual-level and neighborhood-level characteristics), and most importantly, examine which 2008 sign displayers declined to participate in this same way in 2010.
THE FRANKLIN COUNTY NEIGHBORHOODS AND ELECTIONS STUDY
To examine whether we see evidence of the 2010 enthusiasm gap in displaying yard signs, we rely on data from the Franklin County Neighborhoods and Elections Study (FCNES). We conducted the FCNES during the 2008 presidential election and the 2010 midterms in Franklin County, Ohio, home to the state's capital and largest city, Columbus. In addition to being located in a traditional bellwether state, Franklin County is politically competitive, as well as diverse and roughly representative of the American public (Hawkings and Nutting Reference Hawkings and Nutting2003);Footnote 4 it has been featured in several studies with empirical analyses (e.g., Beck et al. Reference Beck, Dalton, Huckfeldt and Nichols1994; Huckfeldt et al. Reference Huckfeldt, Beck, Dalton and Levine1995; Lacy Reference Lacy2001; Makse and Sokhey Reference Makse and Sokhey2010).
The first component of the FCNES is an observational study of yard sign placements on single-family, residential properties in a random sample of precincts throughout the county.Footnote 5 During the 2008 general election period, we observed the posting of political signs in 30 Franklin County precincts by driving block-by-block during two weekends: immediately following the Republican National Convention (September 4–6), and one week prior to Election Day (October 24–27). In 2010, we revisited 18 of these precincts the weekend before Election Day—we were careful to make sure the precincts in this subset had variance on demographic characteristics.
Then, we combined our observational data with three sets of publicly available data. First, the observational data were merged into a geographic information system (GIS) shapefile provided by the office of the Franklin County Auditor—this allowed us to associate the observational data with a specific spatial location. Second, as the official voter file from the Franklin County Board of Elections identifies each registered voter and their place of residence, we obtained a record of the registered voters associated with each location in each year. Third, block-level data from the 2000 Census were merged into the shapefile.Footnote 6 Before analysis, the 2008 and 2010 datasets were investigated to flag properties whose residents changed between the two elections.
The second component of the FCNES was a 2008 mail survey sent to addresses where we observed a yard sign. Because many other survey instruments ask respondents about yard sign displays in a broader context of political participation (and thus could be used to predict who participates in this manner), we targeted only individuals who did display a sign. Although this flies in the face of conventional wisdom about “selecting on the dependent variable,” this sampling strategy is similar to other studies of specific participatory acts, such as campaign donors (e.g., Claassen Reference Claassen2008), protest participants (Verhulst and Walgrave Reference Verhulst and Walgrave2009), and political rally attendees (Sanders and Kaid Reference Sanders and Kaid1981). The survey asked respondents about their political preferences, neighborhood and broader social networks, and motives for posting yard signs. The total response rate for the survey was 33.7% (1,119 out of 3,320). After excluding respondents whose properties were not observed in the 2010 wave, we were left with 810 usable surveys.
ENTHUSIASM ILLUSTRATED: A PRECINCT IN TWO ELECTIONS
To better convey the nature of the observational data and to illustrate differences across 2008 and 2010, figure 1 features two maps of Precinct 1028F. The precinct is a racially diverse, middle-class neighborhood on Columbus' East Side (which is the home of Columbus' African American mayor, Michael Coleman), and which voted for President Obama by a 78%–21% margin in 2008. As seen in the 2008 graphic, this neighborhood was highly enthusiastic about the Obama campaign, with 19% of all houses displaying a sign for Obama or other Democratic candidates (the second-highest figure among our 30 sampled precincts).
Yard Sign Displays in Columbus Precinct 1028F, 2008 and 2010
Note: Source: FCNES. Properties marked black display any partisan GOP sign, and those marked blue any partisan Democratic sign.

However, in 2010 the number of Democratic signs dropped precipitously to only 3% of properties. Nonetheless, turnout among registered voters in the precinct fell only from 79% to 69% (compared to a decline from 67% to 48% countywide), and the precinct voted 76%–24% for the Democratic gubernatorial candidate. In other words, the decline in enthusiasm in this neighborhood, while stark, appears to have had little effect on the act of voting. Conventional datasets, which focus on turnout and vote choice, might not even detect an enthusiasm gap in this instance, but by our reckoning, the drop in “enthusiasm” in this neighborhood may be larger than in just about any other in our study.
PREDICTING THE PRESENCE OF A YARD SIGN IN 2010
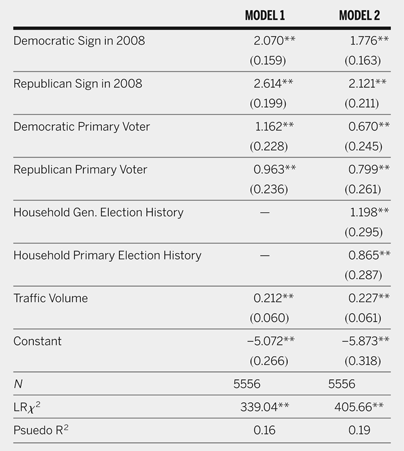
Looking at things more systematically, we begin by attempting to account for household decisions to post signs across the two elections. In table 1, we present a logistic regression analysis, investigating which households in the 18 “panel” precincts were more likely to display a sign during the midterm election season. To assess the impact of enthusiasm—benefiting the Democrats in 2008, but then the Republicans in 2010—we include two dummy variables indicating whether a household displayed a Republican sign in 2008 or a Democratic sign in 2008. We expect that both groups will be considerably more likely to post signs in 2010 than households who did not post a sign in 2008,Footnote 7 but that repeat behavior will be much higher in McCain households. To ensure accurate comparisons, households whose residence changed between 2008 and 2010 were excluded from the analysis.Footnote 8
The Probability of a Property Displaying a Yard Sign during the 2010 Midterm Elections (Logitistic Regression Estimates)

* p < 0.05,
** p < 0.01.
Standard errors in parentheses.
Source: FCNES, and publicly available records.
We also allow for a second source of variation between Republicans and Democrats: the propensity to post a sign in 2010 given previous partisan participation. As such, we include two dummy variables reflecting the best indicator of partisanship in publicly available data: voting in past primaries.Footnote 9 Households whose voters participated in at least one Democratic primary are indicated by the dummy variable Democratic primary voter, while those who voted in at least one Republican primary are indicated by the variable Republican primary voter.Footnote 10 Finally, as we might expect that people post signs so that other people can see them, we include a control designed to capture visibility: traffic volume is an ordinal measure of the property's location with respect to other streets and roads (from dead end to major thoroughfare).Footnote 11
Looking at the estimates in model 1,Footnote 12 we see that all variables are statistically significant and positive predictors of 2010 yard sign display. As predicted, the coefficient size on posting a Republican sign in 2008 is noticeably larger than the coefficient for posting a Democratic sign in 2008.
In substantive terms, 2008 behavior is the best predictor of 2010 behavior. Although the partisan composition of the electorates may have been different, participation of any form in a midterm election following nonparticipation in a presidential year would be considered unusual. And, posting a yard is a low-probability activity. Indeed, the model predicts that holding property traffic volume at its mean, the probability of posting a sign in 2010 for primary-voting households who did not post a sign in 2008 is only about 3%; this drops to just more than 1% for other households. However, the substantive effect of 2008 behavior is much larger (and a “gap” emerges by party): among Republican households who did display a sign in 2008, the probability of posting a sign in 2010 jumps to 28%; this probability also increases among Democratic households who displayed a sign in 2008, but only to 21%.
Model 2 replicates the estimates of model 1, but includes two additional variables. Because we expect the participatory act of displaying a sign to manifest at higher rates among those who participate more generally, we include controls for the average levels of general election participation and primary election participation among members of a household.Footnote 13 The key result from model 1 holds: Republican households that displayed a sign in 2008 were significantly more likely—compared to Democratic households previously displaying a sign—to display a sign in 2010.
INDIVIDUAL CHARACTERISTICS AND REPEAT DISPLAYS
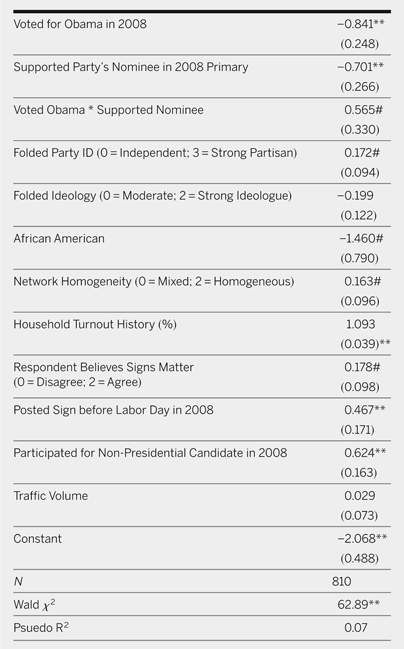
We know something about correlates of yard sign displaying in 2010, but what types of individuals displayed yard signs during both the midterm and presidential elections? To address this, in table 2 we turn to the 2008 mail survey component of the FCNES. In late fall 2008, we sent questionnaires to all households in our sample where we observed a yard sign; the individual “most responsible” for displaying the yard sign(s) was instructed to fill out the survey. The analysis that follows is based on the households from which we received completed surveys.
Predictors of Whether 2008 Yard-Sign Displaying Properties Displayed a Sign in 2010 (Logit Regression Estimates)

# p < 0.10,
* p < 0.05,
** p < 0.01.
Robust standard errors in parentheses.
Source: FCNES, and publicly available records.
Overall, about 33% of survey respondents displayed a partisan sign again in 2010: by party, this breaks down to 30% of Democrats versus 39% of Republicans, which again suggests the presence of an enthusiasm gap between the parties. Table 2 presents the results of a logistic regression model, predicting whether each 2008 respondent displayed a yard sign would do so again in 2010.
Looking first at political factors, the partisan difference persists in the multivariate analysis: Democrats (or more precisely, individuals who voted for Obama in 2008) were less likely to repeat their sign-displaying behavior in 2010. Strong partisans (on a standard seven-point party identification scale) were also significantly more likely to post a sign again. We also observe an interesting pattern related to primary support in the 2008 election: supporters of the eventual nominee in 2008 were actually less likely to display a sign in 2010, which was an effect particularly pronounced on the Republican side. This makes sense because voters who display a sign despite their preferred candidate not winning the nomination are the true party loyalists. We also find that African American voters—who were in many cases (at least by conventional wisdom) mobilized specifically by the Obama campaign—were drastically less likely to display a sign in 2010.
We also find a number of links between participatory attitudes and behaviors and the propensity to display a sign again in 2010. Voters with politically homogeneous discussion networks were significantly more likely to display a sign again—something that echoes research suggesting that agreeable interpersonal networks promote political participation (e.g., Mutz Reference Mutz2002; Reference Mutz2006). Individuals who displayed their 2008 signs earlier in the election season (before Labor Day) were also more likely to display signs again in 2010. Individuals who reported participating on behalf of a nonpresidential candidate in 2008 were substantially more likely to display a sign in 2010. Finally, respondents who expressed a belief that yard signs actually influence voters were more likely to display a sign.
Together, these patterns are consistent with the electoral dynamics of the past two major elections. In our study, Democratic sign-displayers in 2008 were a disparate collection of strong partisans and Obama loyalists—as such, maintaining a higher level of enthusiasm in the pro-Republican environment of 2010 proved significantly more difficult. Conversely, it appears that 2008 Republican sign-displayers were a much more cohesive group whose enthusiasm was maintained at both higher and more consistent levels in 2010.
NEIGHBORHOOD CHARACTERISTICS AND SIGN DISPLAYS
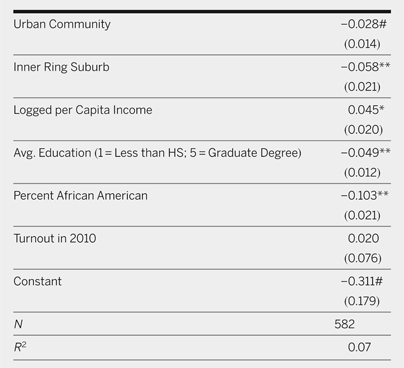
Lastly, we consider the relationship between neighborhood characteristics and sign-displaying patterns (Huckfeldt and Sprague Reference Huckfeldt and Sprague1992) using Census block-level geographic, political, and demographic characteristics;Footnote 14 this draws on a broader tradition of work looking at political behavior and attitudes within varying contexts (Huckfeldt Reference Huckfeldt1986; MacKuen and Brown Reference MacKuen and Brown1987; Putnam Reference Putnam1966). Overall, about 14% of properties in our sampled precincts displayed a yard sign in 2008: that number falls to about 6% in 2010. However, the partisan breakdown of signs changed significantly across the two electoral contexts: 65% of properties with signs had Democratic signs in 2008, while 57% had Democratic signs in 2010.Footnote 15 Put differently, the percentage of properties with Democratic signs dropped by 64%, while the percentage of properties with Republican signs only dropped by 50%.
Table 3 presents an OLS model in which the dependent variable is the relative change in the prevalence of Democratic and Republican signs (positive values of the dependent variable indicate more Democratic signs in 2010, although this was very uncommon):
 $$
\displaylines{
{\rm Relative Change} = {\rm (\% D sign in 2010} - {\rm \% R sign in 2010)} \cr
- {\rm (\% D sign in 2008} - {\rm R sign in 2008)} \cr}
$$
Change in Democratic Share of Yard Signs, 2008–2010, by Census Block (OLS Regression Estimates)

# p < 0.10,
* p < 0.05,
** p < 0.01.
Robust standard errors in parentheses. Reference group for geography is “Outer Ring Suburb.”
Source: FCNES, and publicly available records.
The results of the multivariate analysis show that the decline in Democratic fortunes was particularly strong in some of the neighborhoods where Obama made inroads in 2008: among inner-ring suburbs and highly educated areas. In both of these types of Census blocks, the number of Democratic signs displayed dropped steeply, while the number of Republican signs decreased less severely, stayed the same, or even increased. In two traditional Democratic strongholds—urban neighborhoods and neighborhoods with many African American voters—the relative prevalence of signs also shifted: in these cases, the shift was mostly driven by a decrease in Democratic signs. Finally, we observe that there is no direct relationship between turnout in 2010 and the changes in patterns of yard sign displays, which again echoes our earlier findings.
CONCLUSION
Our examination of yard signs in 2008 and 2010 reflects two aspects of the conventional wisdom that simultaneously shaped broader participatory patterns in these elections. On the one hand, participation of all forms drops dramatically in off-year elections. On the other hand, political environments shift—in the case of this period, the shift was from a pro-Democratic mood in 2008 to a pro-Republican mood in 2010. These two elections were the second and third of three straight “wave” elections, in which one party's widely anticipated electoral advantage led to stronger candidate recruitment, fundraising, and ultimately, a decisive victory on Election Day.
However, this analysis reminds us that declines in voter turnout and nonvoting participation are both conceptually and geographically distinct. In more politically active neighborhoods, we observe the enthusiasm gap in people's front yards, although turnout and voting patterns do not change drastically. In less politically active neighborhoods, the visible changes are subtle, while the changes in turnout can be more drastic. This latter pattern does not reflect an enthusiasm gap, but a failure to mobilize peripheral voters. That does not mean, of course, that the two patterns are unrelated. Surely, enthusiasm gaps among highly engaged voters are manifested in participatory acts beyond posting yard signs and, in turn, lead to disparities mobilization among peripheral voters. The two concepts, however, are distinct and should not be conflated in popular discussion.
Data on the prevalence of yard signs are an unconventional source of information on political participation, and the collection of such data poses certain logistical challenges. However, these data constitute an untapped resource that can complement survey and electoral studies, which are sources plagued by limitations ranging from ballot secrecy and ecological inference problems to misreporting and social desirability biases. In the future, we imagine similar data being readily collected through high-resolution and real-time satellite imagery (e.g., Google Earth). We hope that this research article will call attention to the value of this data source, especially in the context of studying rapidly shifting patterns of momentum in the electorate. Given the extent to which the recent prevalence of wave elections has made the discussion of enthusiasm gaps a common part of the public discourse, we find it foolhardy to overlook one of the most public and conspicuous sources of information on voters' enthusiasm.