I. INTRODUCTION
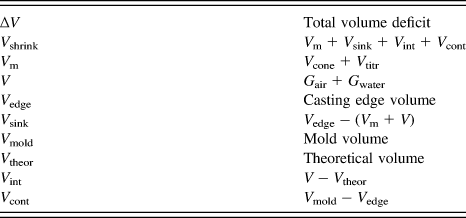
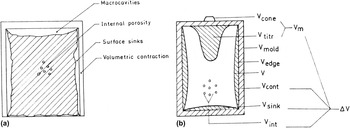
Volume deficit is of major concern in the foundry industry. The present study mainly focuses on predicting and controlling the volume deficit in cast aluminum alloys. Patterson and EnglerReference Patterson and Engler1 have classified the technical volume deficit into four, namely macrocavities, V m; internal porosity, V int; surface sinks, V sink; and volumetric contraction, V cont. These are explained in detail in Table I. The volume deficit classification and description are given in Figs. 1(a) and 1(b). When molten metal is poured at a particular pouring temperature into the mold, the metal cools down to a certain extent before the mold is filled, so during pouring itself shrinkage occurs to a small extent. The effects of mold dilation and mold deformation which occur during the cooling of the molten metal are to be considered. The volume deficit depends on both casting conditions and casting material,Reference Sundarrajan, Roshan and Ramachandran2 and it can be determined by calculating macrocavities, internal porosity, surface sinking, and volumetric contraction of the respective casting. Generally, macrocavity takes the conical shape and is the last portion to be solidified in the casting. Sauerwald had stated that the theoretically volumetric contraction is calculated as the sum of change in lengths of the casting in all directions.Reference Brown3 Surface sinking in the casting occurs due to the variation in pressure between atmosphere and solidifying liquid metal in the casting.Reference Campbell4 Internal porosity or microporosity is a defect due to amalgamation of shrinkage and liberation of gases during solidification.
Details of volume deficit.
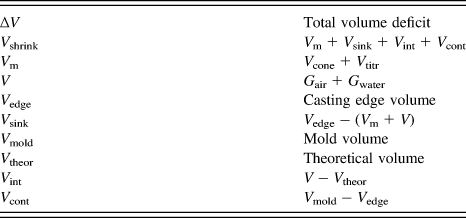
Classification of volume deficit. (a) classification of volume deficit; (b) description of volume deficit.

Due to the increasing use of aluminum castings, volume deficit characterization is useful for improving mechanical properties of the castings.Reference Viswanathan, Sabau, Han, Duncan, Porter and Dinwiddie5 The Al–Si alloys are the true workhorses of the aluminum alloy casting industry because of their excellent casting characteristics and fine strength.Reference Ravi6,Reference Heine, Loper and Philip7 Volume deficit or shrinkage is the most significant discontinuity in castings and arises due to the volumetric change that occurs when a liquid metal solidifies.8 Due to the contraction of the liquid metal, transformation of liquid to solid and contraction in the solid state result in shrinkage.Reference Campbell and Harding9 Thermal contraction of the solid during subsequent freezing also increases the risk of shrinkage if proper care is not taken in casting as observed by Eady and Smith.Reference Eady and Smith10 Li et al.Reference Li, Jolly, Campbell, Thomas and Beckermann11 state that the tendency to form shrinkage porosity is related to the liquid to solid volume fraction at the time of final solidification and the solidification temperature range of the alloy.
Any type/shape of an alloy can be produced using the sand casting technique. Sand mold's refractoriness helps to retain its shape and size and shows a slight expansion when subjected to high temperature for a long period. The sand casting technique is the most cost effective and design flexible process in the foundry industry.Reference Vijayaram12
ASTM E 15513 standard gives the criteria for acceptance and rejection of industrial castings and defines the “qualitative” amount of porosity allowable in a casting. The powerful and recent non destructive evaluation (NDE) technique that has been demonstrated to be most advantageous in the 3D diagnostics of volumetric porosity of castings is industrial x-ray computer tomography (XCT).Reference Losano, Marinsek, Marlo and Ricci14 The areas benefited by using XCT include internal dimensional measurements by eliminating destructive sectioning, specific region inspections, and characterization of defect to allow passing/informed repair of castings in critical regions and lastly geometry details for CAD. The quantitative evaluation capability of XCT allows an engineering assessment of castings based upon a correlation with performance.Reference Ye15
II. EXPERIMENTAL STUDIES
A. Volume deficit studies
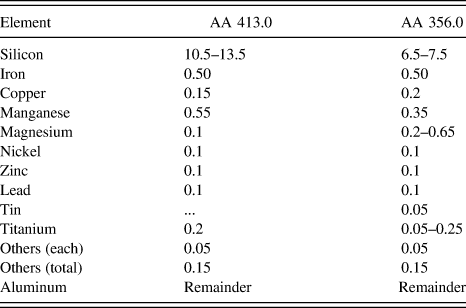
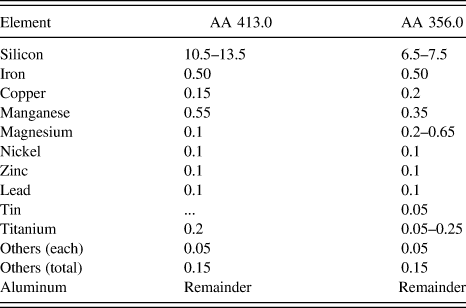
The parameters which affect the volume deficit and shrinkage in cast products areReference Sundarrajan, Roshan and Ramachandran2 thermal cooling conditions or use of chills, pouring temperature, casting shape, and alloy composition. The process parameters considered in this study are bottom chill, casting shape, and pouring temperature for calculating the volume deficit of AA 356.0 (Al–7Si–Mg) and AA 413.0 (Al–12Si) alloys. The chemical composition of the two alloys is provided in Table II as per the standard. The actual chemical composition of the two alloys is determined using a Baird optical emission spectrometer (at DRDL), and it is observed that the silicon composition for AA 413.0 alloy is 11.9% (Al–12Si).
Chemical composition (wt%).
Rectangle and cylinder casting shapes are considered for the present study and dimensional details for the same are provided in Table III. The rate of heat exchange depends on thermophysical properties of the liquid metal, the casting mold, the wall thickness of the casting and its shape.Reference Brown3 The study of bottom chill shows a significant difference in the casting characteristics, promotes directional solidification, and helps in eliminating shrinkage porosity defects. Mild steel chill is considered for the present study.
Dimensional details of castings considered.

Pouring temperatureReference Sundarrajan, Roshan and Ramachandran2 influences fluidity, porosity, strength, and structure of the casting. A pouring temperature (T, melting point of the respective alloy) with 50 °C super heat (T + 50 °C) is considered. Additional pouring temperature increases the fluid life of the liquid metal.Reference Shepel and Paolucci16
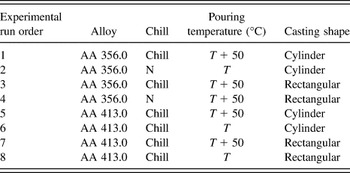
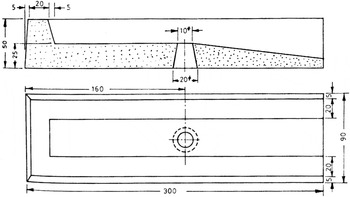
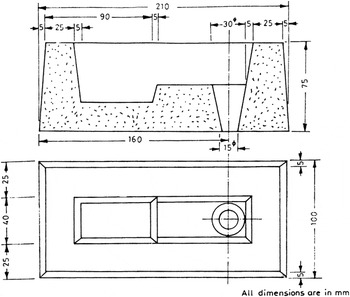
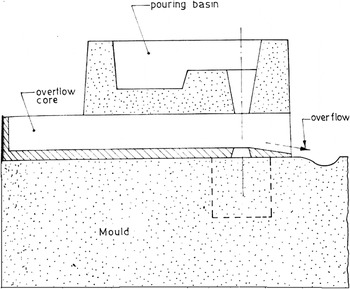
Alloys used in the present investigation are AA 356.0 and AA 413.0, and the number of experiments conducted for studying the volume deficit characteristics has been given below in Table IV. A schematic diagram of the pouring basin, the overflow core, and the volume deficit experiment are provided in Figs. 2–4.Reference Patterson and Engler1,Reference Sundarrajan, Roshan and Ramachandran2 The present study calculates the volume deficit characteristic of aluminum alloy castings, which will help the foundry industry in predicting and controlling the volume deficit. Proper care has been taken by maintaining constant pouring height throughout the molten metal pouring to avoid turbulence and difference in surface oxidation and oxide pickup.
Experimental plan.

Details of the pouring basin.

Details of the overflow core.

Schematic diagram for the volume deficit experiment.

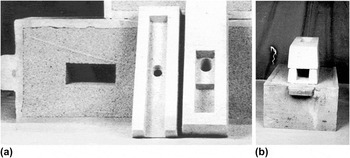
The overflow core is placed over the mold to ensure that only a fixed quantity of the liquid metal is poured each time into the mold. A schematic diagram of the testing arrangement for volume deficit experimentation is shown in Fig. 4. Figures 5(a) and 5(b) show the photograph of the prepared mold for rectangular-, cube-, and cylinder-shaped castings, the overflow core, and the pouring basin; and the assembled mold for the volume deficit characteristic. Molds are prepared using the green sand process consisting of bentonite (5–6% of sand weight) and water (5–8% of sand weight). The moisture level is adjusted in such a way that compatibility measured with a + GF + compatibility meter is maintained between 45% and 50%, permeability is maintained between 400 and 500, and the green compression strength is in the range of 700–900 g/cm2. The mold hardness is in the range of 75–80 on B scale.
(a, b) Prepared molds and the assembled mold for volume deficit.

The alloys are melted in an electric resistance furnace of capacity 20 kg provided with a mild steel crucible. Each alloy melting is done with their respective batch (belonging to the same amount of heat). The temperature is measured with the help of a thermocouple. The furnace is put off and the crucible is lifted and put in a tilting device. The metal is tapped into a smaller crucible for pouring into the mold. The pouring height is maintained constant throughout the pouring process to avoid turbulence and difference in surface oxidation and oxide pickup.
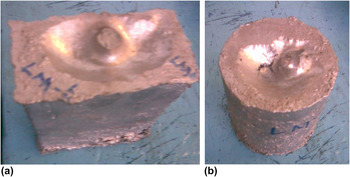
For the volume deficit characteristic experimentation, the liquid metal is poured into the pouring basin and the pouring is stopped as soon as the metal overflows. Figures 6(a) and 6(b) show the rectangle-, cylinder-, and cube-shaped solidified castings of the volume deficit characteristic experiment.
(a, b) Solidified castings of volume deficit experiment.

B. X-ray computer tomography
All the 8 castings are subjected to x-radiography to find the location and distribution of shrinkage and porosity.Reference Prucha and Nath17 The presence of internal closed porosity is observed by the x-radiography in the casting for the experimental run order 8. By using the XCT tool, quantification of internal closed porosity of castings is arrived at.
1. Test plan for XCT inspection
AA 413.0 aluminum alloy casting is subjected to XCT. The test plan for the XCT is given in Table VII. XCT analysis and its sensitivity relative to conventional film radiography of defective aluminum alloy sand casting have been studied. Table V gives the part identification number assigned for the program and the defect is graded as per the ASTM E155.13
Details of the castings considered for XCT.

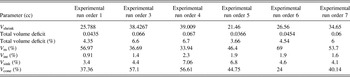
Volume deficit values.

2. System description
X-ray-based industrial CT system has been utilized for tomography of the castings.Reference Muralidhar, Siva Rao, Kumaran, Subramanian, Vijaya Lakshmi, Lukose and Venkata Reddy18 This CT is a 6-axes CNC manipulator-based XCT system.
XCT is done using DRDL's indigenously developed 450 kV x-ray industrial computer tomography system. The system consists of a 450-kV x-ray source, 256-channel detector array with an 18-bit dynamic range and a 6-axes mechanical object manipulator. The resolution of the system is 500 µm with 1-mm slice thickness.Reference Muralidhar, Siva Rao, Kumaran, Subramanian, Vijaya Lakshmi, Lukose and Venkata Reddy18,19
III. RESULTS
A. Quantification of volume deficit
The volume deficit is calculated by considering the following parameters.
(i) When molten metal is poured at a particular pouring temperature into the mold, the metal cools down to a certain extent before the mold is filled. The assumption of instantaneous filling of the mold is not realistic since shrinkage occurs to a small extent during pouring itself.
(ii) The effects of mold dilation and mold deformation which occur during the cooling of the molten metal are taken into consideration in the volume deficit calculation.
To minimize the casting defects information regarding the total volume deficit and its distribution is critical. Test castings have been analyzed to determine the volume deficit and its distribution by using the following procedure:
(i) The test casting is taken out of the mold and the cone portion is cut off. The volume of the pipe is measured by keeping the casting under a burette, and distilled water with the wetting agent is dropped into the cavity till it is completely filled.Reference Sundarrajan, Roshan and Ramachandran2 The titration volume V titr is read from the burette. The macrocavity, V m, is given by
 $${V_{{\rm{macro}}}} = {V_{{\rm{cone}}}} + {V_{{\rm{titr}}}}\quad .$$
(ii) The average length, width, and thickness of the test casting is measured using a Vernier caliper.
 $${V_{{\rm{edge}}}} = {\rm{length}} \times {\rm{width}} \times {\rm{thickness}}\quad {\rm{.}}$$
(iii) The weight of casting in air and water is determined using a sensitive balance of accuracy 0.001 g.
 $$V = {\rm{(weight\; in \;air}} - {\rm{weight \;in \;water)}}\quad {\rm{.}}$$
The surface sink is given by
 ${V_{{\rm{sink}}}} = {V_{{\rm{edge}}}} - {\rm{ (}}{V_{\rm{m}}} + V{\rm{)}}$.
(iv) The theoretical volume, V theor, is obtained as follows:

 $${V_{{\rm{theor}}}} = {\rm{weight\; in \;air/theortical\; maximum \;density \;obtained \;from\; the\; chill \;specimen\quad. }}$$
The internal porosity V int is computed as V int = V − V theor.
(v) The volumetric contraction V cont is calculated as
 $${V_{{\rm{cont}}}} = {V_{{\rm{mold}}}} - {V_{{\rm{edge}}}}\quad ,$$
where V mold is the volume of the mold, which has been calculated before pouring.
(vi) The volume deficit is given by
 $$\Delta V = {{{V_{\rm{m}}} + {V_{{\rm{sink}}}} + {V_{{\rm{cont}}}} + {V_{{\mathop{\rm int}} }}} \over {{V_{{\rm{mold}}}}}}\quad .$$
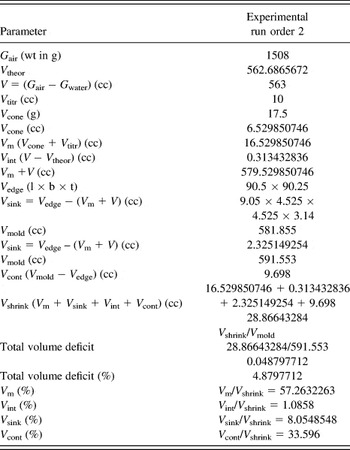
The volume deficit for the experimental run order 2 is calculated using the above procedure and is given in Table VI.
Volume deficit calculation for experimental run order 2.

The total volume deficit is calculated for the remaining experimental run orders in a similar way. The volume deficit values for AA 356.0 and AA 413.0 are given in Table VII.
For the experimental run order 8, the V macro values are very less. This value has been quantified using the x-ray computer tomography (XCT).
B. Calculation of internal closed porosity
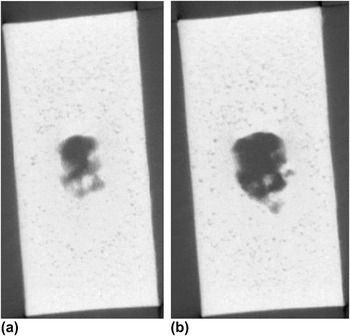
The casting images produced from the XCT diagnostic analysis are not photographic images but digital reconstructions of XCT scan data. These images are thus capable of revealing features of interest on the surface or at any position within the interior bulk of the original casting. Shrinkage cavities are concentrated mainly around the center of the casting.
The image presented by the imaging system appears like a shadowgraph of an object with compressed 3D structure on a 2D plane. Along one horizontal line of the image, the density data is uncompressed and extended out over an area. An image of the cross-sectional density of the casting begins to develop when the test casting is rotated and similar density data for the same linear slice is collected and overlaid. XCT slices through several locations of both castings and is shown as a set of images. These images are projections of the casting, representing pixel by pixel the absorption coefficient of the material crossed by x-rays. From these scans, cross-sectional images (i.e., slices) of the material dimensions are obtained.19 To provide a 3D view of internal structural details of casting, a number of slices through the casting are reconstructed. To provide a thorough understanding of the casting, slicing and manipulation of the 3D image can be done.
For experimental run order 8, the starting location of the shrinkage pore is 26 mm from the flat bottom and spreads up to 36 mm from the flat bottom. The images at 28 and 30 mm from the bottom for experimental run order 8 are shown in Figs. 7(a) and 7(b).
(a, b) XCT images of experimental run order 12.

1. Construction of 3D internal closed porosity
AA 413.0 is a short freezing range alloy. The porosity or shrinkage takes the form of large internal closed porosity. This is due to inadequately fed thermal centers or could be due to the molten metal being cut off by the merging of parallel solidification fronts.
The XCT technique can visualize the porosity within the given slice and morphology of each individual pore. Typically pore sizes found in industrial casting are in the 10–103 µm size range. The XCT images may be imported into CAD software. It is difficult to output the volume of the internal closed porosity in the casting because it is 2D XCT. Therefore, the shrinkage pore areas of the XCT image at various locations are imported into SolidWorks software.
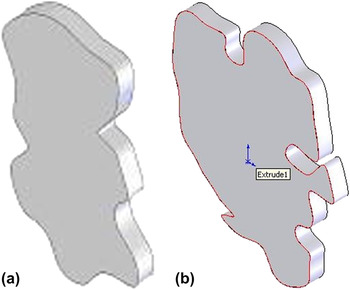
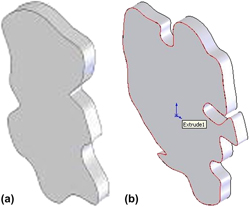
The large tolerance level (0.1 mm) in the foundry process is the same as that in XCT.Reference Ye15 XCT data have been converted to the solid model part (sldpart) file format. Figures 8(a) and 8(b) show constructed porosity of the experimental run order 8 using SolidWorks software.
(a, b) Constructed porosity of experimental run order 12.

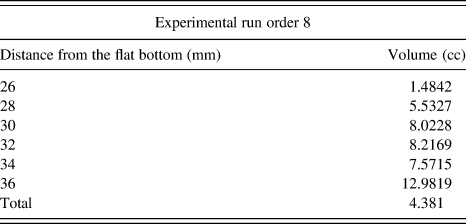
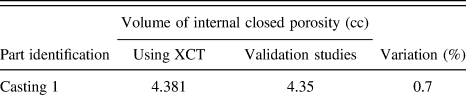
The total volume of internal closed porosity for the experimental run order 8 at 26–36 mm is given in Table VIII.
Volume of internal closed porosity for experimental run order 8.
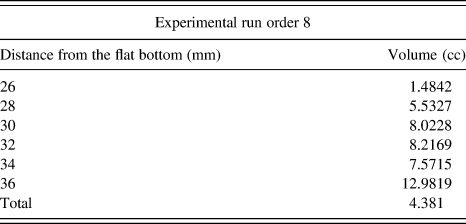
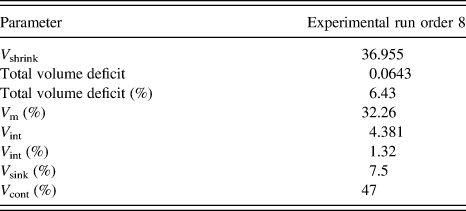
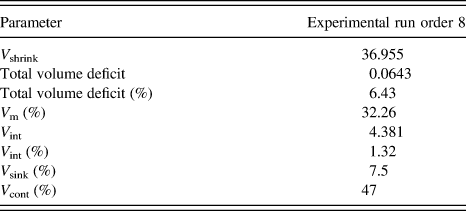
The internal closed porosity values of experimental run order 8 have been used for calculating the total volume deficit of the casting. The total volume deficit of the casting is given in Table IX.
Volume deficit for experimental run order 8.
2. Estimation of internal closed porosity using validation studies
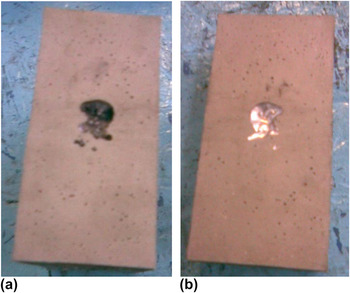
Evidence of internal closed porosity revealed by XCT of castings for experimental run order 8 is validated through destructive testing of castings as given in Figs. 9(a) and 9(b). The casting samples have been sectioned based on the XCT data to show the actual internal closed porosity. For measuring the volume of the internal closed porosity of the casting, it is kept under a burette, and distilled water is dropped into the cavity until it is completely filled.Reference Sundarrajan, Roshan and Ramachandran2
(a, b) Sectioned castings of experimental run order 8.

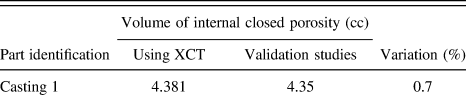
The titration reading gives the volume of the internal closed porosity of the respective casting, and these are in agreement with XCT data as shown in Table X.
Volume of internal closed porosity—a comparison.
IV. DISCUSSION
A. Influence of process parameters on volume deficit
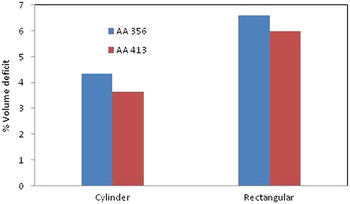
The volume deficit of an alloy depends on the shape of the casting. For practical reasons, the casting shapes considered are cylinder and rectangle. The total volume deficit decreases with change in shape from thin to thick castings as shown in Fig. 10 for AA 413.0 and AA 356.0 alloys.
Influence of process parameters on volume deficit.

The rectangle-shaped castings show more volume deficit, which is thinnest among the castings considered. The total volume deficit is less for cylindrical-shaped casting (thickest). Macrocavities decrease with changes in the casting shape from thick to thin (Table VII) and are explained based on the solidification performance. The solidification of the casting in the localized areas is influenced by the shape of the casting because the edges play an important role in the heat extraction. The edges of the casting decide the formation of macrocavities. Relative solidification time affects the macrocavities (an increase in solidification time, increases the macrocavities). Cylindrical-shaped castings promote maximum macrocavities. The pressure difference between the internal pressure in the inside of the casting and the atmospheric pressure results in surface sinking of the casting. The cylindrical shape provides high resistance to atmospheric pressure. So there is less pressure difference in the cylindrical-shaped casting, hence less surface sinking. The rate of heat removal at the edges is lower in rectangle shape casting. Sinking surfaces draw the ends along with them, thereby resulting in an apparent decrease in the linear dimensions of the solidifying rectangular shape casting. This leads to higher volumetric contraction.
B. Influence of pouring temperature
The degree of super heat or the pouring temperature is a vital tool in the foundry industry in the manufacture of quality castings. Manufacturing of thin-walled castings requires high pouring temperature. The influence of the degree of superheat on the total volume deficit and its distribution are studied for pouring temperatures T and T + 50 °C.
The total volume deficit decreases with an increase in the pouring temperature as shown in Tables VII and IX. The main factor, which determines the size of a shrinkage cavity in a casting, is the temperature of the metal poured into the mold. Pouring temperature has the biggest influence on porosity of a casting. With increasing pouring temperature, the alloy remains in liquid state for a longer duration due to higher heat content and hence the liquid metal is available to compensate the normal solidification shrinkage.
With higher pouring temperature, there is a lower rate of heat extraction by the mold, and so the heat and feeding capacity of the molten metal increase, thereby influencing the freezing of the alloy. This causes even normally pipe-forming alloys to become pasty type (solidification does not proceed progressively inwards). The strength of the solidifying shell decreases with increased tendency toward pastiness. So the higher pouring temperature leads to decreased macrocavities.
The internal porosity V int shows a decrease with an increase in the degree of super heat of 50 °C. Higher pouring temperature may spread the hot spot, which is expected to reduce the tendency to form internal porosity. The internal porosity is influenced by the combined effects of bottom chill and pouring temperature. Hence, the effect of bottom chill is more predominant.
The pressure difference between the atmosphere and the internal pressure in the interior of the casting is very low, which is the main cause for surface sinking. The increase in pouring temperature increases the heat capacity of the molten metal; hence, more quantity of liquid metal is available to fill the mold.
The volumetric contraction increases with an increase in the pouring temperature. With higher pouring temperature, the molten metal contraction in liquid state is more. This is due to the lower rate of heat extraction at the edges. Sinking surfaces draw the ends along with them, resulting in an evident decrease in the linear dimensions of the solidifying castings as shown in Tables VII and IX.
C. Influence of silicon content
With an increase in the silicon content, volume deficit is reduced for AA 356.0 and AA 413.0 alloys as shown in Fig. 10, and it has been explained below.
1. Solidification of short and long freezing range alloys
a. Solidification of short freezing range alloy—AA 413.0
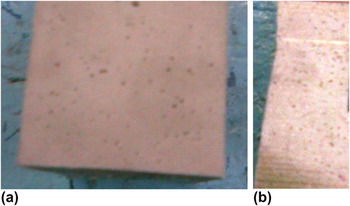
Deep pipes are formed at the top as feed metal is supplied, through the entire solidification interval as shown in Fig. 6(b) for AA 413.0 casting. Figure 12(a) shows internal porosity within the casting for sectioned rectangle shape.
(a, b) Internal porosity for rectangular shape castings.

b. Solidification of long freezing range alloy—AA 356.0
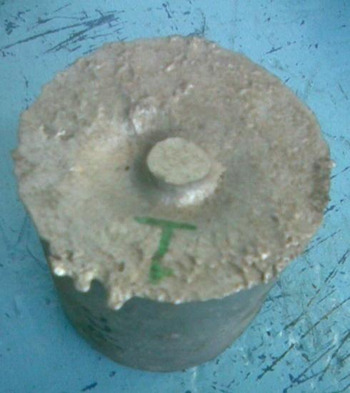
(i) More porosity is observed for AA 356.0 than AA 413.0 alloy and hence the pipe size is lesser for AA 356.0 as shown in Fig. 11. Increased external pressure minimizes internal porosity and results in more amount of pipe- or macrocavity.
(ii) Finely dispersed internal porosity exists throughout the entire casting section for AA 356.0 alloy as shown in Fig. 12(b). High conductivity alloys form a solid skin immediately after pouring, resulting in more amount of porosity and shrinkage cavities. The volume of porosity depends on the temperature difference existing between the center and outside of the casting.
Macroshrinkage of cylindrical-shaped casting AA 356.0.

2. Analysis using microstructure
The key to porosity and shrinkage configuration is pressure. As the liquid metal cools, it attains higher density because the thermal agitation of the molecules is less able to overcome the strong intermolecular forces pulling the molecules together, reducing the metal pressure. Internal porosity and shrinkage cavities are interacting volume deficits driven by supersaturated gas and negative metallostatic pressure, respectively.
As the casting solidification progresses, liquid metal needs to be in the center of the casting, but dendrites obstruct the liquid metal channels not allowing it to flow from the source. The liquid metal flows as a result of being pushed from the mold walls and pulled from inside of the casting. This results in hydrostatic tension in the center of the casting. These hydrostatic tensions are not desirable because they initiate nucleation and growth of shrinkage or gas porosity and also initiate the inward collapse of casting, which results in surface sinking or volumetric contraction.
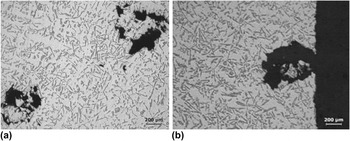
By reducing the hydrostatic tension in the center of the casting, the driving force for initiation of internal porosity and surface sinking can be reduced. AA 413.0 is a short freezing range alloy that solidifies with an even solidification front, and a shrinkage cavity is formed as shown in Figs. 13(a) and 13(b), ultimately to be forced by the inward growth of the smooth freezing front. In the case of short freezing alloys, the solidification gradually starts from the mold surface toward the thermal center of the casting.
(a, b) Scattered porosity and bouquet or cluster of shrinkage observed near the edge or at the macrocavities region at 50x magnification—AA 413.0.

The planar-front solidification turns out a sound skin extending to nearly the thermal center of the casting. At the end of solidification, liquid-to-solid shrinkage is constrained along the thermal centerline of the casting. The microstructure in the unetched condition shows the cluster of shrinkage porosity/cavity at or near the edge.
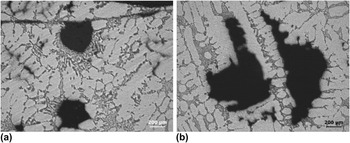
In the case of AA 356.0, the solidification is in the form of tangled mass of dendrites. When there is an insufficient amount of liquid metal, the dendrite mesh takes the liquid metal from the interdendritic region. This eventually leads to a cluster of shrinkage pores as shown in Figs. 14(a) and 14(b).
(a, b) Cluster of shrinkage observed near the edge at 50x magnification—AA 356.0.

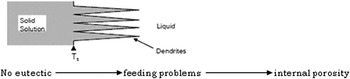
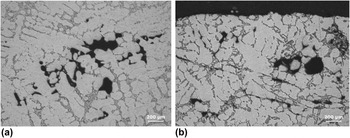
Once the dendrite mesh thickens, the interdendritic channels become narrow and gradually become more resistant to the flow of the residual liquid. The presence of eutectic liquid influences the interdendritic flow. As shown in Fig. 15, when there is no eutectic present, the tapering interdendritic lane toward the root of the dendrites increases the complexity of the final stage of the interdendritic flow. The long freezing channels create a problem for interdendritic feeding before the eutectic first appears resulting in microporosity. The effect of no eutectic present in the AA 356.0 alloy show more amount of internal porosity as shown in Figs. 16(a) and 16(b).
Interdendritic feeding—AA 356.0.

(a, b) Dispersed shrinkage and gaseous porosity observed near the edge or at the macrocavities region at 50x magnification—AA 356.0.

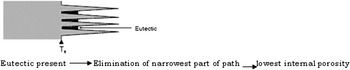
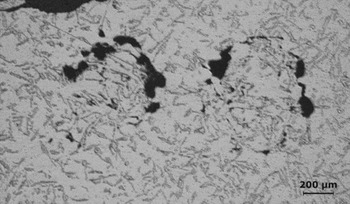
In Fig. 17 during cooling, the presence of eutectic liquid at the roots of the dendrites effectively truncates the final narrowest parts of the channels by solidifying on a planar front when the eutectic isotherm is reached. This influences the porosity content in the alloy. The presence of eutectic in AA 413.0 lowers the amount of internal porosity. Figure 18 shows less amount of internal porosity for alloy AA 413.0 than AA 356.0 alloy.
Interdendritic feeding—AA 413.0.

Scattered porosity at 50X magnification - AA 413.0.

During solidification of casting, if a region in the casting receives insufficient amount of liquid metal, then the liquid in this region solidifies either in the form of shrinkage/pore or in the form of volumetric contraction or surface sinking.
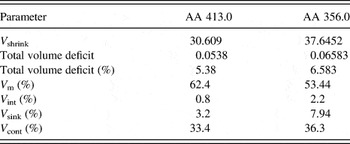
This causes the shell of the casting to collapse inwards due to hydrostatic tension. Internal reduced pressure in the liquid is relieved by the inward flow of the solidifying metal. The amount of volume deficit and its distribution in AA 413.0 and AA 356.0 alloys for cylindrical-shaped castings are given in Table XI.
Volume deficit distribution for cylindrical-shaped castings.

3. Analysis using radiographs
All the castings have been subjected to x-radiography as per ASTM E 155. Radiographic inspection is a nondestructive testing method for casting acceptability and evaluation. It reveals the presence of shrinkage, microporosity, and inclusions within limits of resolution. The interpretation of the radiographs of all these castings confirms the presence of some amount of macroporosity on the top and microporosity inside the castings. All the castings are of class D type as per ASTM E155 reference radiographs.
The photographs of the castings reveal the presence of macroshrinkage at the top of the casting. The photographs showing macroshrinkage for cylindrical-shaped castings of AA 413.0 and AA 356.0 are shown in Figs. 6 and 11. The 2 casting samples have been sectioned based on the x-radiography films, and data acquired from the volume deficit calculations specifies the actual internal porosity as shown in Figs. 12(a) and 12(b).
V. CONCLUSIONS
Internal closed porosity of rectangular shape casting has been calculated using the x-ray computer tomography, and it is successfully validated through sectioning of the casting. Bottom chill reduces the volume deficit for both shapes of castings; however, there is an increased rate of heat extraction from the metal, leading to increased compensation of solidification shrinkage during the pouring time of molten metal resulting in reduced volume deficit. With an increase in the pouring temperature, the alloy has high heat content, resulting in alloy being in liquid state for longer duration. So the liquid metal compensates the normal solidification shrinkage leading to lower volumetric contraction. The internal porosity V int decreases with an increase in the degree of super heat. Higher pouring temperature spreads the hot spot and increases the tendency to form internal porosity. The internal porosity is influenced by the combined effects of bottom chill and pouring temperature. Hence, the effect of bottom chill is more predominant.
With an increase in the silicon content, the volume deficit decreases and is explained based on the solidification behavior of long and short freezing alloys with the help of microstructure and radiographs. The AA 356.0 alloy (rectangular shape casting) promotes a maximum volume deficit value of 6.7% and shows more porosity than AA 413.0 (being an eutectic alloy).
(1) Dispersed porosity and shrinkage porosity are observed for both AA 356.0 and AA 413.0 alloys. Shrinkage occurs due to inadequate feeding of the liquid metal during solidification.
(2) Scattered porosity is more prominent in AA 356.0 alloy.
ACKNOWLEDGMENTS
The authors thank the Directorate of Engineering, the Directorate of R&QA, and the Director DRDL for providing support and permission for carrying out this R&D work.