1 Caregiving Is Universal
“I like to say there are only four kinds of people in this world: those who have been caregivers, those who are currently caregivers, those who will be caregivers and those who will need caregivers. Caregiving is universal.” –
Introduction
Former First Lady Rosalynn Carter’s words, delivered to the Senate Special Committee on Aging in 2011, highlight a central characteristic of caregiving: it is intrinsic to the human condition. Each of us has experienced caregiving in some way: receiving it, providing it, anticipating it, or all of the above. Caregiving is, as Carter recognizes, universal. That said, caregiving experiences, and views on how the government should support caregiving, are not. Caregiving is the subject of extensive press coverage, cultural exploration, policy analysis, and daily conversation. Yet we know less about how these experiences inform attitudes – particularly attitudes on public policies that may impact those who give and receive care. In this Element, we aim to better understand attitudes toward caregiving policies and explain how varied caregiving experiences shape those attitudes. We illustrate that views of caregiving policy are linked both to whether one serves as a caregiver and to how one understands their caregiving role. In so doing, we paint a clearer picture of the political significance of caregiving in the United States.
While the study of caregiving is always compelling, it is of particular importance to study caregiving in the context of COVID-19. The global COVID-19 pandemic upended the lives of most Americans, especially those caring for children or other family members. With daycare centers, preschools, and schools closed and with limited access to in-home elder care, many experienced a dramatic shift in their caregiving role. Scholars and journalists alike have highlighted the impact of the pandemic on caregivers, particularly for women, who do the majority of familial caretaking (Gates, Reference Gates2020; Herd and Harrington Meyer, Reference Herd and Harrington2002; Mooi-Reci and Risman, Reference Mooi-Reci and Risman2021; Power Reference Power2020), and especially for women of color (Htun, Reference Htun2021; Pirtle and Wright, Reference Pirtle and Wright2021). Men also experienced destabilization of their caretaking responsibilities during the pandemic, albeit to a lesser extent than women (Alon et al., Reference Alon, Doepke, Olmstead-Rumsey and Tertilt2020; Stefanova et al., Reference Stefanova, Farrell and Latu2021).
The exogenous shock of the pandemic offers scholars an opportunity to understand whether the ratcheted pressures and responsibilities that came with this unique event shaped the policy views of individuals. In this Element, we examine the impact of caregiving during COVID-19 on attitudes toward policies aimed at helping caregivers. While extant work documents the shifts in caregiving responsibilities during the pandemic, it is unclear how these experiences have shaped individual policy preferences. Understanding this, we are motivated to analyze how (if at all) experiences with caregiving during this stressful time have any influence on peoples’ attitudes over policy that could assist people engaged in child, elder, and family care. Moreover, while our analysis is focused on caregiving policy – which we view as important in its own right – unpacking the dynamics of caregiving attitudes and experiences sheds light on how dramatic periods, like the pandemic, may map onto preexisting factors to shape policy attitudes more broadly.
To this end, we conducted an original survey, the National Caregiving and Covid Survey (NCCS) during the early summer months of 2021.Footnote 1 According to the David J. Sencer CDC Museum’s COVID-19 timeline, respondents were filling out our survey over one year after the World Health Organization declared COVID-19 a global pandemic, and shortly after the Biden administration announced that in May of 2021, all American adults would be eligible for the vaccine (CDC, 2024). Given that we are interested in examining the influence of caregiving on political attitudes, our questions asked respondents to reflect on their caregiving experiences “during the pandemic,” and in some instances we asked them to remember events and conditions “during the past year.” In other words, we asked respondents to recall their experiences with caregiving during a period in time marked by widespread lockdowns, as well as when only a portion of the U.S. population had been vaccinated.
In this section, we offer a short discussion of what caregiving is, followed by an overview of our theoretical and methodological approach. We then provide a descriptive analysis of caregivers and attitudes toward caregiving policies, situate our project in scholarly discourses around gender, policy, and attitudes, and explain our key contributions on how experience and role identification shape attitudes in the caregiving context. Finally, we provide a roadmap of the rest of this Element.
What Is Caregiving and Why Does It Matter?
What exactly is caregiving, and what does it look like in the U.S.? Feminist Scholars Berenice Fisher and Joan Tronto provide a compelling overarching definition of “caring”: “[C]aring [can] be viewed as a species activity that includes everything that we do to maintain, continue, and repair our ‘world’ so that we can live in it as well as possible.” (Fisher and Tronto, Reference Fisher, Tronto, Abel and Nelson1990, 40). More concretely, caregiving can be broken down into two primary categories: formal and/or paid care provided by professional care workers or institutions (Li and Song, Reference Li, Song, Gu and Dupre2019) and informal and/or unpaid provision of care by family or community members (Scharlach et al., Reference Scharlach, Dal Santo, Greenlee, Whittier, Coon, Kietzman, Mills-Dick, Fox and Aaker2001). While our focus is predominately on unpaid or informal caregivers, often family members or other loved ones, we note that the paid/formal caregiving environment (e.g., access to child care or home health care) has a dramatic impact on informal caregivers. Indeed, the experiences, needs, and challenges of informal and formal caregivers are often intertwined.
If caregivers offer care to family and community members, what exactly does that care entail? In short, caregiving involves assisting another individual with daily needs. Sidney Katz, a geriatrician and researcher, developed an early metric of those daily needs, the Activities of Daily Living (ADLs), which includes bathing, eating, and mobility (Edemekong et al., Reference Edemekong, Bomgaars, Sukumaran and Schoo2025). In an updated measure of ADLs, Instrumental Activities of Daily Living (IADLs), these tasks also include medication management, meal preparation, assistance with finances, and shopping for food and clothing (Howard, Reference Howard2023, p. 203).
Caregiving is most often provided for children, elders, and those with disabilities or chronic illness (Schulz and Tompkins, Reference 99Schulz and Tompkins2010). This caregiving may be episodic or more continuous, and the nature of caregiving responsibilities often changes over time. For example, as a child gets older, caregiving responsibilities shift or decrease; as an elderly parent becomes more impaired, caregiving responsibilities may become more numerous or intensive. Much like the shifting nature of caregiving responsibilities, caregiving itself offers individuals both negative and positive experiences (Schulz et al., Reference Schulz and Eden2016). For example, caregivers of older adults report a range of challenges as a result of the care they provide including discrimination, stigma, psychological and physical strain, and financial hardship (Schulz et al., Reference Schulz and Eden2016). However, this subset of caregivers also reports positive effects including appreciation of life, personal growth, enhanced self-efficacy, competence or mastery, self-esteem, and closer relationships.
In the United States, there is both an increased need for caregiving and more challenging conditions facing informal family caregivers, as a function of changing demographics and workforce participation. Sandra Levitsky (Reference Levitsky2014) identifies four key long-term trends that contribute to this difficult context: an aging population, delayed childbearing, changing family sizes, and higher numbers of women in the paid labor market. Because parents are having children later in life, they are tasked with caring for aging parents and young children at the same time, producing the “sandwich generation” (39). Families having fewer children means there are fewer individuals to share caregiving burdens as parents age (East, Reference East2010). Women are more likely to work outside the home than in previous generations and thus are less available to serve as unpaid caregivers. Other demographic factors such as geographic dispersion of family members and higher rates of divorce have further destabilized traditional models of caregiving (Levitsky, Reference Levitsky2014).
As a result of the large baby boom generation, the United States is aging quickly (Mather and Scommegna, Reference Mather and Scommegna2024). Between 2004 and 2024, the percentage of Americans over sixty-five grew from 12% to 18% (US Census Bureau, 2025). According to the Population Reference Bureau, that percentage continues to grow. By 2050, nearly one fourth of the U.S. population will be over sixty-five (Mather and Scommegna, Reference Mather and Scommegna2024). This means that many in the country are already in need of elder care and, as time progresses, the demand for care will increase. In fact, more adults are currently engaging in elder care than in child care. Nearly 23 million Americans are engaging in the care of an older adult, while 21 million engage in child care (Hall, Reference Hall2025). These demographic realities, alongside a patchwork of state laws intermingled with weak federal policy, have resulted in significant gaps in policy support for those who care for elders.
Child care statistics paint a troubling picture as well. Extensive research demonstrates the essential nature of early education and care in fostering children’s healthy mental, physical, and emotional development (UNICEF and UNESCO, 2024). Quality early education promotes better health, employment, and economic outcomes (Bustamante et al., Reference Bustamante, Dearing, Zachrisson and Vandell2021). But finding and affording this care can be a struggle. According to the Pew Research Center, roughly 20% of parents report challenges in affording child care (Leppert, Reference Leppert2024). That percentage nearly doubles for respondents from lower income brackets and is considerably higher for Black and Latino respondents. Studies that focus on working parents and center-based care (rather than residential care) report even higher levels of economic distress; 63% of all parents and 95% of low-income parents struggle to afford care (Shih, Reference Shih2019). This financial pressure shapes younger Americans’ life choices; indeed, the most common reason for not wanting to have children is child care expenses (ReadyNation, 2026). The consequences go beyond individual children and families. Estimates in 2018 place the national economic cost at $57 billion due to lost productivity, earnings, and revenue but for 2025 expenses more than double to $122 billion (ReadyNation, 2026). And, as we explore in more detail in subsequent sections, the COVID-19 pandemic exacerbated these challenges in providing child care (Aragão, Reference Aragão2022).
These statistics on elder and child care are far from a full account of the demands and challenges of caregiving; that would require its own volume. But they do illustrate the urgency of the policy problem and the need for effective policy responses. Caregiving is widespread. It involves many different types of care work that caregivers provide in their families and communities. Caregiving matters not only because it is ubiquitous, but also because there are unmet needs. To that end, both defining the problem and developing responses would benefit from better understanding how people view caregiving and caregiving policies.
Overview and Theoretical Approach
In this Element, we analyze the impact of unpaid caregiving during the COVID-19 pandemic on attitudes toward policies aimed at helping caregivers. First, we ask whether the informal caregiving role, intensified for many during the pandemic, influenced attitudes on policy proposals intended to ease the caregiving burden on families. Second, we ask whether these effects varied for men and women and across racial and ethnic groups. Finally, we explore which dimensions of one’s caregiving burden are correlated with attitudes toward these policies. Through this analysis, we gain insight into the impact of the COVID-19 pandemic on the political views of caregivers, as well as how caregiving might shape policy attitudes outside of that crisis context. In this way, we follow the tradition of scholars who have used a moment of crisis to examine political phenomena (Atkeson and Maestas, Reference Atkeson and Maestas2012; Bartels, Reference 84Bartels2013; Ojeda, Michenor and Haselswerdt, Reference 97Ojeda, Michener and Haselswerdt2024; Prior, Reference Prior2002; White, et al., Reference 102White, Philpot, Wylie and McGowen2007), as these contexts may influence politics for decades beyond their occurrence (Merolla and Zechmeister, Reference Merolla and Zechmeister2009).
Importantly, while the COVID-19 pandemic offers a useful opportunity to study the impact of caregiving on policy attitudes, we see our exploration as instructive for contexts outside of the pandemic. We assert that our approach can be seen as generalizable because our results offer explanatory insights into other contexts where caregiving – generally or for a specific group – is made highly salient. As we discuss in Section 6, cuts to social services, school closures, other public health emergencies, or other events that strain caregivers could produce conditions similar to those that are captured in our data. In addition, our results are generalizable because the theoretical frameworks we employ operate regardless of the public health context. In the final two sections of this volume, we discuss how the relationships we uncover during the pandemic do and do not persist after the global health crisis ended, and how our findings overall may be instructive for other contexts.
We engage with two theoretical frameworks in this manuscript. First, we examine the implications of social role theory for understanding how caregiving might shape policy attitudes. Social role theory posits that gendered divisions of labor shape society, gender roles, and gendered norms such that men are expected to be agentic and aggressive while women are communal and nurturing (Eagly and Steffen, Reference 88Eagly and Steffen1984; Eagly and Wood, Reference Eagly and Wood2012). Scholars refer to this as diffuse gender roles (Schneider and Bos, Reference Schneider and Bos2019). When social role theory is used in relation to diffuse gender roles to help understand political attitudes, it predicts that women will more strongly support policies that foster communal well-being and care, while men are more likely to support policies that endorse aggression and power (Crowder-Meyer, Reference Crowder-Meyer2022; Diekman and Schneider, Reference Diekman and Schneider2010; Schneider and Bos, Reference Schneider and Bos2019). In addition, this theoretical approach also tells us how specific social roles can shape political attitudes (Schneider and Bos, Reference Schneider and Bos2019). This dimension of social role theory suggests that individuals who are engaged in communal or nurturing roles (for example, caregivers or teachers), regardless of gender, will also be more likely to support policies that reflect those traits (Schneider and Bos, Reference Schneider and Bos2019). While diffuse gender roles and specific social roles may overlap (e.g., women as caregivers), they may not (e.g., men as caregivers). Taken together, these two theoretical frameworks guide our analysis.
Second, we interrogate the role of self-interest in shaping support for caregiving policies. While it may seem that this relationship is intuitive, such that individuals who are caregivers will logically support policies designed to help them, extensive public opinion research has found that individuals often do not connect self-interest to policy preferences, especially in times of high partisan polarization (Chong, Citrin, and Conley, Reference Chong, Citrin and Conley2001; Hainmueller and Hopkins, Reference Hainmueller and Hopkins2014; Sears and Funk, Reference Sears and Funk1991). We argue that the pandemic created the conditions under which individuals should be best able to recognize their self-interest as caregivers: the stakes, personal cost, and personal benefits were clear (Chong, Citrin and Conley, Reference Chong, Citrin and Conley2001). We assert that even in a polarized context, caregivers should be more supportive of social support policies than individuals without caregiving responsibilities.
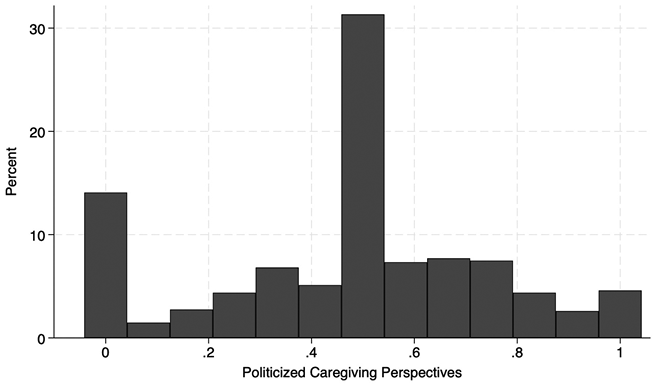
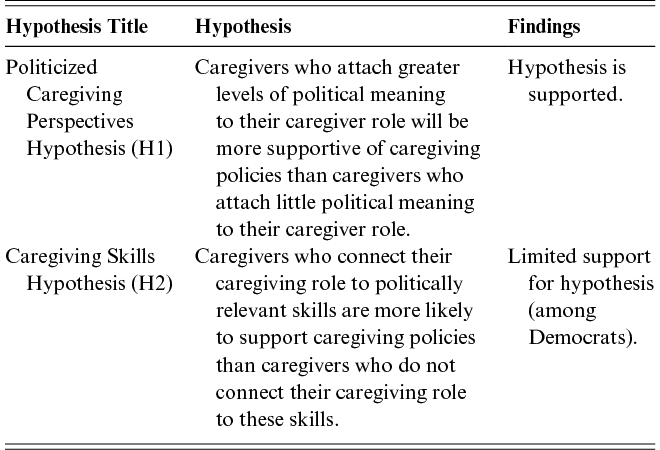
Furthermore, we analyze how caregivers draw meaning from or understand their caregiving role and examine if it has implications for their policy attitudes. Building on work by Levitsky (Reference Levitsky2014), we develop a novel concept – politicized caregiving perspectives – defined as the connection that individuals make between their personal caregiving responsibilities and their political views, their sense of politically relevant expertise, and their motivation to engage in political and civic life. Unlike the self-interest hypothesis, which suggests wide-spread policy support among caregivers, the politicized caregiving perspective suggests that a subset of caregivers, who derive political meaning from their caregiving role, will express higher levels of policy support.
Gender, Parental Status, Race, and Social Support Policy Attitudes
What do we know about sources of support for social welfare policies, especially those related to caregiving? In general, support for social programs is conditioned by perceptions of how “deserving” the recipients are (Beechey, Reference Beechey2016). A robust literature has also documented gender gaps on social support policies such that women consistently support these policies more than men (Huddy, et al., Reference Huddy, Cassese, Lizotte, Wolbrecht, Beckwith and Baldez2008; Lizotte, Reference Lizotte2020; Shapiro and Mahajan, Reference Shapiro and Mahajan1986). Women are more supportive of government spending on policies that alleviate pressure on families, such as increased spending on child care, schools, Social Security, and programs that address homelessness and poverty (Barnes and Cassese, Reference Barnes and Cassese2017; Howell and Day, Reference Howell and Day2000). This is true even among Republicans, who generally do not advocate for these types of policies (Barnes and Cassese, Reference Barnes and Cassese2017). While the level of support for these programs can be contingent on the race of the beneficiaries (Cassese and Barnes, Reference Cassese and Barnes2019) and the type of policy (Lizotte, Reference Lizotte2020), public opinion data since the 1980s has consistently shown that women are more supportive of social support policies than are men. Women also prioritize these issues to a greater extent than do men (Crowder-Meyer, Reference Crowder-Meyer2022). This work often does not explore the role of caregiving in generating support for these policies.
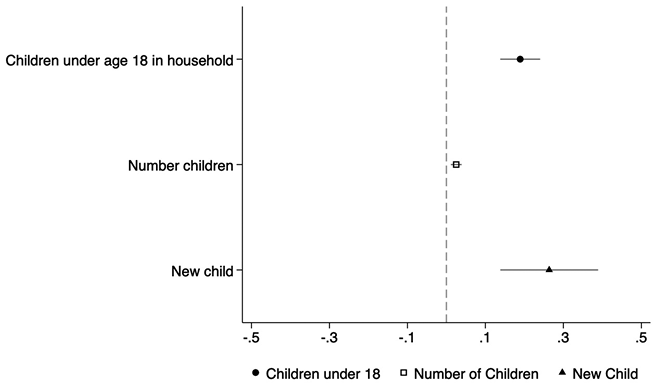
Adjacent to the gender gap literature is a smaller literature on the impact of parenthood on policy attitudes. Generally, scholars here have found that parents, particularly mothers, tend to be more supportive of social support policies than people without children (Burlacu and Lühiste, Reference Burlacu and Lühiste2021; Elder and Greene, Reference Elder and Greene2012). Mothers tend to be more supportive of funding for schools, child care, and food stamps than women without children (Elder and Greene, Reference Elder and Greene2012; Greenlee, Reference Greenlee2014), though there is evidence that this difference only emerges in political contexts that make these issues highly salient (Greenlee, Reference Greenlee2014).
In a related line of research, work by Weeks (Reference Weeks2025) examines how parents’ mental load influences attitudes on policy issues. Applying Daminger’s (Reference Daminger2019) definition, she conceptualizes mental load as the “cognitive household labour of anticipating, fulfilling, and monitoring household needs” such as finding child care or scheduling doctor’s appointments. In her analysis, she finds that fathers carry a lower mental load than mothers and that once a mother’s mental load surpasses the 54% threshold, there is no longer an interest in policy issues that do not directly affect family life. Turning more specifically toward research regarding fathers, scholars have documented mixed findings regarding how fathers and nonfathers differ with regard to social policy issues (Banducci et al., Reference Banducci, Elder, Greene and Stevens2016; Elder and Greene, Reference Elder and Greene2012). Family structure and stage of child rearing can also shape levels of support; for example, single mothers are more supportive of social support policies than married mothers (Greenlee, Reference Greenlee2014), and children of young parents are more supportive of governmental spending on daycare than are parents of older children (Burlacu and Lühiste, Reference Burlacu and Lühiste2021). As important as this prior scholarship is, it has not examined how different dimensions of providing care to children influence policy attitudes, or how there may be variation among caregivers. Nor has this research explored the role of other types of caregiving.
In addition to and intersecting with gender and parental status, levels of support for social policies vary by race and ethnicity. While an extensive literature has documented the contingency of whites’ support for social policy based on their perceptions of the race of the policy beneficiaries, less work has focused on how Black, Latinx, and Asian Americans view these policies. Black Americans exhibit considerable support for social services, though that support declined from the 1980s to the early 2000s (Tate, Reference Tate2010; White and Laird, Reference White and Laird2020). The Latinx community also generally favors government spending in order to address social issues (Branton, Reference Branton2007; Stokes-Brown, Reference Stokes-Brown2012) and ranks childcare as a high-priority issue (Rouse, Reference Rouse2013). While public opinion data are limited on these policy issues for the Asian American community, a vast majority of Asian Americans support increased government investment in caretaking for those with disabilities and the elderly and in providing affordable and high-quality child care and pre-K (AAPI Data 2022). Minimal scholarship has examined potential gender gaps within communities of color. One recent exception is Lizotte and Carey (Reference 94Lizotte and Cary2021), who find that compared to Black men, Black women express higher levels of support for socially supportive policies, though they find that this gap is due, in part, to the greater economic vulnerability of Black women (500). That said, research on the differential effects of caregiving for men and women across different racial and ethnic groups is limited.
Data and Measures
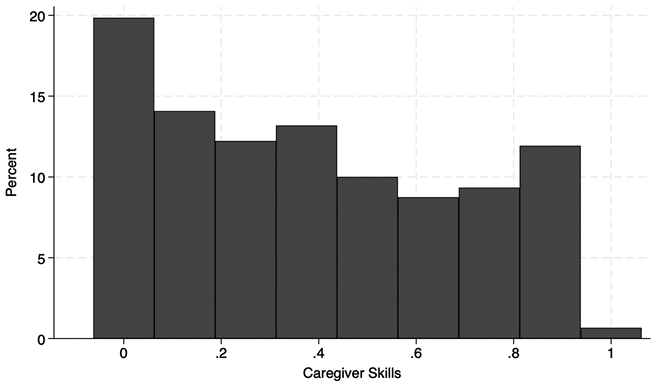
Our analysis is primarily based on our own original study, the NCCS. Using YouGov, we surveyed representative samples of Asian, Black, Latinx, and white respondents (500 in each subgroup for a total of 2,000 respondents) in the early summer months of 2021. Our survey includes a range of questions to capture caregiving experiences and attitudes on policies directly related to child care and elder care. We further included questions on ideology, views on gender roles, community and social justice, partisan identification, and political outlook. Moreover, we developed new measures on caregiving perspectives, skill sets, and caregiving roles – questions that help us assess how respondents view their caregiving in relation to politics.
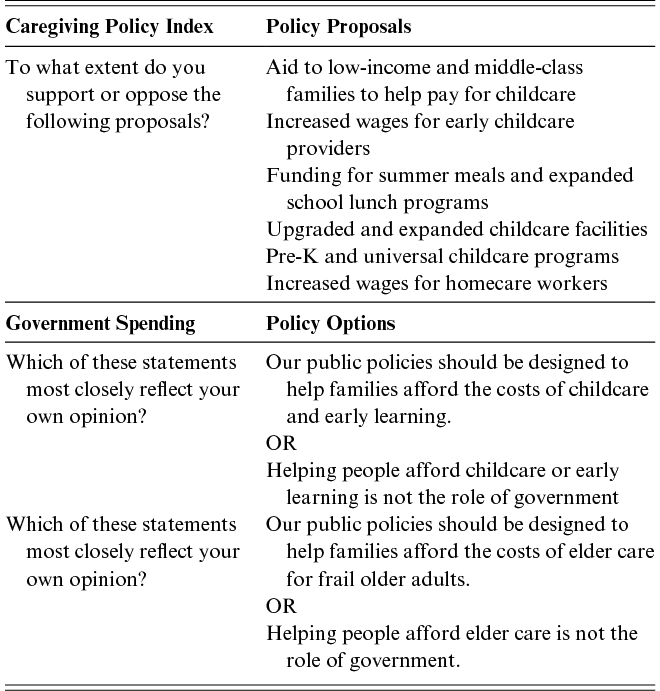
For our main outcome measures, we included policy questions drawn from current policy debates around caregiving. These policies – aid to low-income and middle-class families to help pay for child care, increased wages for early child care providers, funding for summer meals and expanded school lunch programs, upgraded and expanded child care facilities, increased wages for homecare workers, and pre-K and universal child care programs – were drawn from proposals included in President Biden’s domestic policy investments plan, commonly called “Build Back Better.” We also ask broader questions regarding government spending on, and the appropriate nature of government’s role in supporting caregiving. For our main independent variables, we gathered detailed information on caregiving responsibilities, including who the care was for and whether care commitments intensified during the pandemic. To capture politicized caregiving perspectives, we also asked respondents a series of questions about how they viewed the implications of and value of their work as caregivers. We supplement our original survey with data from the 2022 and 2024 Cooperative Election Study (CES) (which includes a subset of our caregiving measures) and research on caregiving policy at the state and federal levels.
A key component of our analysis examines the caregiving responsibilities individuals held prior to and during the pandemic, and how these responsibilities may have shifted during the pandemic. To operationalize caregiving responsibilities – one of our main independent variables – we took a broad conceptualization and asked respondents: “Thinking about all the people in your life who you help (even if they do not live with you), who do you regularly help by doing activities like cooking, cleaning, bathing, shopping, yard work, or scheduling appointments? Check all that apply.” We asked this question for the time period before and during the pandemic, and provided a broad range of response options, including: children/stepchildren/foster children; grandchildren; spouse/partner; parents; grandparents; cousins; aunts/uncles; nieces/nephews; friends; siblings; community members, others; and none of the above. We created a dummy variable if respondents selected any category except none of the above. One important thing to note about this measure is that it is objective, and thus plausibly exogenous to policy attitudes. We also asked respondents to report whether the time they spent caregiving increased, decreased, or stayed the same during the pandemic compared to before the pandemic.
Who Is Giving Care? A Look at the NCCSFootnote 2
According to existing research, unpaid caregivers come from every race, gender, and economic status (Howard, Reference Howard2023). Most also work outside the home (Howard, Reference Howard2023). The gender gap in caregiving has diminished, but women still constitute the majority of caregivers (roughly 60%) and are more likely than men to care for more than one adult. While cultural norms about caregiving vary (Scharlach, Reference Scharlach, Kellam, Ong, Baskin, Goldstein and Fox2006), percentages of caregivers among white, Black, and Hispanic groups roughly mirror their percentages in the general population. But the number of hours dedicated to caregiving does vary (highest for Black respondents, lowest for white respondents) (Howard, Reference Howard2023).
Our findings from the NCCS mirror those existing trends. In our data, about 66% of people report having caregiving responsibilities prior to the pandemic and caregivers come from a range of racial, ethnic, and socioeconomic backgrounds.Footnote 3 Women and men exhibit similar levels of caregiving before the pandemic; 66% of men and 67% of women.Footnote 4 Looking at gender by race and ethnicity, some nonwhite women report more responsibilities than men who share their racial/ethnic identity. More specifically, we find that more Latinas report caregiving responsibilities (69%) than Latino men (64%), and Black women (62%) are caregivers at higher rates than Black men (55%). These differences are smaller among Asian and White respondents. For Asian Americans, 67% of women and 70% of men report having caregiver responsibilities, while 67% of white women and 68% of white men do.
How, if at all, did the COVID-19 pandemic change the distribution of caregiving responsibilities? We find a similar percentage of people indicated having caregiving responsibilities during the pandemic, 65%. Interestingly, we find that fewer Latina and Black women report caregiving responsibilities during the pandemic: 68% of Latinas and 60% of Black women, though they still report higher rates than Latino men (63%) and Black men (55%). Asian women and white women indicate similar or slightly higher levels of caregiving, 69% and 68%, respectively. Asian men exhibit lower levels of caregiving than co-ethnic women (67%) and white men offer care at the same rate as white women (68%).
Given the circumstances of the pandemic, we are surprised that caregiving responsibilities were similar during this time period. In other words, given the lack of formal care options during the pandemic, it is curious that individuals did not report caring for more people during this highly stressful period. What might explain this? We suspect one of two explanations. First, it is possible that because of COVID-19-related restrictions, families may have been unable to see or care for family members with whom they did not share a home. This may have been the case, in particular, with older relatives for whom respondents typically give care. Thus, stay-at-home orders and other pandemic-related restrictions may have contributed to a reduction in caregiving responsibilities for some. A second – and grimmer – possibility is that because of the premature deaths that occurred as a result of COVID-19, some caregivers may have lost family members for whom they previously gave care. Of course, we are not able to know for certain if these possibilities explain why caregiving responsibilities did not increase, but they seem plausible.
Though there was no increase in the number of respondents who reported being caregivers during the pandemic, we also asked respondents to report if the time they spent engaging in caregiving during the pandemic decreased, increased, or stayed the same, compared to before the pandemic. We find that the time spent on caregiving did increase for some individuals. While many caregivers report that the amount of time that they spent on caregiving stayed the same, more respondents report that their caregiving time increased during the pandemic than decreased. Among women, 25% of Asian Americans, 24% of Latinas, and 22% of Black women in our sample report increased time spent on caregiving. Among white women, 19% report increased caregiving time. Among men, 24% of Latinos indicate spending more time caregiving during the pandemic. The comparable percentages are 17% among Black men, 22% among Asian American men, and 19% among white men. All told, for a significant portion of respondents, the time that they spent on caregiving increased during the pandemic. In addition, we see gender differences such that more Asian and Black women express increased caregiving time compared to Asian and Black men.
What Do Americans Want When It Comes to Caregiving Policy?
Caregiving is a widespread role and responsibility; do we therefore see support for policies that provide support for caregiving? Prior analysis of the General Social Survey (GSS) indicates that general support for government-funded elder care policies grew substantially (37% to 51%) from 2012 to 2022 (Patterson and Reyes, Reference Patterson and Reyes2024). More recent polling in 2024 illustrates high levels of support for a range of policies aimed at supporting paid and unpaid caregivers and increasing the accessibility and affordability of care (Miller et al., Reference Miller2022). Similarly, NCCS data indicate that policy proposals to address caregiving needs are generally very popular, even in our current climate of high partisan polarization. Democratic respondents overwhelmingly support investments in care across the board and independents tend to be supportive as well. While Republicans are more varied – endorsing some provisions and opposing others – nontrivial percentages of Republicans support a range of caregiving policies. In other words – while Democrats in the public are more unified in their support – there is bipartisan backing in the public for investment in care.
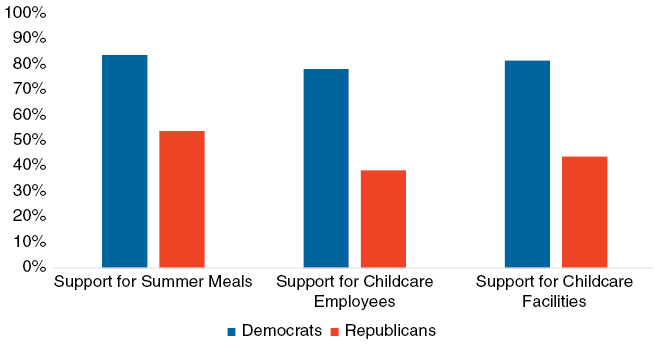
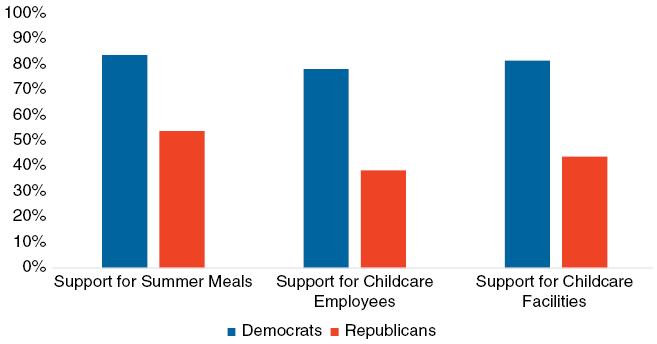
In the NCSS, there is widespread support for policies aimed at helping children (see Figure 1). For example, 84% of Democrats and 54% of Republicans agree that the government should provide funding for summer meals and should expand school lunch programs. There is also support for upgrading child care facilities and providing more facilities in areas of need among 81% of Democrats and 44% of Republicans. Over three-quarters of Democrats agree that the wages of early child care providers should be increased, and a sizeable percentage of Republicans, 38%, also agree. Notably, these trends in public opinion look quite different from what we observe among Republican party elites – where Republican opposition is consistent.
Support for Child Care-Related Polices by Partisan Identification.
Note: The figure shows the percentage who agree or strongly agree with the statement.
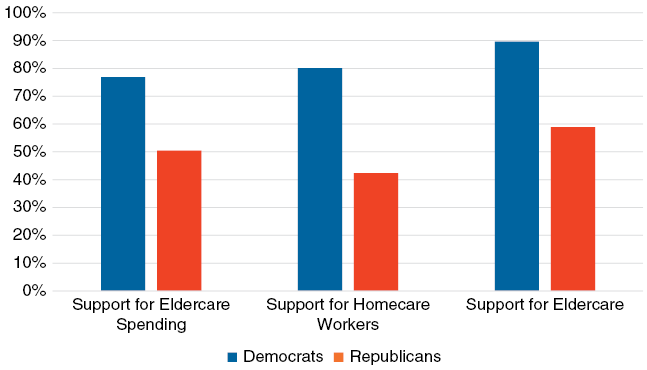
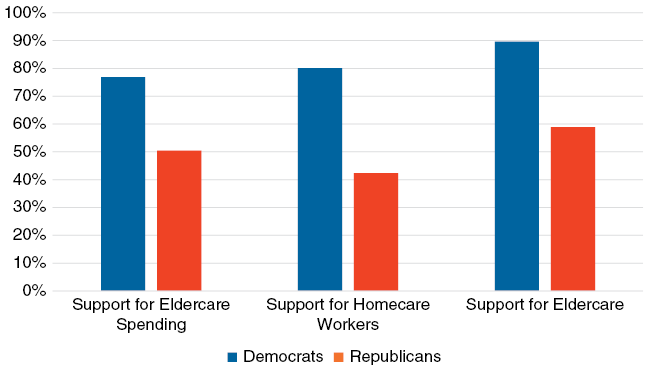
Though elder care has received less attention than child care in the public debate, it also enjoys considerable support across racial, ethnic and partisan lines. We asked if policies should be designed to help families afford the costs of elder care (see Figure 2). Among our respondents, 73% indicate that government should provide families with aid for elder care costs, including 90% of Democrats and 59% of Republicans. Support for an increase in the wages for homecare workers is less overwhelming but still noteworthy: 60.4% of respondents support this policy, including 80% of Democrats and 42.4% of Republicans.
Support for Elder care Related Policies by Partisan Identification.
Note: The figure shows the percentage who agree or strongly agree with the statement (for the first two measures).
Gender Differences
Existing research on gender differences in political attitudes suggests that only women would be highly supportive of helpful child care and elder care policies, but we find that while women are generally more supportive of care policies, men are often very supportive as well. For all the policies we ask about, men’s support is at 50% or more, with their higher levels of support for assisting families in affording the costs of elder care for older adults (67%), upgrading child care facilities (58%), and providing funding for summer meals for children (58%). While men’s support for these policies is clear, women’s support is even greater. Over 60% of women respondents indicate support for all of the child care and elder care policies in the survey. Like men, their highest level of support (78%) is for the proposal to assist families in affording the costs of elder care. Women are also strong supporters of providing assistance with child care. For example, 74% of women are in favor of allotting more money to expand school lunch programs and to also provide summer meals for children. It is evident that regardless of gender, people want assistance with caregiving, and women’s support is particularly high.
Communities of Color
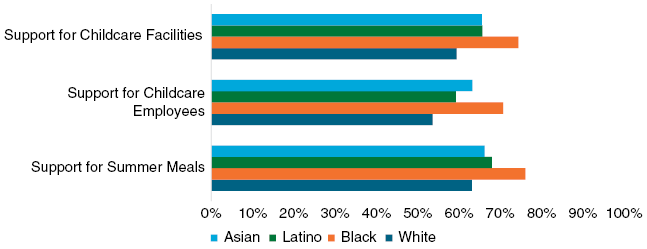
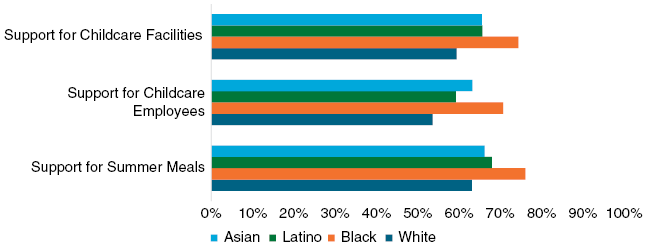
Support is stronger still when we focus on the communities of color that were hardest hit by the pandemic: 80% of Black respondents, 80% of Asian respondents, and 75% of Latinx respondents support helping families with the cost of elder care. Similarly, over 60% of respondents from all three groups are in favor of increasing the wages of homecare workers. Over 74% of Black Americans and over 66% of Asian Americans and Latinx Americans support policies that would improve child care facilities (see Figure 3). Black Americans show the strongest support, 71%, for higher pay for child care providers.
Support for Child Care-Related Policies by Racial and Ethnic Identification.
Note: The figure shows the percentage who agree or strongly agree with the statement.
These descriptive findings show that there are high levels of support for policies that benefit caregivers and caregiving recipients. This lays the groundwork for the analyses that we undertake in this volume. We seek to understand what exactly drives these levels of support and glean insights into how personal circumstances can connect to political preferences.
Section Outline and Key Findings
In the sections that follow, we explain how caregiving policy has evolved, how caregiving policy attitudes are structured, and how our study contributes to a broader understanding of the way in which identity and individual experiences shape public opinion on a pressing policy topic. In Section 2, we provide a brief history of caregiving policy in the United States, and a deeper dive into the current policy context. We consider policy progress, and lack thereof, on caregiving proposals including paid leave, child care subsidies, increased wages for caregivers, and universal pre-K proposals. We provide background on why and where these policies have been adopted at the state and federal levels. We also explore key factors that traditionally drive support and opposition to these policies, including partisan dynamics and interest group activity.
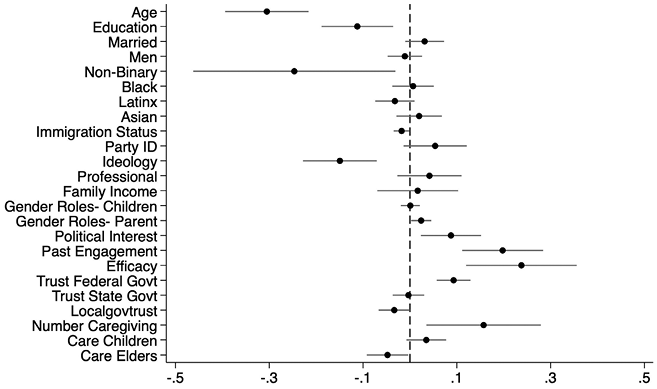
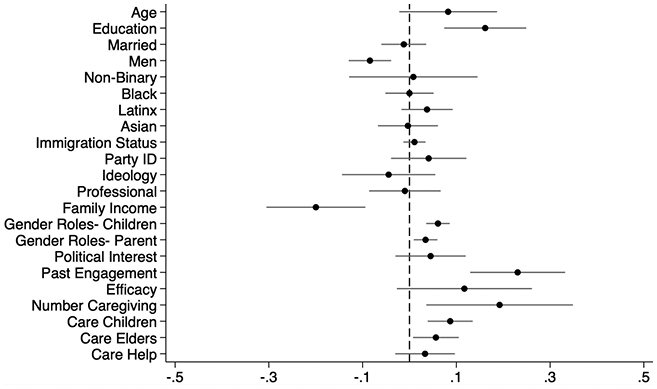
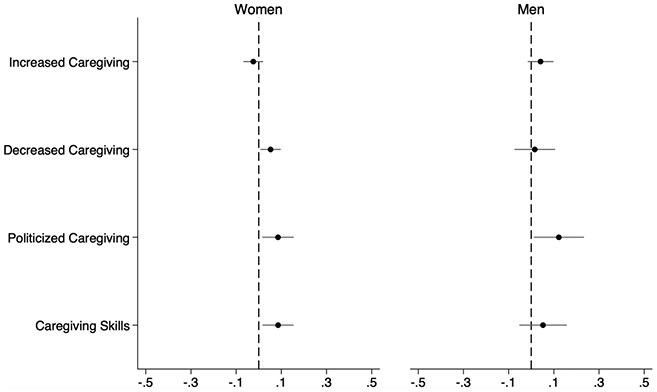
Building from the general overview of caregiving attitudes presented in this section, in Section 3 we offer an exploration of how caregiving responsibilities shape attitudes toward caregiving policy, and how this relationship varies by gender and race. While policy attitudes are unsurprisingly influenced by partisanship, we also find that caregiving experiences during the COVID-19 pandemic are positively associated with attitudes toward caregiving support plans. These effects are generally similar between men and women, and across racial and ethnic groups, but we do point to some interesting distinctions between these groups. We find caregiving does indeed shape the policy views of individuals, such that caregivers are more supportive of caregiving policies than non-caregivers. Yet there is no evidence that increased time spent on caregiving during the pandemic leads to more support for social support policies than having the same or a decreased amount of time on caregiving. Importantly, while women and people of color start with higher baseline support for caregiving policies, the effects of caregiving responsibilities and time on caregiving policies are mostly similar between men and women, and across racial and ethnic groups. One important point to note, though, is that for men, increased time (but not decreased or the same amount of time) spent on caretaking during the pandemic is associated with increased support for caregiving policies.
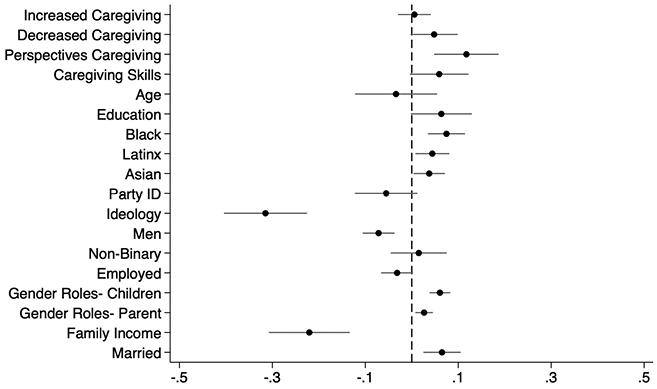
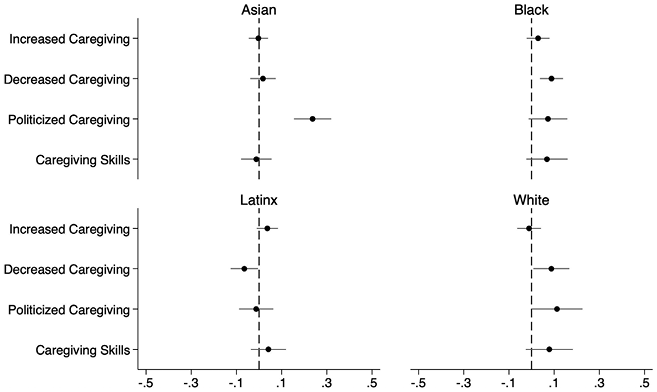
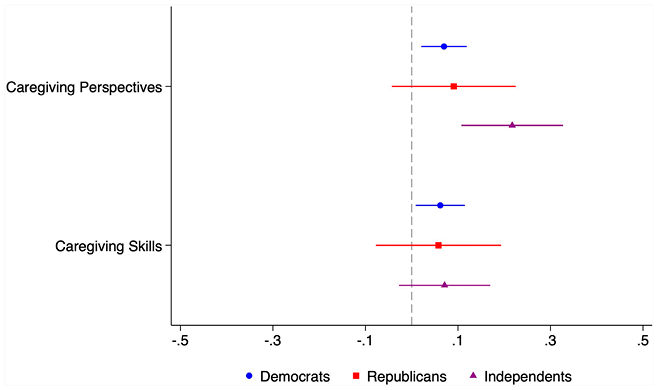
In Section 4, we examine how caregivers differ from one another. First, we build on scholarship on politicized identities and civic engagement to develop a new concept that we term politicized caregiving perspectives. A politicized caregiving perspective is the degree to which a caregiver connects their caregiving role to their views of and engagement with the political sphere. We explore whether caregivers who draw political meaning and expertise from their caregiving role are more supportive of social support policies than caregivers who do not draw similar connections to their caregiving role. In other words, we investigate whether respondents see a role that they occupy, that of caregiver, as related to their political views, sense of political capabilities, and political behavior. We find that individuals who score high on the politicized caregiving scale are more supportive of caregiving policies. This is the case for both women and men and across racial and ethnic groups. These findings provide important evidence that the internal experience of caregiving is consequential for policy attitudes and potentially for other forms of political engagement as well. In other words, our findings illustrate that the personal is indeed the political. The impact of caregiving on policy preferences is not merely a function of whether one experiences caregiving but also how they experience caregiving, and how they understand their role and responsibilities in a broader political context.
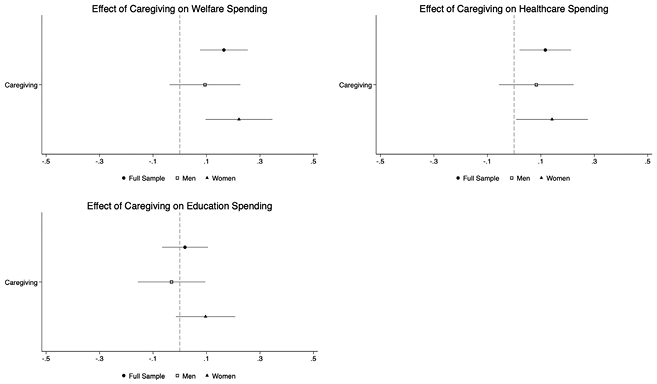
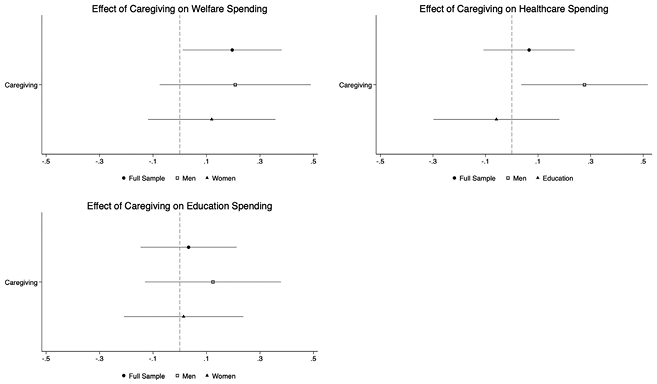
In Section 5, we consider how our findings persist and extend beyond the COVID-19 context. We analyze a broader set of policy issues that are closely related to caregiving, such as spending on welfare, health care, and education. Finally, in Section 6, we consider the broader implications of our work for policy and public opinion. Specifically, we explore the ways in which politicized caregiving might inform future research on the relationship between individual experience and policy outlook. We also offer insights based on our findings for real-world interventions. How might caregivers be encouraged to draw political meaning from their caregiving experiences? How can we promote the value of caregiving experience in politics and policymaking? What role can parties, interest groups, and social movements play?
Former First Lady Rosalynn Carter aptly noted in her congressional testimony that caregiving is ubiquitous and therefore something that we should take seriously. We agree. This Element considers how caregiving shapes the policy views of individuals and offers insights into why there is widespread support among Americans for public policies that ease their caregiving burden. We show that while partisan preferences do play an important role in determining who supports these policies, Americans of all political stripes approve of policies that reduce caregivers’ burdens. Additionally, we show that the political significance of caregiving becomes especially consequential in a context that makes caregiving responsibilities and burdens salient.
2 The Context of Caregiving in the United States
Introduction
A meaningful discussion of policy attitudes requires that we first understand the relevant policy environment. This section of the Element provides a brief history of caregiving policy in the United States and a closer look at the current policy context. Caregiving encompasses a broad range of programs; our objective is not to cover all of them here or to provide an exhaustive history of how they evolved. Indeed, some of the most consequential policies that ensure care for the elderly – Social Security and Medicare – are not typically framed in political discourse as “caregiving policy” unless they are linked to specific caregiving provisions (e.g., Kamala Harris’ proposal to use Medicare funds to cover home care). We revisit the potential of expanding what counts as caregiving policy in the concluding section.
Here we aim to highlight key historical developments and explore policies that have been among the most central in recent caregiving debates, and those that are directly linked to our survey analysis. We focus on progress, or lack thereof, on caregiving proposals including child care subsidies, increased wages for caregivers, and universal pre-kindergarten (early childhood education) proposals – policies that we analyze attitudes toward in Sections 3 and 4. We also consider the implications of other policy proposals, such as paid leave, tax policy, and immigration, on family caregivers. While we do not analyze attitudes on all of these policies, we include a discussion of them here because they are front and center in contemporary policymaking, and because it is important to illustrate that caregiving is intrinsically interwoven with other policy areas. To facilitate a better grasp of policy adoption and its drivers, we provide background on why and where caregiving policies have been adopted at the state and federal levels. In so doing, we explore key factors that traditionally influence both support and opposition to these policies, including welfare state regimes, views of public versus private responsibilities, and partisan dynamics.
Policy Background
As noted in the previous section, family caregivers – before, during and after the pandemic – provide significant unpaid care. In 2018, roughly 30% of adults in the U.S. provided unpaid care for a child under eighteen, at a time when commitment associated with child care has grown dramatically as it has done over the last half-century (Livingston, Reference Livingston2018). Moreover, roughly one in eight parents of children under eighteen also provides care for an adult family member, neighbor, or friend (Livingston, Reference Livingston2018). The COVID-19 pandemic amplified these caregiving responsibilities. The National Alliance for Caregiving (NAC) and AARP reported in 2020 that more than 20% of Americans (21.3%) are caregivers for an adult or a child with special needs, a growth in roughly 10 million individuals from comparable 2015 data (National Alliance for Caregiving, 2020). In 2020, “[o]n average, 60% of caregivers were employed, and they provided 20.4 hours of care per week on top of employment.” (Miller et al., Reference Miller2022). Meeting these care needs continues to present ongoing challenges for American families.
The United States lags well behind other wealthy nations when it comes to paid leave, child care provision (Ansel and Markezich, Reference Ansel and Markezich2017), and caregiving support in general (Herd and Harrington Meyer, Reference Herd and Harrington2002). As is the case for much of the welfare state in the U.S., progress is often tenuous and governmental support for caregiving has advanced in a piecemeal and fragmented manner. Advocates have lobbied for increased caregiving support for decades, yet elected officials at the national level have failed to secure a robust policy response, largely due to conservative oppositionFootnote 5 and the persistence of traditional gender roles that tend to rely on the unpaid labor of women in order to stabilize the caregiving crises.
Some of the earliest efforts at systematic support for caregivers came through the New Deal. Aid to Dependent Children (ADC), a means tested cash assistance program for children without paternal financial support, was established in 1935 (Blank and Blum, Reference Blank and Blum1997) and later evolved into AFDC (Aid to Families with Dependent Children). The federal government directly subsidized child care during the Great Depression and especially during World War II to care for the children of mothers who had joined the war effort on the home front. The program, provided under the Lanham Act, ended after the war as women were pressured to return home (Kiesling, Reference Kiesling2019). Opposition to the program, and justification for its eventual elimination, illustrate pervasive beliefs that women are natural caregivers and that their career ambitions are suspect. Fiorello La Guardia, mayor of New York, argued that, “The worst mother is better than the best institution when it is a matter of child care” (Kiesling, Reference Kiesling2019). Welfare commissioner Edward Rhatigan dismissed women’s efforts to preserve the program as “‘hysterical’ propaganda” and derided efforts to “satisfy their desire for a career … at the taxpayers’ expense” (Kiesling, Reference Kiesling2019). What is more, domestic caregivers were excluded from the Social Security benefits established by the New Deal, a symbolic affront as well as a financial one. As Kat McGowan, a journalist who focuses on caregiving, argues “the role was accorded this second-class status, as not quite a real job” (McGowan Reference 95McGowan2025).
Despite these attitudes, efforts to expand caregiving support persisted in the 1960s and 1970s. A significant milestone, Head Start, originated as part of President Lyndon Johnson’s War on Poverty in 1965. Head Start currently provides meals and educational programing to roughly 800,000 low-income children under five, but administrative support for the program has been more precarious since Trump’s reelection in 2024 (Bipartisan Policy Center, 2019; Cowan, Reference Cowan2025; Jones, Reference Jones2025; Schneider, Reference Schneider2025). Congress passed the Comprehensive Child Development Act, which would have established a federal day care program, in the early 1970s, but the bill was vetoed by President Nixon on the ground that it grew bureaucracy and threatened the family’s “rightful position as the keystone of our civilization” (Nixon, Reference Nixon1971).
In 1993, President Bill Clinton championed and signed the Family Medical Leave Act (FMLA) (Wage and Hour Division, 2022). Groundbreaking at the time, the law provides twelve weeks of unpaid leave for family caregiving and protects workers from losing their jobs while on leave, but there are significant limits beyond the lack of financial compensation. Employees must be working at their place of employment for a year, and many are not covered (those working at companies with fewer than fifty employees, for example). Reports on the success of the FMLA in supporting caregivers are mixed. It resulted in a notable expansion of employer provided, job-protected leaves, both because it prompted some companies to offer this benefit for the first time, and because, after its adoption, many employers expanded the leave they had already provided (Waldfogel, Reference Waldfogel1999). But the policy disproportionately benefited white caregivers and provides less support for women of color and low-wage workers (Vohra-Gupta, Kim and Cubbin, Reference Vohra-Gupta, Kim and Cubbin2021). Moreover, legal recourse against lack of employer compliance was limited (Cockey Reference Cockey2004). After the passage of the FMLA, a number of states have acted to provide some form of paid leave (NCSL 2025), as have many employers, but federal protections remain anemic. As a result, most family caregivers do not have access to paid family leave at their workplace, which further reinforces the idea that familial caregiving is a matter that falls within the private realm of responsibility.
To alleviate the costs associated with child care, the Clinton Administration also established a child tax credit, which generally garnered bipartisan support (NCSL, 2024a). In the decades that followed, several federal policies have had substantial impacts on caregiving and caregivers, including welfare reform under President Clinton (Adams and Rohacek, Reference Adams and Rohacek2002) and health care reform under President Obama (U.S. Department of Health and Human Services, 2015). But a comprehensive federal response to the needs of caregivers remained elusive.
Federal Policy – Recent Developments and Partisan Dynamics
Throughout the early twenty-first century, policymakers have noted the importance of greater support for caregiving. Advocacy for caregivers has come primarily from Democratic elected officials and candidates for office, though Republicans have sometimes offered proposals as well. For example, Democratic presidential candidates Hillary Clinton (Paquette, Reference Paquette2016) and Elizabeth Warren (Warren, Reference Warren2019) proposed ambitious child care plans and emphasized the economic need for such policies on the campaign trail. Kamala Harris proposed a Medicaid expansion to help the “sandwich generation” who care for children and elders (Shivaram, Reference Shivaram2024). However, little has changed in recent decades by way of federal policy. And while policies such as paid leave and child care subsidies are generally popular according to public opinion polls, the issue rarely receives sustained national attention (Horowitz et al, Reference Horowitz, Parker, Graf and Livingston2017).
Republican leaders typically oppose programs such as those proposed by Clinton, Warren, and Harris (Marcos, Reference Marcos2015). In some cases, they propose alternatives based on deferring Social Security (Hiltzik, Reference Hiltzik2022) or advance family support through state-level grant funding, as was the case with the National Family Caregiver Support Program, which was established with bipartisan support in 2000 (NC Department of Health and Human Services, 2020). While Republicans have been reluctant to expand funding or provide direct programmatic support for caregiving, in his first term, President Donald Trump did sign the Recognize, Assist, Include, Support and Engage Family Caregivers (RAISE) Act of 2017 (H.R. 3759). The RAISE Act directed the Department of Health and Human Services (DHHS), in collaboration with other federal agencies, to develop a national family caregiving strategy to address challenges in family caregiving. More specifically, it established an advisory council of stakeholders and policy experts to assess current caregiving programs, provide education and information to family caregivers, and make policy recommendations (Administration for Community Living, 2021; Medical Library Association, 2018; National Academy for State Health Policy, 2022; RAISE Family Caregiving Advisory Council and Advisory Council to Support Grandparents Raising Children, 2024).
Caregiving became particularly salient during the COVID-19 pandemic as the country went into lockdown and schools, and care facilities closed their doors or converted to remote learning. Many families faced challenges posed by working (in person or remotely) while also caring for children or other family members at home. Though caregiving responsibilities intensified for men and women, there was a disproportionate impact as women were more likely than men to give care to family members (Mooi-Reci and Risman, Reference Mooi-Reci and Risman2021). During the pandemic, caregivers reported more negative psychological and economic impacts than respondents who did not have caregiving responsibilities (Beach et al., Reference Beach, Schulz, Donovan and Rosland2021), particularly among communities of color (California Caregiver Resource Center, 2021; Ranji, et al., Reference Ranji, Frederiksen, Salganicoff and Long2021; Willert and Minnotte, Reference Willert and Minnotte2021).
With the crisis in caregiving made stark by the pandemic, and the election of a Democratic president in 2020, the possibility of improving government support for caregiving reemerged. In 2021, President Joe Biden proposed Build Back Better, a wide-ranging domestic policy agenda, including a historic investment in caregivers (National Center for Chronic Disease Prevention and Health Promotion, 2022). Key caregiving components of the bill included funding to decrease the overall costs of child care through expansion of the Child and Dependent Care Tax Credit, paid leave provision, universal pre-K for three- and four-year olds, increased compensation for homecare and child care workers, and expansion of long-term care access for seniors and persons with disabilities (The White House, 2021). These provisions were aimed at easing the burden on family caregivers who face a range of challenges as a result of their caregiving responsibilities (Hopps et al., Reference Hopps, Iadeluca, McDonald and Makinson2017; Rubin and White-Means, Reference Rubin and White-Means2009). Our study considers public attitudes toward several of these policies, as well as attitudes toward government support of caregiving in general. The bill’s focus on care infrastructure reflected the advocacy of stakeholders and the analyses of economists (Care Can’t Wait, 2022; Donegan, Reference Donegan2021; Hoynes, et al., Reference Hoynes, Logan, Mian and Spriggs2021), who argue that investing in caregiving is necessary for economic stability and growth.
Congressional votes on Build Back Better illustrated a sharp partisan divide at the elite level. Nearly every Democratic representative supported the legislation, including the child care provisions; every Republican representative opposed it. Ultimately the caregiving components passed the House but fell short in the Senate. After caregiving policy reform failed in Congress, Biden turned to executive orders to advance his caregiving agenda (Carpenter, Reference Carpenter2024). These orders included programs to support the mental health of family caregivers, engaging and providing resources to family caregivers during the hospital discharge process, and efforts to expand access to stipends for family caregivers of injured veterans (Biden, Reference Biden2023).
Caregiving and those who provide it continued to receive attention in the 2024 presidential election, with both candidates sketching out a plan. Democratic nominee Kamala Harris advanced a more targeted proposal focused on using Medicare to cover home care (Neuman, Burns, and Rudowitz, Reference Neuman, Burns and Rudowitz2024). Republican nominee Donald Trump highlighted support for a caregiver tax credit – though despite his victory in the presidential election, this pledge has not been borne out by his policy agenda after taking office.
Instead, six months into his presidency, Trump expanded tax credits for employers for paid family and medical leave – but offered no direct caregiver support (Dollarhide, Reference Dollarhide2025). While his tax bill includes a modest increase to the child tax credit, and a $1,000 allotment in a “Trump Account” for babies born to married parents between 2025 and 2028, no caregiving credit is included (Konish, Reference Konish2024; Luhby, Reference Luhby2024). Other components of this legislation, however, will be harmful to caregivers and those they care for. For instance, cuts to Medicaid threaten the well-being of millions of family caregivers who rely on the program for services such as home care, transportation, and food provision, and the stricter work requirements to qualify for benefits will also make it harder for family members to provide care for loved ones (Yang, Zahn, and Sunkara, Reference Yang, Zahn and Sunkara2025).
Additional aspects of Trump’s policy agenda also threaten caregivers, including immigration policy and administrative retrenchment. Dramatic cuts in agency staffing imperil both child care and child support programs (Hager, Reference Hager2025). Immigrants provide 32 percent of in-home care, a workforce that already experiences shortages, and is now going to experience a larger crisis as deportations will likely exacerbate that shortage, creating pressure on family caregivers (Freking and Mascaro, Reference Freking and Mascaro2025; McGowan, Reference 95McGowan2025; Rahman, Reference Rahman2025; Yang, Zahn and Sunkara, Reference Yang, Zahn and Sunkara2025). While individual Republicans have coauthored legislation with Democrats to expand child care accessibility and streamline Medicare authorization, these bills have failed to advance beyond committee assignment (Britt, Reference Britt2025; Kelly, Reference Kelly2025).
State Policy
Despite, and in some cases in response to, stagnation at the federal level, states have been active in caregiving policymaking. We know from existing scholarship that bipartisan support and collaboration is sometimes higher at the state level than the national level, which has provided opportunities for compromise in response to federal gridlock (Bulman-Pozen and Metzger, Reference 85Bulman-Pozen and Metzger2016; Marshall and Burgess, Reference Marshall and Burgess2022). While federal efforts illustrated a stark partisan divide when it came to funding program expansion, state-level dynamics are more nuanced and as a result, progress has been more common. On balance, state Democratic lawmakers have been more likely to support caregiving programs than their Republican counterparts. While ideological arguments for and against frequently mirror those at the national level, there have nonetheless been some instances of Republican support and bipartisan collaboration (Lovejoy, 2024; Vollers, Reference Vollers2025). That said, Republican opposition remains a consistent obstacle. As we noted earlier, caregiving policy covers a wide array of specific topics; here we focus on a few illustrative areas – paid leave, universal pre-K and home health care.
Paid Leave
The United States is one of only six Organization for Economic Cooperation and Development (OECD) countries that do not provide paid, nationally mandated, parental leave (Bipartisan Policy Center, 2022). However, several U.S. states do offer such leave, and that number has increased in recent years. The general goal of these programs is to ensure that it is financially feasible for caregivers to take a leave of absence for work to care for a newborn or family member with a serious health condition. Laws vary in terms of how the programs are funded, who is eligible; for example, how long you need to have worked for an employer to qualify, whether smaller businesses are exempted, who constitutes a family member, length of leave, and percentage of income provided (Ditzenberger, Reference Ditzenberger2025).
As of May 2025, thirteen states and the District of Columbia have passed and adopted policies on paid leave. Nine of these states (Rhode Island, California, Colorado, Connecticut, Massachusetts, New Jersey, New York, Oregon, and Washington) and Washington D.C. have paid leave programs that are currently underway (NCSL, 2024b). Four additional states (Delaware, Maine, Maryland, and Minnesota) will disperse benefits beginning in 2026 (Ditzenberger, Reference Ditzenberger2025). A number of other states also have programs that provide leave for certain sectors (Oklahoma’s law covers public school employees) or facilitate voluntary employer-based leave (NCSL, 2024b).
As we demonstrated in the previous section, paid leave is generally popular (see also Isaacs et al., Reference Isaacs, Peters and Healy2017). Nevertheless, the partisan obstacles remain daunting. Michigan Republicans denounced Governor Gretchen Whitmer’s paid leave plan as “summer break for adults” (Davidson, Reference Davidson2023). Support and opposition chiefly arise from expected quarters – labor organizations maintain that it promotes a healthy society, workers’ well-being and employee retention; business interests claim it will increase costs and decrease job opportunities (California Federation of Labor Unions, no date; NFIB, 2023). Women’s rights organizations and child welfare, senior, and disability advocates have been active supporters as well (Milkman and Appelbaum, Reference Milkman and Appelbaum2004). Conservative commentators sometimes endorse the idea of paid time off for parents but nevertheless tend to oppose government intervention to support these programs and/or view public or employer-funded programs as unrealistic and unaffordable (Pinsker, Reference Pinsker2019).
Universal Pre-K
Numerous studies have illustrated both the high costs of child care (Fraga, Dobbins and McCready, Reference Fraga, Dobbins and McCready2015; Herbst, Reference Herbst2018) and the importance of early education to child development (Gormley, et al., Reference Gormley, Gayer, Phillips and Dawson2005; Pianta et al., Reference Pianta, Barnett, Burchinal and Thornburg2009). Despite its status as a laggard state when it comes to overall welfare, the United States was actually an early adopter of free public education (Esping-Andersen, Reference Esping-Andersen1990). However, because that education starts at kindergarten, parents and caregivers often struggle to find reliable and quality care before that time.
While a number of states have developed some version of state-funded preschool, definitions of what constitutes “universal” vary. Preschool typically begins at age 2; daycare can start as early as 6 weeks (First 5 California, no date; McClure, Reference McClure2024). The majority of state-sponsored pre-K programs provide care for 4-year-olds (or predominately 4-year-olds), though some programs cover 3-year-olds as well (as of 2024, 8% of 3-year-olds are covered nationally compared to 37% of 4-year-olds) (Friednman-Krauss et al., Reference Friednman-Krauss2024b). According to the National Institute of Early Education Research, a state program can be designated “universal” if at least 70% or more of the state’s 4-year-olds are enrolled (Stanford, Reference Stanford2023). Based on this metric, five states qualify as universal: Florida, Oklahoma, Vermont, West Virginia, and Wisconsin, along with Washington, DC (Friedman-Krauss et al., Reference Friedman-Krauss2024a, Reference Friednman-Krauss2024b). If we restrict the definition further – states where all districts offer fully funded pre-K programs without income eligibility or other restrictions (e.g., lottery-based, part-time only) – three of these states (Florida, Oklahoma, and Vermont) and the district qualify.
The ideological and partisan factors noted earlier in this section apply in the case of Universal Pre-K – Republicans are more opposed on balance to statewide legislation (Cohen - Vogel, et al., Reference Cohen-Vogel2022; Curran, Reference 87Curran2015), and conservative actors are still wary of the government intervention involved. In 2021, now Vice President J.D. Vance argued that universal early education constituted a “class war against normal people” (Mahdawi, Reference Mahdawi2021). His argument, like Nixon’s decades earlier, relied on the centrality of the traditional family unit: “Normal Americans care more about their families than their jobs, and want a family policy that doesn’t shunt their kids into crap daycare so they can enjoy more ‘freedom’ in the paid labor force” (Mahdawi, Reference Mahdawi2021). It is also worth noting, though, that because so much of education policy is decided at the local level, much of Universal Pre-K policy adoption is a function of local politics and decision-making (Casto and Sipple Reference Casto and Sippel2011).
Home Health Care
As we covered in the previous section, the demand for elder care in the United States is significant and growing. One key component of this demand has been the critical need for direct care workers such as nursing assistants, home health aides, and personal care providers, that aid elderly individuals with activities of daily living and some medical support (Connacher, Reference Connacher2023). Yet, despite the demand, these caregivers are among the most poorly paid service providers in the country – making less on average than retail workers, agricultural workers, animal care providers, and retail employees (Connacher, Reference Connacher2023).
In recent decades states have pursued a variety of strategies to address these inequities. All of these policies aim to increase the wages of home health care workers to promote job satisfaction and stability. The most common approaches include “wage pass-through” policies, which tap into state Medicaid funding, “wage floor policies,” which mandate a minimum wage for domestic care workers (DCW), and “workforce development” programs, which tie pay raises to training and certification opportunities (Tyler et al., Reference Tyler2024). Stakeholders argue that the success of these policies depends on continuity, adequate funding, and oversight (Tyler et al., Reference Tyler2024). According to the U.S. Department of Health & Human Services, twenty-two states and Washington D.C. have adopted wage pass-through policies, seven states have adopted minimum wage policies, and five states have adopted workforce development policies (Tyler et al., Reference Tyler2024).
Supporters of these policies, unions, and progressive advocacy groups emphasize the importance of valuing care and the risk to patients of staffing shortages (Lane, Reference Lane2023). They note the gendered and racialized dynamics involved. SEIU, which sponsored legislation in California argues that “Care work has historically been undervalued by society … these workers are also primarily women (81%) and workers of color (77%), with almost half of them identified as Hispanic” (Williams, Reference Williams2023). Opponents, including hospitals and health centers, argue that it puts already financially strapped health providers in even more dire straits and also warn of cuts to positions and services (Lane, Reference Lane2023). This is also a unique policy in that, unlike paid leave and Universal Pre-K the benefit to family caregivers is less direct – especially since, in some cases, they may be responsible for paying home health care providers. That said, policies that improve conditions for paid care workers may indirectly benefit unpaid caregivers by ensuring high quality and readily available provision of care.
Taken together, these state policy developments illustrate that states can make progress on caregiving policy in areas where the federal government has failed, but that progress varies considerably across states, and headwinds endure. In the section that follows, we turn to a discussion of the underlying factors that animate support and resistance to caregiving policy change.
Conditions for Stagnation and Progress
The increase in caregiving demands that families are experiencing are due, in part, to factors such as an aging population, changing workforce participation, and delayed childbearing described in the previous section of this Element. These factors, alongside the general popularity of expanding support for caregivers, would seem to be fertile ground for policy progress. Yet, significant constraints persist. Why is it so hard to pass meaningful legislation when there is a clear public need for caregiving support? We argue that meaningful policy reform in the U.S. is hindered by multiple factors, including a fragmented government structure, ideological divisions, the belief that caregiving is a private responsibility, and ongoing partisan conflict.
The first consideration is a fragmented government. Policy scholars have long documented that because of the fragmented governmental context of the U.S. – bicameralism, separation of powers, weak parties (relative to other countries), heterogeneous interest groups – enacting policy is a pluralistic, laborious, and porous endeavor. At numerous points in the process, legislation is subject to alternation or opposition by a range of actors. These plentiful veto points mean that even generally popular policies typically require a considerable combination of media attention, policy entrepreneurship, coalition building, and sustained advocacy to ensure adoption. In short, significant national policy change in the U.S. is notoriously difficult to achieve (Binder, Reference Binder1999; Kagan, Reference Kagan2019; Mann and Orstein, Reference Mann and Ornstein2016; VanSickle-Ward, Reference VanSickle-Ward2014).
We have seen these challenges play out in national health care policymaking – every Democratic President since Truman attempted significant reform and failed until Obama signed the Affordable Care Act, and passage required significant compromise and faced several court battles (VanSickle-Ward and Wallsten, Reference VanSickle-Ward and Wallsten2019). We saw it in George W. Bush’s failed attempt to privatize Social Security and the Republican effort to repeal Obamacare during Trump’s first term. We also saw similar dynamics at play during congressional negotiations of Biden’s ambitious Domestic Policy Proposal Build Back Better, which kept historic advancements on climate but lost investments in child care, elder care, and housing (Kashen, Reference Kashen2022).
As is the case for many social policies, different types of fragmentation result in an interesting puzzle when it comes to caregiving policy. On the one hand, horizontal fragmentation (divided government, separation of powers) makes a national response more challenging to achieve. On the other hand, vertical fragmentation (federalism) means that in the wake of federal inaction (or limited action) states have been able to adopt their own policy responses.
But the obstacles to significant caregiving policy are not just structural; they are also ideological and sociopolitical. Orloff (Reference Orloff1993) offers a revised typology for welfare states and argues that nation-states fall into one of three dimensions: the state-market relations dimension, the stratification dimension, and the social citizenship rights/decommodification dimension.Footnote 6 Of these three dimensions, the United States falls into the state-market relations dimension, which, according to Orloff (Reference Orloff1993), is the only category characterized by its reactive nature. This means that the political system responds reactively – rather than proactively – to failures in the market or with the family, which then results in the provision of limited assistance targeted at marginal groups, particularly those perceived as deserving. Furthermore, recipients must demonstrate their need based on limited income and/or other resources. As a result, social support is often highly stigmatized, especially along racial lines (Gilens, Reference Gilens2009; Hancock, Reference Hancock2004). In fact, support for welfare policy tends to be lower among white respondents if they believe the programs disproportionately benefit minoritized racial groups (Gilens, Reference Gilens2009). Moreover, caregiving, like health care and other social supports, is linked to employment, which creates a stratified system whereby those with higher paying, more stable jobs have access to care benefits that those without such employment privilege do not. Paid family leave, for example, is more likely to be provided by employers in the financial sector than in the hospitality sector (Elser et al., Reference Elser2022). Heavy reliance on market-based solutions, which rely on creating financial incentives for individuals or companies to promote a desired outcome (e.g., school vouchers), versus more direct government provision or mandates (e.g., state-funded child care), impedes policy responses that might more substantially address these inequities (Jacobsen, Reference Jacobsen2020).
Beyond this overarching philosophical framework, caregiving in particular ties into a sense of personal, familial responsibility that is intrinsic to the United States and that often leads to reluctance to accept government support. Jessica Calarco’s (Reference Calarco2024) work illustrates that in a “DIY” society (Do It Yourself) – one where the expectation is that people will solve their own problems and therefore do not need to count on government or employers for support – women are expected to be the social safety net. Caregiving labor is frequently invisible and undervalued, and viewed as a private rather than a public concern (Levitsky, Reference Levitsky2014; Tronto, Reference Tronto2013). In the U.S., models of caregiving support are still largely rooted in a society in which men were expected to provide financial resources, and women were expected to provide domestic care despite changing labor patterns that bely this gendered division (Huber and Stephens, Reference Huber, Stephens, Armingeon and Bonoli2006, cited by Levitsky, Reference Levitsky2014). As Levitsky argues, “Relationships involving care or dependency have historically been treated as the prerogative of families rather than the state” (Levitsky, Reference Levitsky2014, pp. 91–92). Even those with the heaviest caregiving burden often struggle to see caregiving as a public problem, because norms of familial responsibility are so pervasive (Levitsky, Reference Levitsky2014). In fact, often caregivers do not even identify as such (Johns Hopkins Medicine, no date). Those who work directly with these families further illustrate this mentality. Theresa Harvath, PhD, Director of the Family Caregiving Institute at the Betty Irene Moore School of Nursing at UC, explains that family members who provide care often do not embrace the term caregiver because they feel that is simply their role as a spouse or child (Harvarth Reference Harvarth2022).
Caregiving can also tie into political belief systems. For Tronto, caregiving is inherently political: “since all relationships of care inevitably involve power, and often involve deep power differentials, all care relations are, in an important way, political” (Tronto Reference Tronto2013, p. 33). But viewing it as such challenges the individualistic perspective that often undergirds American political and economic narratives. As Tronto argues:
The work ethic model is highly individualistic … if an individual is willing to work hard, that is all that is necessary to enjoy the benefits of hard work and to live a good life … on the other hand, a relational care ethic views individual effort from a different standpoint. Given the complexity of care, caring well requires that any worker be attuned not only to his or her own welfare but also to the ways in which others also have needs – intimates in one’s household, friends and neighbors, and more distant others.
As a result, care work is often made invisible, even though it is self-evidently essential. The gendered dimension of caregiving becomes apparent here as well. Opposition to women’s suffrage, for example, was rooted in the need to keep women in the private sphere, and the logic that the care they provided there “made them ineligible for public life” (Tronto Reference Tronto2013, p. 25).
Partisanship and ideology also play a significant role. Extensive research illustrates conservative opposition to redistributive social policy (Gilens, Reference Gilens2009; Skitka and Tetlock, Reference Skitka and Tetlock1992, Reference 100Skitka and Tetlock1993). Elite-level Republican opposition to public caregiving support over the past century has been particularly consistent in recent years (Chamie, Reference Chamie2022). Scholars have noted that, at the state level, higher proportions of Republicans in the legislature contribute to a lower likelihood of expanding pre-K programs (Cohen-Vogel, et al., Reference Cohen-Vogel2022; Curran, Reference 87Curran2015). Republican opposition to public caregiving expansion is often rooted in conservative trust in the free market and distrust in government intervention. Opposition to President Joe Biden’s proposals was particularly unsurprising, given that clear reluctance to give Democrats a win was an explicit goal of Republican policymakers (Glaser and Berry, Reference 90Glaser and Berry2018). It is also true that the issue is not fully cut and dry from a partisan perspective, as evidenced by the fact that some Democratically controlled states have failed to adopt caregiving proposals and some Republican states have adopted them (Balingit, Reference Balingit2024; White, et al., Reference White2015). But the general trends are nonetheless notable, both because they persist despite general public support (Merolla et al., Reference Merolla2021), and because the traditional gender views underlying opposition have become particularly stark as of late. As Representative Charlie Shepherd, an Idaho House Republican, stated in 2021 in opposition to accepting a federal grant to support early childhood education: “I don’t think anybody does a better job than mothers in the home, and any bill that makes it easier or more convenient for mothers to come out of the home and let others raise their child, I don’t think that’s a good direction for us to be going” (Boone, Reference Boone2021). More broadly, expansive caregiving policy may be a causality of a Republican party leadership that has grown increasingly extreme, both ideologically and in terms of legislative tactics (Hacker and Pierson, Reference Hacker and Pierson2005; Mann and Ornstein, Reference Mann and Ornstein2016).
Conclusion
Like so much social policy in the United States, caregiving policies are a patchwork of programs. Following the trend of U.S. welfare policy in general, federal support is limited, and state responses vary considerably. This lack of direct caregiver support is coming at a time when a majority of Republicans and Democrats in the general population are in favor of federal legislation intended on easing the caregiving burden for those providing informal care (Hall, Reference Hall2025). The public generally supports a more aggressive policy response, but institutional, partisan, and ideological obstacles persist. As we turn in subsequent sections to unpacking how the public views these policies, and what factors shape these views, it is important to keep this fragmentation, variability, and disconnect between public preferences and policy responsiveness in mind. We know that the pandemic drew attention to caregiving challenges, but we know much less about how the intense caregiving experiences that unfolded during the pandemic are related to views on caregiving policy, and how the relationship between experience and attitudes may vary across gender, racial and ethnic lines. In the sections that follow, we turn to these questions.
3 The Impact of Being a Caregiver (with Sarah Hayes)
Introduction
During the height of the pandemic in May 2020, a handful of informal caregivers were interviewed by Judy Woodruff of PBS and asked what challenges the pandemic added to their care responsibilities (Woodruff, Reference Woodruff2020). Hector Alvarado, a Latino man from California, shared that he has been caring for his grandmother since he was a young boy (at the time of the interview he was thirty-seven). During the pandemic, his grandmother went into dementia-related psychosis, resulting in him having to provide 24-hour care for her. Because of the virus, he did this with no outside assistance. Another interviewee, Deanna Ludwig, a white woman from Wisconsin, stated that she cared for her husband, who, after a bilateral stroke, required full-time care. Like Alvarado, Ludwig was left on her own because home health workers were no longer allowed to visit her home.
While Alvarado’s and Ludwig’s experiences may not be representative of all caregivers’ experiences during the pandemic, they are by no means extreme outliers. When the COVID-19 pandemic began in 2020, most Americans’ lives were upended, especially those caring for family members. Daycares, preschools, and schools closed and access to in-home elder care was dramatically limited. Caregiving during “normal times” is a challenging and resource-intensive role. During the pandemic, this role was even more intense for many people. As we illustrated in the previous section, individuals do not always see their caregiving roles as connected to politics, but as something in the private sphere. Does this intense and more challenging context help people connect their personal experiences with caregiving to a demand for government assistance and support?
In this section, we examine if and how experiences with caregiving during a stressful time like a global pandemic influences peoples’ attitudes toward policy that could assist people engaged in child, elder, and family care. While there has been research documenting the increase in caregiving responsibilities during the pandemic (Beach, et al., Reference Beach, Schulz, Donovan and Rosland2021; Htun, Reference Htun2021; Power, Reference Power2020), it is unclear how these experiences have shaped individual policy preferences. We explore this here.
Applying the theoretical lenses of social roles and self-interest, as well as examining the diverse perspectives among women and men and of members from different racial and ethnic backgrounds, we argue that caregiving during the pandemic should be positively associated with support for policies meant to aid families and support for caregiving. In this study, we include an oversample of caregivers of color because, as Navaie-Waliser and colleagues (Reference Navaie-Waliser, Feldman, Gould, Levine, Kuerbis and Donelan2001) and Howard (Reference Howard2023) note, the informal caregiving burden is more pronounced among communities of color than among the white population. Here, we unpack how dramatic experiences that make caregiving more challenging and salient, like a global pandemic, may shape policy attitudes more broadly for both white and nonwhite populations.
We find that being a caregiver during the pandemic is linked to higher levels of support for care policies. This relationship is largely similar for women and men, when using a dichotomous measure for caregiving. However, when we measure caregiving in a different way – asking respondents if they spent more, less, or about the same time caregiving during the pandemic (compared to before the pandemic) – we find that men who spent more time caregiving have higher levels of support for care policies. These findings suggest that the experience of doing more care work during the pandemic may have elevated the importance of care policies in the minds of men.
We also find some differences across racial groups when it comes to the impact of caregiving on policy attitudes. Caregiving appears to shape the stances of white respondents more than those of nonwhite respondents. This is likely due to already higher levels of support for care policies among Black, Latinx, and Asian communities. Taken together, these findings help us trace out how gender and race shape levels of policy support.
How Caregiving Impacts Support for Caregiving Policies
Scholars who examine social policy preferences have developed different theoretical perspectives on what drives these preferences. Chief among these are arguments focused on social role theory, self-interest, and racial and ethnic differences stemming from diverse cultural perspectives about caregiving.Footnote 7 In this section, we use each of these theoretical frameworks to examine how caregiving responsibilities during the pandemic might be linked to policy preferences. These theoretical frameworks are not mutually exclusive; they could be operating in tandem.
Social Role Theory
First, we consider whether social role theory might explain whether caregivers who provided care during the pandemic are more supportive of caregiving policies than individuals without caregiving responsibilities, and whether gender moderates this relationship. As discussed in the first section of this Element, social role theory says that societies are organized around a gendered division of labor as well as gender-coded roles and norms. In this context, diffuse gender roles mean that women are expected to be nurturing, communal, and warm, while men are socialized to be aggressive, independent, and agentic (Eagly and Steffen, Reference 88Eagly and Steffen1984; Eagly and Wood, Reference Eagly and Wood2012; Schneider and Bos, Reference Schneider and Bos2019). Diffuse gender roles explain why women and men are supportive of policies that reflect the traits they are socialized to hold (Crowder-Meyer, Reference Crowder-Meyer2022; Diekman and Schneider, Reference Diekman and Schneider2010; Schneider and Bos, Reference Schneider and Bos2019). Specific social roles, on the other hand, suggest that regardless of gender, when individuals engage in roles that involve nurturing or care, they will also support social policies that promote nurturing or care (Eagly, et al., Reference Eagly, Wood, Diekman, Eckes and Trautner2000; Schneider and Bos, Reference Schneider and Bos2019). Therefore, social role theory leads us to our first hypothesis.
Social Role Theory Hypothesis (H1a): Individuals involved in caregiving roles will be more inclined than non-caregivers to support a range of policies that provide government assistance for caregiving.
That is, they will be more likely to support not only policies that directly relate to the type of care they provide (for example, elder care), but support policies that provide services more broadly since they become more attuned to communal well-being.
While we might expect these patterns across all caregivers, could it be that the translation of caregiving experiences to policy preferences is different for women and men? Social role theory suggests that because of diffuse gender roles, women are already generally supportive of these policies because they are socialized into nurturing roles regardless of whether they are themselves caregivers, which is a specific social role. So direct caregiving experience will have a more limited impact in terms of differentiating attitudes among women. It is also the case that diffuse gender roles and specific social roles often overlap (e.g., women as nurses or men as CEOs), but sometimes they may not (e.g., men as nurses or women as CEOs). According to Schneider and Bos (Reference Schneider and Bos2019), social role theory predicts that “both diffuse gender roles as well as specific social and occupational roles should be more predictive of important political outcomes than biological sex alone” (p. 177). Thus, a woman who is a caregiver should have higher levels of support for social support policies than a woman who is not a caregiver. In fact, studies of women and motherhood bear this out (Elder and Greene, Reference Elder and Greene2012; Greenlee, Reference Greenlee2014). To account for the possible relationship between individuals’ beliefs about gender roles and their support for caregiving policies, we include measures of respondents’ attitudes toward gender roles. This allows us to control for the possibility that these beliefs are driving policy preferences.
For men, the distinction between diffuse gender roles and specific social roles within social role theory suggests that the caregiving experience will have a larger effect because they are not typically socialized into a nurturing role and engaging in caregiving represents a greater departure from traditional gender norms. In other words, they have “further to go” in terms of developing support for caregiving policies. Thus, men who are caregivers should have higher levels of support for caregiving policies than men who are not caregivers. In scholarship that looks simply at men as fathers, the findings are mixed as to whether fatherhood leads to support for social support policies (Elder and Greene, Reference Elder and Greene2007; Greenlee, Reference Greenlee2014). However, in work where men’s roles as fathers are made salient, when fathers play a greater role in caregiving, or when a particular type of fathering role is explored (e.g., having one’s first child be a daughter), then fathers do differ from men without children in ways that fit with social role theory (Greenlee, et al., Reference Greenlee, Nteta, Rhodes and Sharrow2020; Klar, et al., Reference 93Klar, Madonia and Schneider2014; Naurin, et al., Reference Naurin, Markstedt, Schneider, Lizotte and Stolle2025; Sharrow, et al., Reference Sharrow, Rhodes, Nteta and Greenlee2018). Thus, we anticipate our next hypothesis, stating that men who are engaged in caregiving in the context of the pandemic will be more supportive of caregiving policies than men who are not caregivers.Footnote 8
Caregiving Social Role Hypothesis (H1b): The association between caregiving responsibilities and policy attitudes will be greater for men than women.
In setting this expectation, we assert that the specific role of caregiver will be important to bolstering policy support among some men.
We also consider the influence of the race and ethnicity of caregivers within the context of social role theory. To our knowledge there is little research regarding the policy attitudes of caregivers of color despite their substantial role in providing informal care (Navaie-Waliser et al., Reference Navaie-Waliser, Feldman, Gould, Levine, Kuerbis and Donelan2001). An analysis of racial and ethnic variation in caregiving attitudes is essential because it can help to account for individual, structural, and cultural factors that result in variations between groups (Cohen, et al., Reference Cohen, Sabik, Cook, Azzoli and Mendez-Luck2019; Sabik, Reference Sabik, Roberts, Curtin, Duncan and Cortina2016). For instance, research by Scharlach, et al. (Reference Scharlach, Kellam, Ong, Baskin, Goldstein and Fox2006) found that cultural norms are a major reason why people who identify as Asian, Black, and Latinx provide informal care for family and friends. Familism and collectivist attitudes guide the sense of duty that caregivers of color feel when asked why they provide informal care (Scharlach et al., Reference Scharlach, Kellam, Ong, Baskin, Goldstein and Fox2006). Yet these caregivers also understand that caregiving can be challenging and that obstacles, such as a lack of resources, exist (Scharlach et al., Reference Scharlach, Kellam, Ong, Baskin, Goldstein and Fox2006). For these reasons, we anticipate that caregivers of color will be more supportive of caregiving policies than whites. Indeed, since people of color are socialized to think of community (Dawson, Reference Dawson1995; Guinta et al., Reference Guinta, Hunt and Dal Santo2004; White and Laird, Reference White and Laird2020) and exhibit greater support for such policies on average (Tate Reference Tate1994, Reference Tate2010), the effect of being a caregiver on attitudes may be more muted than it is for whites. There is also evidence that Black and Latinx communities tend to view parenting as more central to their identities than their white counterparts, which again may mean that these respondents are typically more inclined to be supportive of caregiving policies and hence will have less movement driven by a particular caregiving burden (Miller Reference Miller2023).
Caregiving Social Role and Race Hypothesis (H1c): The association between caregiving responsibilities and policy attitudes will be greater for white respondents than people of color.
Self-Interest Theory
Another relevant theoretical perspective we consider when thinking about whether caregivers are more supportive of caregiving policies that are related to their caregiving is self-interest. Self-interest as a theoretical framework suggests that individuals with caregiving responsibilities during the pandemic will be more supportive of policies that address the type of caregiving responsibilities that they have, by offering support to the population for whom they care (e.g., children or elderly) or by offering support to families who are giving that particular type of care (e.g., subsidies for child care). Thus, we expect that the nature of respondents’ caregiving role will determine whether there is an association with specific care support policies.
As we noted in Section 1, it may seem that this hypothesis – caregivers supporting caregiving policy out of self-interest – is intuitive. However, a long line of research in public opinion has found limited instances in which individuals connect self-interest to policy preferences (Chong, et al., Reference Chong, Citrin and Conley2001; Hainmueller and Hopkins, Reference Hainmueller and Hopkins2014; Sears and Funk, Reference Sears and Funk1991). Furthermore, the effects of self-interest may be even weaker in a period of high partisan polarization, where partisanship may mitigate the effect of other factors on public opinion (Green, et al., Reference Green, Palmquist and Schickler2002).
Scholars have argued that benefiting from public services can drive support for the policies that support those services in some cases (Burlacu and Lühiste, Reference Burlacu and Lühiste2021), though empirical support for self-interest effects has often been mixed (Sears and Citrin, Reference Sears and Citrin1982). One challenge to finding effects of self-interest on policy attitudes is that individuals may not always connect their specific circumstances to government policy (Egan and Mullin, Reference Egan and Mullin2012; Lau and Heldman, Reference Lau and Heldman2009). And we know this to be true of caregiving as well (Levitsky, Reference Levitsky2014) because caregiving is often viewed as a personal or family responsibility, making government assistance through policy appear challenging for caregivers who see their role as a private one and therefore outside of public solutions. However, individuals are more likely to connect self-interest to policy attitudes when the stakes are clear, and individuals are thinking about the costs and benefits of the policy (Chong, et al., Reference Chong, Citrin and Conley2001; Sears and Citrin, Reference Sears and Citrin1982), including when forms of caregiving are connected to support for specific policies that are connected to those types of care (Greenlee, Reference Greenlee2014). Thus, in this Element, we investigate whether support for specific types of caregiving policies is found only among respondents who could presumably benefit from those policies.
As noted earlier, in the context of the pandemic, issues around caregiving and the need for greater governmental support became particularly salient and clearer to those engaged in caregiving activities. Indeed, these conditions aid us in examining whether self-interest is associated with policy support, because respondents are able to see more clearly the relevance of these policies to their lives, feel the “high stakes” of the care crunch, and recognize how they might benefit (Sears and Citrin, Reference Sears and Citrin1982).
These two theoretical perspectives – social role theory and self-interest – lead to the expectation that experiences with caregiving during the pandemic should be associated with greater support for caregiving policies, though in different ways. Social role theory predicts that caregivers will support caregiving policies regardless of the population that they serve. In addition, when we consider gender and race and ethnicity as they intersect with social role theory, we anticipate that the association between caregiving and policy support should be stronger among men and whites relative to women and people of color. On the other hand, self-interest should motivate greater support for only those policies that are connected to one’s own caregiving duties. For example, individuals who care for elders should be most interested in policies linked to elder care, while parents should be more supportive of policies that help children and schools. This leads us to our next set of hypotheses.
Self-Interest Hypothesis (H2a): Individuals with caregiving responsibilities will be more supportive of only those caregiving policies that connect with their caregiving responsibilities, relative to individuals without caregiving responsibilities.
Caregiving Self-Interest Hypothesis (H2b): The association between caregiving responsibilities and policy attitudes will be similar for men and women and similar across racial and ethnic groups based on the type of policy and caregiving role they hold.
Data and Methods
Our analysis uses the NCCS, which includes questions that capture attitudes on policies directly related to child care and elder care. For our main dependent variable in analyzing the social roles hypotheses, we construct an additive scale based on policy questions drawn from current policy debates around caregiving. We use a wide range of policies since social role theory predicts that being in the role of a caregiver should lead to support even for policies that may not connect directly to the type of care being provided. Specifically, respondents were asked, “To what extent do you support or oppose the following proposals?” The various policies – all noted in Table 1 – were drawn from proposals included in President Biden’s domestic policy investments plan, commonly called “Build Back Better.” For each policy, respondents were asked about the extent to which they support or oppose the given proposal on a five-point scale. All were coded such that higher values are more supportive of the given policy. We added them together and rescaled the Caregiving Policy Index (CPI) to range from 0 to 1 (Cronbach’s alpha = 0.94).Footnote 9 Mean support for the CPI is 0.67 in the full weighted sample, a fairly high level of support. In Figure 4, we show support broken down by the respondent’s gender identity and race/ethnicity. Within each racial and ethnic group, women are higher on the caregiving policy scale, and across groups, Black respondents are most supportive.
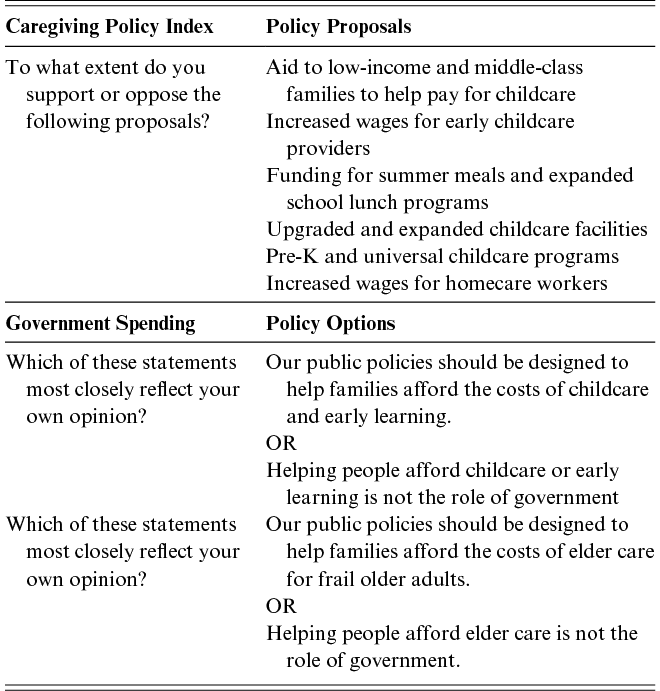
When we consider factors that influence the CPI, having any caregiving responsibilities during the pandemic serves as our primary independent variable. As outlined in Section 1, respondents were asked to indicate for whom they provided care during the pandemic. In the full sample, 65.3% indicated having some type of caregiving responsibility. This measure enables us to test our first hypothesis (H1a).
Mean Support for the Caregiving Policy Index (CPI) by Gender and Race.
Note: The figure shows mean support on the CPI by race and gender group. Survey weights are used.
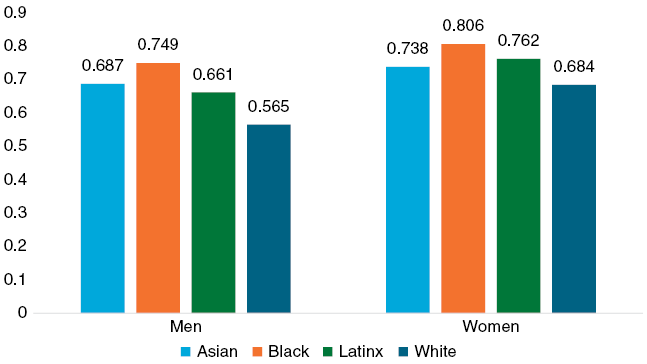
In order to examine the self-interest hypotheses, our main dependent variables are questions specifically asking about peoples’ opinions regarding helping families afford the costs of child care or elder care. We include these as our main test because they most crisply enable us to test for self-interest. Table 1 contains the exact wording. We created two separate dummy variables – one for child care and one for elder care – where 1 represents peoples’ interest in government support for child care and elder care, respectively, and a 0 equates to no interest in government involvement in these kinds of assistance. In our full sample, 71% of respondents indicated interest in support for child care, while 78% favored support for elder care. In follow-up analyses, we also break up the CPI by whether the items capture policies related to children for one measure or eldercare for the other measure.
As independent variables in the models to test the self-interest hypothesis (H2a), we break up the caregiving responsibilities measure by the type of care individuals provide, with a focus on whether the respondent cares for children under eighteen and/or elders. Here, we would expect to find a positive association for the type of caregiving that connects to policies in that area.Footnote 10
Some of our hypotheses relate to whether the effect of the caregiving items varies by gender identity and race. To measure gender identity, we asked respondents to report their gender identity.Footnote 11 Race and ethnicity data were collected by the survey firm and used to draw the sample.
In addition to our theoretical constructs of interest, our analyses account for other factors that may influence policy attitudes. Most notably, while relevant to nearly all political attitudes, partisanship shapes views of the pandemic and public policies which aim to address the multitude of public needs (Druckman, et al., Reference Druckman, Klar, Krupnikov, Levendusky and Ryan2021; Gadarian, et al., Reference Gadarian, Goodman and Pepinsky2021), as does ideology. We use the 7-point party identification scale, where higher values indicate being more Republican, and include a 5-point ideology scale, where higher values are more conservative. We also account for respondent age, education, income, marital status, and employment status. These measures are all rescaled to run from 0 to 1. Finally, we include a battery of questions meant to capture perceptions of gender roles in order to reduce any bias resulting from gendered expectations.Footnote 12 To condense the number of measures capturing gender roles in the analyses, we used a method called “factor analysis” to see if some of these items go together and two underlying constructs emerged. One “factor” captures views about parental roles and the other views about children. These measures are coded such that higher values reflect that people support less traditional gender roles for children (gender roles child) and less traditional gender roles for parents (gender roles parent).Footnote 13
The remainder of this section proceeds as follows. First, we test our hypotheses grounded in social role theory (H1a–H1c) and examine the influence of being a caregiver on attitudes about caregiving using the CPI. Next, we assess the self-interest hypotheses (H2a–H2b) and examine the association between the type of caregiving (e.g., parent) and support for policies related to that role (e.g., child care). Lastly, we conclude this section by summarizing our findings and discussing some broader implications.
Findings to Assess the Social Role Hypotheses: Caregiving Responsibilities and Support for Caregiving Policies
First, we examine whether those with caregiving responsibilities are more supportive of a range of policy attitudes that address caregiving needs (H1). To do so, we run an analysis where we predict the CPI with our measure of caregiving responsibilities, while also accounting for the other factors (control variables) mentioned earlier that might also influence these opinions. We illustrate the coefficients from an OLS model in Figure 5.
As expected, having caregiving responsibilities during the pandemic is associated with greater support for caregiving policies (b = 0.06, p < .01), in support of H1a, our first hypothesis.Footnote 14 The size of the substantive effect is, however, small, moving support by only .06 units on the 0 to 1 scale. The other variables perform as we would expect, with men being less supportive than women (b = 0.07, p < 0.01), and the size of the substantive effect is similar to caregiving responsibilities. Support is also higher among racial and ethnic minorities compared to whites, as expected. Black respondents are .10 units higher on the CPI compared to white respondents (p < 0.01), and the coefficients are .05 for Latinx and .04 for Asian respondents (both at p < 0.01). Republicans, those high in income and conservatives are also less supportive of caregiving policies, and the effect of ideology is the strongest in the model (b = −0.35, p < 0.01). We also observe that those who are married (b = 0.05, p < 0.01) and have less traditional views on gender roles are more supportive of caregiving policies.
OLS on Caregiving Policy Index (CPI), Full Sample.
Note: The figure plots beta coefficients from the OLS model. 90% confidence intervals depicted. Survey weights are used in the analysis.
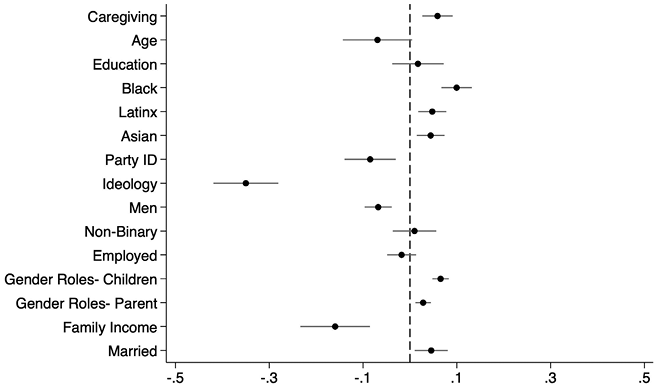
We are also interested in assessing if the association between being a caregiver and attitudes toward social support policies is higher among men (H1b), since they are less socialized into providing care (or supporting social support policies) compared to women. To explore this relationship with respect to respondent gender identity, we run the same OLS models, but run the analysis separately for men and women, and then test whether the coefficients on the caregiving items are statistically different across models.Footnote 15
In Figure 6, we show the results for the model with caregiving responsibilities, and we observe that the caregiving responsibility measure is significant for women (b = 0.09; p < 0.001), but not for men (b = 0.03; p = 0.25). While it looks as if the effect is more substantial for women, if we test the effect of the caregiving responsibility measure across models, there is no statistically significant difference (p = 0.17). Either way, we clearly do not find any evidence that the association between caregiving responsibilities and policy attitudes toward providing care are more pronounced for men; thus, H1b is not supported.
OLS on Caregiving Policy Index (CPI), by Gender.
Note: The figure plots beta coefficients from the OLS models, one run on a subset of women, and the other on a subset of men. 90% confidence intervals depicted. Survey weights are used in the analysis.
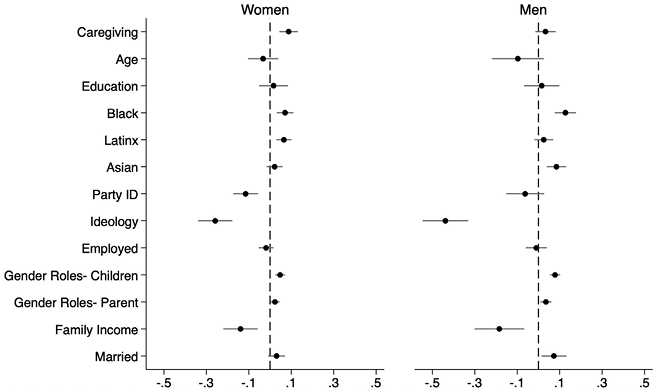
It is a bit surprising that we do not observe any association between caregiving responsibilities and social support policies among men.Footnote 16 It could be that many men report caregiving responsibilities, but the scope of those responsibilities may not be sufficient to generate greater support for these policies. We therefore turn to another question that we asked in the survey to assess linkages between caregiving experiences and policy support. More specifically, respondents were asked: “Thinking about all of the people who you helped or took care of in your personal life, during the COVID-19 pandemic, do you think the time that you spent helping or caring for others increased, decreased, or stayed the same?” We created a series of dummy variables to reflect whether the individual spent increased time, decreased time, or the same amount of time providing care. Our baseline group consists of individuals without caregiving responsibilities during the pandemic.
We run the same model as before but replace the caregiving measure with dummy variables for whether respondents reported spending increased, decreased, or the same amount of time on caregiving during the pandemic, with the baseline being no time on caregiving (non-caregivers). In Figure 7, we provide results broken down by gender to hone in on whether men in particular come to link caregiving with greater support for caregiving policies when they spend more time in the role (and note results for the full sample in footnotes).
OLS on Caregiving Policy Index (CPI) by Caregiving Time, by Gender.
Note: The figure plots beta coefficients from the OLS models, one run on a subset of women, and the other on a subset of men. 90% confidence intervals depicted. Survey weights are used in the analysis.
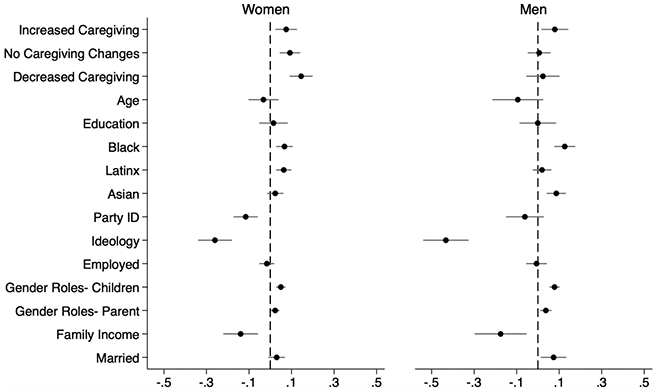
Among men, only the increased caregiving time measure is significantly different from the baseline of no caregiving (b = 0.08; p < 0.05), and it is also different from those who reported the same amount of time caregiving (p < 0.05). Therefore, when men spend more time in a caregiving role, they are more likely to connect their experiences to policy support. This is particularly interesting since many men in our sample experienced increased caregiving responsibilities during the pandemic, about 23%. Among women, all three-time variables are positive and significant relative to the baseline of no caregiving, which suggests that the role itself rather than the amount of time spent in the role is associated with policy support.Footnote 17 These findings suggest that as men spend more time engaging in providing care – rather than simply identifying as caregivers – they become more attuned to the challenges involved, which in turn results in support for a stronger care infrastructure.
Next, we explore these dynamics across each racial and ethnic group in our sample to test H1c. We run the same set of analyses, but now split by racial and ethnic groups, and illustrate the findings in Figure 8. The caregiving dummy variable is significant among whites (b = 0.08; p < 0.01). Therefore, whites with caregiving responsibilities are more supportive of caregiving policies than their counterparts without such responsibilities. Is the coefficient on caregiving responsibilities among whites significantly different from the coefficient for Asian, Black, and Latinx respondents? To answer this question, we test the coefficient on the caregiving measure in the model for whites compared to each racial and ethnic group. There is a marginally significant difference relative to Black respondents (p < 0.10), but no significant difference relative to Asian or Latinx respondents. We find a similar pattern if we look at the results with the caregiving time measures.Footnote 18 This part of our analysis points to mixed support for H1c.
OLS on Caregiving Policy Index (CPI), by Race.
Note: The figure plots beta coefficients from four OLS models, one for each racial group. 90% confidence intervals depicted. Survey weights are used in the analysis.
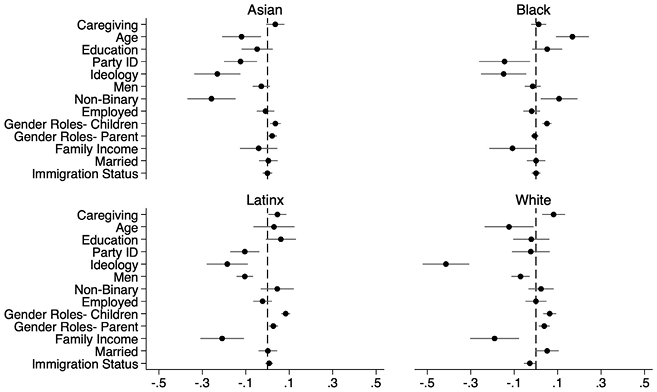
For both the gender (H1b) and racial breakdowns (H1c) our results did not fully align with our expectations. The stronger support among women when compared to men could be a result of diffuse gender roles in that even during a global pandemic when men may be helping with providing care, women are still the ones doing a majority of the work. Only men who spent more time in the role were supportive of policies that help with caregiving. Among both people of color and white caregivers, we may be witnessing the impact of a growing number of families for whom caregiving has become a lived reality. So, as caregiving becomes more ubiquitous for everyone regardless of race and ethnicity, it could be why we do not see consistent differences between white and nonwhite caregivers.
Findings to Assess the Self-Interest Hypotheses: How the Type of Caregiving Responsibility Relates to Support for Particular Caregiving Policies
Next, we examine our expectations for self-interest to see if the type of care provided influences support for the type of policies that caregivers favor. Respondents were asked to select which statement best reflects their views: (1) our public policies should be designed to help families afford the costs of child care and early learning; or, (2) helping people afford child care or early learning is not the role of government (see also Table 1). The same type of question was asked with respect to elder care (see Table 1). We recode these measures such that the second option is the baseline category (or coded as 0), so higher values reflect greater support for helping families afford child care and elder care, respectively.
As our main predictors, we further breakdown our caregiving responsibility dummy into the type of care responsibilities that people have: care for children under eighteen only, elder care only, care for adult children, care for both children and elderly family members, and those who care for others. If the self-interest hypothesis is supported (H2a), we should observe a significant association between the type of role and type of policy. For example, only people with children under eighteen should be supportive of greater support for child care assistance, and only those who care for elders should support greater government assistance in this domain.
Results in Figures 9 and 10 indicate mixed support for H2a. We find a meaningful association between support for spending on child care among respondents who only care for children under eighteen (b = 0.409; p < 0.1) and those who care for children and elderly individuals (b = 0.525; p < 0.05), which provides some initial support for H2a. However, those who provide only elder care (b = 0.273; p < 0.1) are also supportive of increased spending on child care, which runs counter to a self-interest effect.Footnote 19
OLS on Child Care Cost Support by Caregiver Type.
Note: The figure plots beta coefficients from the OLS model. 90% confidence intervals depicted. Survey weights are used in the analysis.
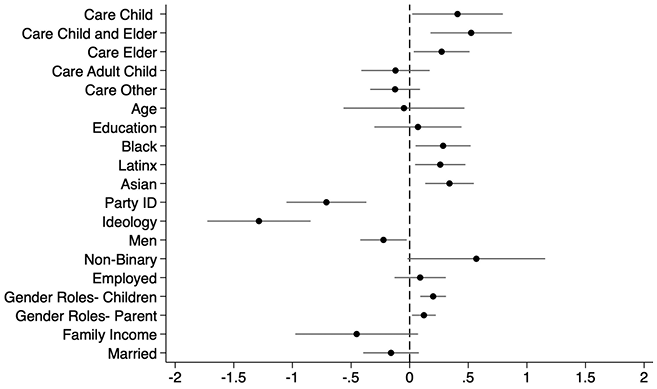
Turning to support for spending on elder care (Figure 10), we find a significant association with people caring for older adults (b = 0.387; p < 0.05) and those who care for children and elders (b = 0.351; p < 0.1), as expected.Footnote 20 In this case, there is no positive and significant association for those without elder care responsibilities, supporting a self-interest framework. Looking at other determinants, we find support for both child care and elder care spending among those who identify as women and those who hold less traditional views of gender roles for children and parents. People identifying as conservative appear less supportive of both policies. For respondents of color, we find positive and significant support when asking about assisting with child care costs for Blacks (b = 0.285; p < 0.05), Latinx (b = 0.261; p < 0.05), and Asians (b = 0.340; p < 0.01), but only Asians (b = 0.319; p < 0.05) support spending on elder care relative to white caregivers.
OLS on Elder Care Cost Support by Caregiver Type.
Note: The figure plots beta coefficients from the OLS model. 90% confidence intervals depicted. Survey weights are used in the analysis.
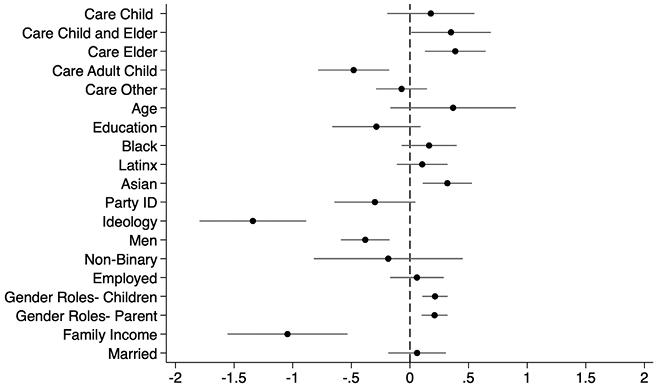
Our final hypothesis related to self-interest is that policy attitudes will be similar for men and women and similar across racial and ethnic groups based on the type of policy and caregiving role they hold (H2b). To assess this hypothesis, we first look at the results broken down by gender. In Figure 11, we show the associations between type of caregiving responsibilities and support for policies that help families with child care broken down by gender.
OLS on Child Care Cost Support by Caregiver Type and by Gender.
Note: The figure plots beta coefficients from the OLS models, one run on a subset of women, and the other on a subset of men. 90% confidence intervals depicted. Survey weights are used in the analysis.
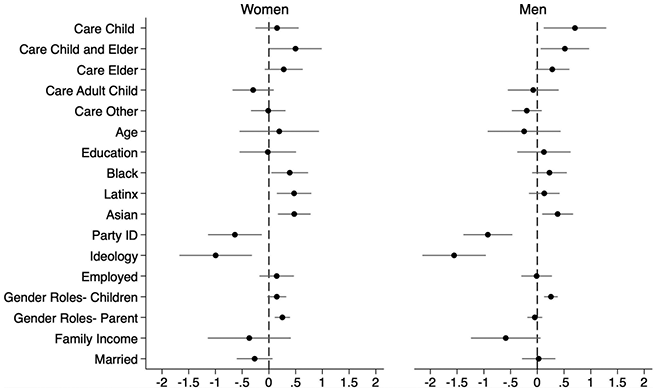
Among women, little is statistically meaningful except those who care for children and elders (and only marginally so). Among men, we observe findings more in line with self-interest patterns whereby significant associations appear for men who care for young children (whether or not they also care for elders). However, if we directly compare the effect of each type of caregiving responsibility between women and men (in other words, across models), we do not find any statistically meaningful differences. These findings, therefore, provide some support for H2b, since there are no meaningful differences between men and women.
Next, we examine the associations for support for elder care in Figure 12. Among women and men, none of the caregiving measures are significant and positively associated with support for elder care, and they are not distinct from each other, in line with H2b. The weaker effects for the caregiving measures in these models are likely because of the lower sample size when we split the sample.
OLS on Elder Care Cost Support by Caregiver Type and by Gender.
Note: The figure plots beta coefficients from the OLS models, one run on a subset of women, and the other on a subset of men. 90% confidence intervals depicted. Survey weights are used in the analysis.
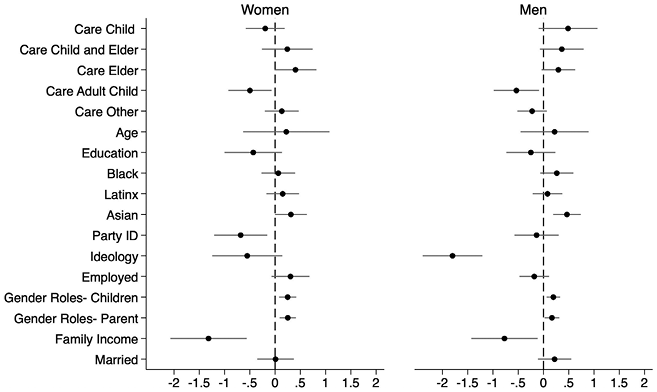
Finally, we run the same type of analyses but this time looking at the association between the type of caregiving and type of policy by race. Turning first to support for help with child care costs (Figure 13), we do not see any positive and significant association for child care responsibilities among Asians, Blacks, or Latinx respondents, though whites with young children are more supportive of assistance. Whites with elder care responsibilities are also more supportive, which is counter to self-interest motivations. If we test the coefficients across models, the differences between whites and people of color are statistically different for those with young children and no elder care responsibilities (and whites with elder care compared to Blacks with elder care responsibilities). These results do not support H2b since we observe differences between whites and people of color in many cases, and we again see that those with elder care responsibilities also support greater assistance.
OLS on Child Care Cost Support by Caregiver Type and by Race.
Note: The figure plots beta coefficients for the type of caregiving responsibility from four OLS models, one for each racial group. 90% confidence intervals depicted. Survey weights are used in the analysis. The models also control for age, education, party identification, ideology, employment status, immigration status, marital status, views on gender roles, and family income.
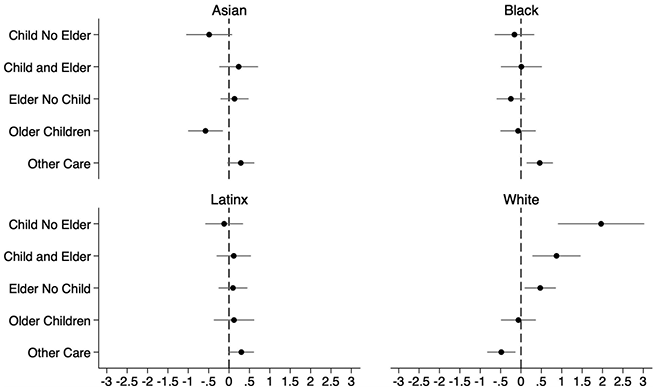
We observe very similar patterns on support for elder care among whites, with those caring for young children and elders being more supportive of government assistance (Figure 14). Effects are largely null for Blacks and Latinx respondents. The only group where we see hypothesized self-interest patterns are for Asians, in which we find a positive and significant association among those who only care for elders. When we compare the effects of caregiving responsibility types across models, we again observe meaningful differences between whites and all other groups for those who care for only children under eighteen, and relative to Blacks and Latinos who only care for elders. Again, this pattern of findings does not support H2b, which posited no differences across racial and ethnic groups.
OLS on Elder Care Cost Support by Caregiver Type and by Race.
Note: The figure plots beta coefficients for the type of caregiving responsibility from four OLS models, one for each racial group. 90% confidence intervals are depicted. Survey weights are used in the analysis. The models also control for age, education, party identification, ideology, employment status, immigration status, marital status, views on gender roles, and family income.
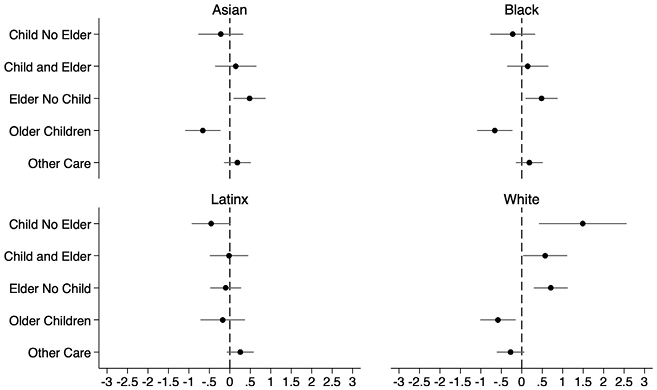
What about Partisanship?
While we do not state specific hypotheses about intersections between partisanship and caregiving on policy attitudes, we wanted to examine whether the impact of caregiving responsibilities on policy opinions varies across different partisan groups, especially given high levels of partisan polarization in U.S. politics. The assumption here would be that having caregiving responsibilities translates to support for government policies among Democrats and possibly Independents, while Republicans may not view government action in this arena as appropriate (see discussion in Section 2).
We run an OLS model separately for Democrats, Independents, and Republicans, and then test whether the coefficients on the caregiving items are statistically different across models. As is clear from Figure 15, the association between caregiving responsibilities and the Caregiving Policy Index is positive and significant for all three groups. And if we test whether the coefficient on the caregiving responsibility measure is equal across equations, we observe an even stronger association among Republicans compared to Democrats (p = 0.02). In other words, the correlation between caregiving responsibilities and policy attitudes appears to matter regardless of one’s partisan stripes, and even more so for a group whose predispositions might lead us to expect a more limited association. Given what we know about how powerfully partisanship tends to determine policy outlook, this is a striking finding.
OLS on Support for the Caregiving Policy Index (CPI) by Party Identification.
Note: The figure plots the beta coefficient on the caregiving responsibility dummy variable from three OLS models, one for each partisan group. 90% confidence intervals depicted. Survey weights are used in the analysis. The models also control for age, education, gender, party identification, ideology, employment status, racial group, marital status, views on gender roles, and family income.
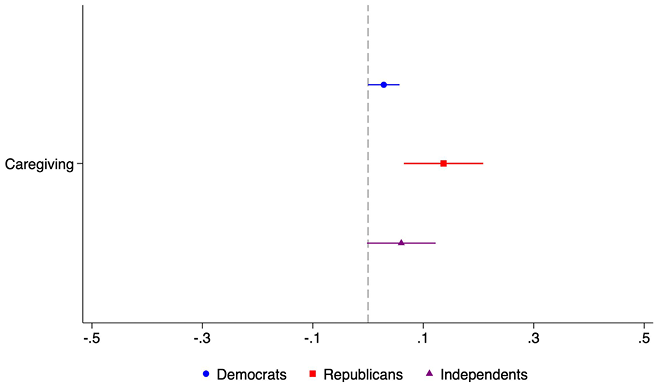
Conclusion
In this section, we have demonstrated how the role of caregiver is related to peoples’ policy attitudes. Specifically, we were interested in opinions regarding spending on policies that could assist caregivers in their daily work. As we noted in the introduction, COVID-19 looms large in our understanding of caregiving politics and policy. In this section, we assessed how the caregiving burden faced by individuals during the first two years of the pandemic was associated with their views of policies aimed at alleviating that burden. Using the theoretical lenses of social role theory (in the context of which, we examine gender and racial differences) and self-interest, we hypothesize how caregiving experiences during the pandemic shaped the views of the American public. Our findings show that caregiving responsibilities during the pandemic are correlated with attitudes toward policies designed to provide resources and recognition of caregiving. On balance the findings provide more robust support for the social role theory than for the self-interest theory, though we do, in some instances, find that our results align with self-interest.
In Table 2, we summarize our findings for how caregiving during the COVID-19 pandemic is associated with opinions on caregiving policies intended to reinforce the care infrastructure of the country. We find evidence that general experience with caregiving during the pandemic is linked to higher levels of support for some of these policies, with caregivers more supportive than non-caregivers (H1a). Importantly, while women and people of color start with higher baseline support for caregiving policies, the effects of caregiving responsibilities are mostly similar between men and women. That said, we recognize that there is some interesting variation across racial and ethnic groups. As our findings demonstrate, caregivers of different racial and ethnic backgrounds tend to favor support policies for people who provide care; though significant differences emerge between only Black and white caregivers. Yet, these analyses are unique because instead of looking at caregivers’ policy opinions as a whole, we disaggregate by race and ethnicity where possible to allow for better insight.
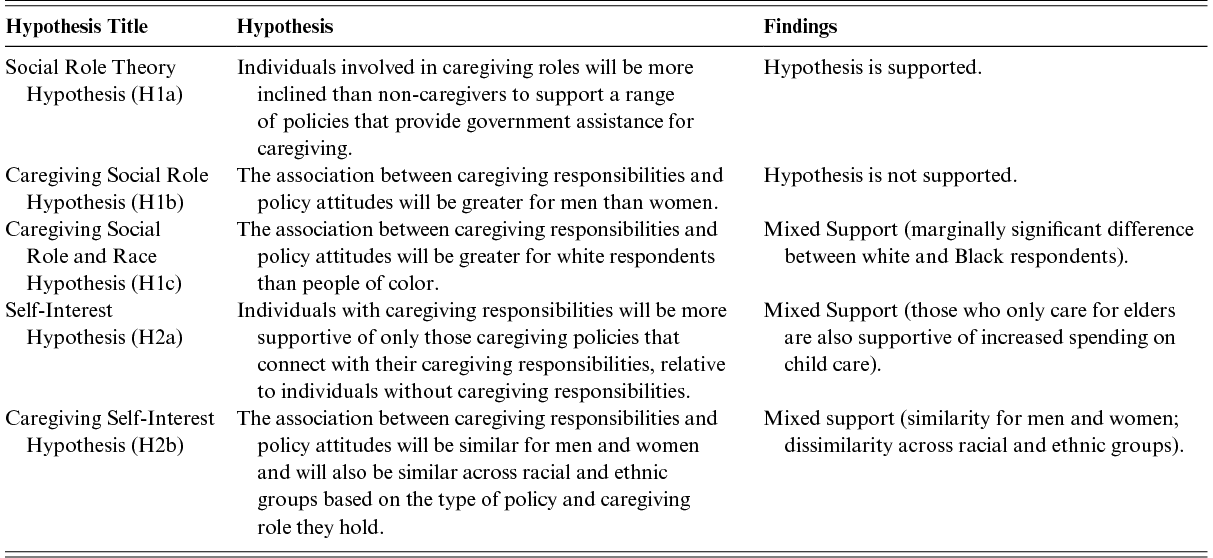
Lastly, we examine the influence of self-interest for people responsible for providing care and find in many instances there is a significant association, though other types of caregivers are also supportive of government support, which complicates a pure self-interest story. Moreover, as caregiving becomes a responsibility for more people in the U.S. our application of social roles theory and self–interest theory, as well as examining possible differences among white and nonwhite caregivers, allows us an opportunity to provide a better explanation behind how people think about social support policies intended to assist with care work.
Even now, several years post-2020, as most of life has gone back to what it was pre-pandemic, polls demonstrate that people continue to experience challenges with caretaking and are interested in government solutions (LeaMond, Reference LeaMond2023; Miller, et al., Reference Miller, Wolff and Shen2025). In Section 5, we will look at more recent data to examine how caregivers are thinking about related spending policies a few years out from the pandemic. While we recognize that there are many factors at play, the caregiving responsibility measures that we employ are plausibly exogenous to views about caregiving policies, and persist in controlling for party, ideology, and a range of demographic variables. These findings are important in that they show individuals can link their individual experience to public policy attitudes even in a context characterized by high partisan polarization. As LeaMond (Reference LeaMond2023) notes, voters are experiencing challenges with ensuring the care of their children and their adult loved ones, making caretaking an issue that is top of mind for them. The question is if candidates and politicians will pay attention to this reality.
4 Caregiving as a Link to the Political
Introduction
In 1991, two friends found themselves unexpectedly caring for family members with medical needs. Suzanne Mintz and Cindy Fowler each were taking care of an adult family member with a progressive illness and felt that there was no network of support or information to tap into. These friends found connection and support from one another. They also found political purpose. Two years later, Suzanne and Cindy founded the National Family Caregivers Association, which aimed to raise awareness about the needs of family caregivers and lobbied for policy changes to recognize and support these individuals (Carpenter, Reference Carpenter2024). While Suzanne and Cindy’s story is extraordinary, it taps into a dynamic that we seek to explore in this section. When does a caregiving role take on political meaning for individuals and how might that politicized role inform an individual’s policy stances? Similarly, when might a caregiver see that the skills they have developed in their caregiving role have practical application to the political world? How might those skills inform their policy stances?
In Section 3, we considered how attitudes toward caregiving policy varied across caregiving experience, gender, party and racial and ethnic identity. Here, we examine how caregivers differ from one another. In this section we develop two new concepts – politicized caregiving perspectives and caregiving skills – and explore whether and how they impact the policy stances of individuals who are engaged in caregiving.
Politicized Caregiving Perspectives
A great deal of scholarship in political science and psychology has established how politicized identities, or politicized collective identities, shape political views and political engagement (Dawson, Reference Dawson1995; Duncan and Stewart, Reference Duncan and Stewart2007). Individual social identities are drawn from seeing oneself as part of a category, group, or role (Deaux, Reference Deaux, Higgins and Kruglanski1996; Klandermans, Reference Klandermans2014). This identity can be politically meaningful, or politicized, if the individual perceives a connection between a social identity and political content (Klandermans, Reference Klandermans2014; Langner, Reference Langner2005). This connection can shape political attitudes; for example, a politicized gender identity can be an important determinant of partisan preferences and policy stances (Cook, Reference Cook1993; Gurin, Reference Gurin1985). While most scholarship has focused on a collective sense of identity that, when politicized, can be the basis for collective political action with and for members of that identity group (Simon and Klandermans, Reference Simon and Klandermans2001), we are interested in examining a politicized personal identity.
Building from scholarship on politicized identities and civic engagement, we develop a new concept that we term politicized caregiving perspectives. A politicized caregiving perspective is the degree to which a caregiver connects their caregiving role to their views of and engagement with the political sphere. We explore whether caregivers who draw political meaning from their caregiving role are more supportive of social support policies than caregivers who do not draw similar connections to their caregiving role. That is to say, we explore whether respondents see a role that they occupy, that of caregiver, as related to their political views, sense of political capabilities, and political behavior (Klanderman, Reference Klandermans2014). The link between a role or identity and political views has been documented in relation to a range of social categories, identities, and roles, including gender, race, and parenthood (Dawson, Reference Dawson1995; Duncan and Stewart, Reference Duncan and Stewart2007; Gurin, Reference Gurin1985; Junn and Masuoka, Reference Junn and Masuoka2008; Langner, et al., Reference Langner, Greenlee, Deason, Thomas and Bittner2017).
In addition to the significant body of scholarship on how politicized outlooks and identities shape political views, some scholars have explored how caregiving can be understood in a political context. While this work informs our analysis, we know of no other research that specifically measures the extent to which individuals have a politicized caregiving perspective and test if and how it impacts a range of policy perspectives and policy preferences. Herd and Harrington (Reference Herd and Harrington2002) argue that care work is a form of civic engagement, and Kershaw (Reference Kershaw2010) links caregiving to political citizenship, though these analyses do not focus on specific policy attitudes in the way that our project does. Levitsky (Reference Levitsky2014) examines the politicization of caregivers, describing this as the process by which caregivers identify their needs as worthy of a public response, identify potential solutions to those needs, and advocate for governmental action in line with those solutions. Building on the legal theory of naming, claiming, and blaming (Felstiner, et al., Reference 89Felstiner, Abel and Sarat1980), Levitsky’s conceptualization helps us understand caregiving as an identity that can lead to political awareness and mobilization.
Our concept, politicized caregiving perspectives, intersects with Levitsky’s; both consider how caregiving experiences shape political engagement and policy outlook. However, politicized caregiving perspectives is a distinct concept in that no recognition of a need for government response is required, just a perspective that caregiving work has political relevance. Similarly, for our concept, potential political engagement and policy responses do not have to be around ameliorating the demands of caregiving, though of course they could be (and the ones we test here are).
As we explain in previous sections of this Element, not every person who provides caregiving sees themselves as a “caregiver” nor do they necessarily view their responsibilities as matters for government intervention. Scholars of health, aging, and social work have identified a connection between embracing a caregiving identity and making use of family caregiving support programs such as adult day centers, support groups, meal assistance, and counseling (Eifert et al., Reference Eifert, Adams, Dudley and Perko2015). Those who adopt a caregiving identity are also more likely to view caregiving as a public responsibility deserving of policy response rather than just a private concern (Levitsky, Reference Levitsky2014). Applying this connection to specific policy attitudes, we theorize a parallel relationship such that those who imbue caregiving roles with political significance (related to but not synonymous with a caregiving identity) will be more likely to support caregiving policies.
Caregiving Skills
We develop a second and related concept we call caregiving skills. This concept examines whether caregivers who identify caregiving as equipping them with specific skills that are useful for politics (e.g., the ability to advocate for others, the ability to make decisions in a crisis, and expertise on the needs of children, the elderly, and/or persons with disabilities) are more supportive of caregiving policies than individuals who do not believe caregiving has equipped them with these skills. In other words, do caregivers who see their caregiving role as linked to potentially politically relevant skills view policies differently than those who do not?
There is limited research in political science to guide specific hypotheses here because caregiving experience has so rarely been studied in connection to political skills or attitudes. Existing scholarship does demonstrate, however, that political attitudes are shaped by political sophistication (Goren, Reference Goren2004; Lee and Chang, Reference Lee and Chang2009), information (Sides, Reference Sides2016), personal experience (Egan and Mullin, Reference Egan and Mullin2012), political expertise (Goren, Reference Goren1997), and political knowledge (Converse, Reference Converse and Apter1964; Delli Carpini and Keeter, Reference Delli Carpini and Keeter1991, Reference Delli Carpini and Keeter1996; Zaller, Reference Zaller1992). Indeed, some individuals self-report that being a caregiver has led to the acquisition of new skills (Farran, et al., Reference Farran, McCann, Fogg and Etkin2009; Gitlin et al., Reference Gitlin, Winter, Corcoran, Dennis, Schinfeld and Hauck2003). Furthermore, scholars have documented that caregiving aids individuals in priority setting and decision-making skills (Given et al., Reference Given, Sherwood and Given2008, 28).
Therefore, we anticipate that caregivers who acknowledge their own enhanced skill set and who are more likely to view caregiving as a highly skilled endeavor will be more likely to support caregiving social support policies than those who do not. The logic here is that those individuals who believe that caregiving equips individuals with skills see caregiving as both valuable (it provides tangible benefits that expand beyond the immediate care provided) and linked to expertise (thought about in a way that is comparable to how we think about paid professions, despite the unpaid nature of the work). Given this, individuals who view caregiving as skilled work should be more likely to support programs aimed at assisting caregivers and those needing care.
Shaping Policy Stances
Here we investigate how our two new concepts, politicized caregiving perspectives (the extent to which individuals report that their caregiving role shapes their perception of and engagement with politics) and caregiving skills (the extent to which individuals believe that their caregiving role has equipped them with skills that are particularly well suited for engaging in politics), contribute to levels of support for public policies that offer social supports. We argue that despite the obstacles that caregiving responsibilities may place in front of individuals, those who hold a sense of politicized caregiving perspectives and identify that they have caregiving skills will have higher levels of support for these policies. Our formal hypotheses are as follows:
Politicized Caregiving Perspectives Hypothesis (H1): Caregivers who attach greater levels of political meaning to their caregiver role will be more supportive of caregiving policies than caregivers who attach little political meaning to their caregiver role.
Caregiving Skills Hypothesis (H2): Caregivers who connect their caregiving role to politically relevant skills are more likely to support caregiving policies than caregivers who do not connect their caregiving role to these skills.
Data and Methods
To measure politicized caregiving perspectives, respondents were asked to indicate their level of agreement or disagreement with a set of questions: my role as a caregiver shapes my political or policy views; my role as a caregiver gives me expertise relevant to politics; and, my caregiving responsibilities make me more motivated to get involved in politics and community affairs. Each question ranges from zero to four and we add these measures together to form a scale (Cronbach’s alpha = 0.88) and then rescale the measure to run from 0 to 1, with higher values indicating a stronger perception of caregiving as politicized.Footnote 21 Figure 16 shows the distribution of politicized caregiver perception scores; mean agreement is .45 on the additive scale. Interestingly, there is no real difference between the mean politicized caregiver perception score for women (.48) and men (.47). We also see little variation between men and women across racial and ethnic groups.
Distribution of Scores on Politicized Caregiving Perspectives, All Caregivers.
Note: The figure shows the distribution of politicized caregiving perspectives. The percentage of people who fall into each value on the scale are depicted in the figure.
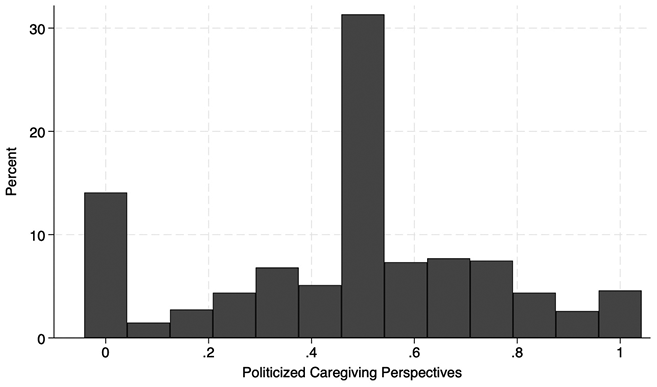
To measure perceptions of caregiving skills, we asked respondents to select all of “the skills that you believe your caregiving experience provides you with,” and provided a wide range of response options as well as an “other” category. These skills include: expertise on the needs of children, the elderly, and/or persons with disabilities; managing complex schedules; ability to empathize with others; patience; ability to advocate for others; ability to make decisions in a crisis; and creative problem solving. Each skill selected was given a value of one. We then added all the items selected and rescaled the measure to run from 0 to 1 (Cronbach’s alpha = 0.81). Higher values on the measure reflect that the respondent perceives that their caregiving experiences provide them with a greater number of skills. Figure 17 shows the distribution of scores. The mean on the caregiving skills item is .40; among women the mean is 0.42 and among men it is 0.35.
Distribution of Scores on Caregiving Skills, All Caregivers.
Note: The figure shows average values of perceptions of caregiving skills. The percentage of people who fall into each value on the scale are depicted in the figure.
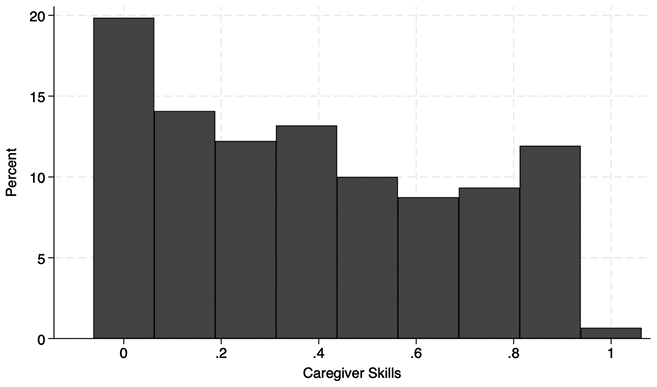
There is meaningful variation in the mean scores of caregiving skills across race/ethnicity and gender groups. Figure 18 shows that women in each racial group have higher mean scores for caregiving skills with white women reporting the highest levels. Among men, Black men report the lowest levels of caregiving skills.
Distribution of Scores on Caregiving Skills by Race/Ethnicity-Gender Group, All Caregivers.
Note: The figure shows average values of perceptions of caregiving skills broken down by gender and racial group. Survey weights are used.
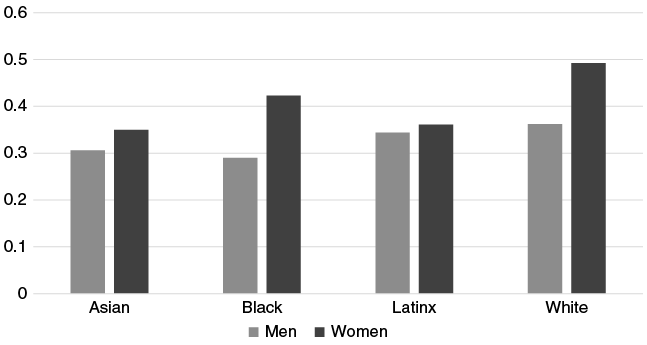
Who Has Politicized Caregiving Perspectives and Caregiving Skills?
Having looked at the distribution of these two attitudes, we now explore what factors are associated with politicized caregiving perspectives and caregiving skills. We regress each measure on a set of demographic and attitudinal measures.Footnote 22 As shown in Figure 19, being younger, less educated, liberal, and holding liberal views of gender roles are associated with higher levels of politicized caregiving perspectives. In addition, having higher levels of interest, efficacy, and trust in the federal government is also positively associated with higher levels of politicized caregiving perspectives. Finally, the more individuals for whom someone cares for are also associated with higher levels of politicized caregiving perspectives.
OLS Regression, Predictors of Politicized Caregiving Perspectives, All Caregivers.
Note: The figure plots beta coefficients from the OLS model. 90% confidence intervals depicted. Survey weights are used in the analysis.
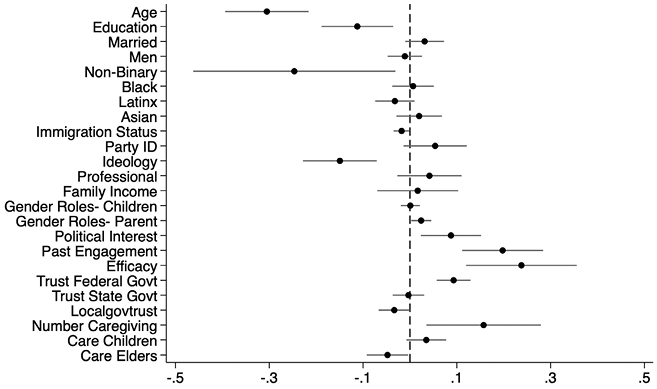
Figure 20 shows the results of a similar analysis for caregiving skills. Our regression results show that being a woman, having a lower income and higher education, holding more liberal views of gender roles, and higher levels of past engagement all correlate with higher levels of caregiving skills. In addition, the number of individuals for whom a person gives care is positively associated with higher reported levels of caregiving skills, as is caring for children and elders.
OLS Regression, Predictors of Caregiving Skills, All Caregivers.
Note: The figure plots beta coefficients from the OLS model. 90% confidence intervals depicted. Survey weights are used in the analysis.
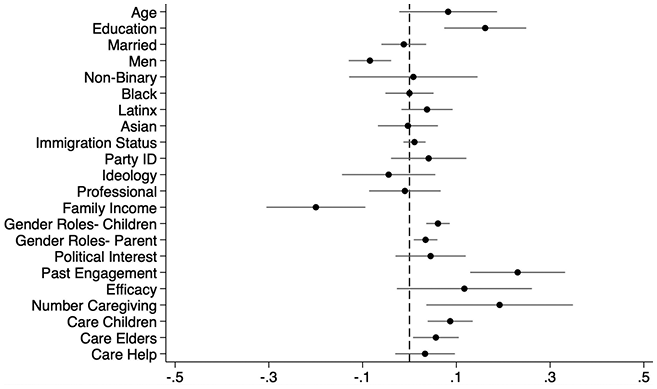
This exploration of the predictors of politicized caregiving perspectives and caregiving skills suggests that these variables are shaped by different factors, but notably, are not driven by partisan identification. Indeed, when we look at whether partisan identification is correlated with either variable, we find it is not. Thus, we feel confident that politicized caregiving perspectives and caregiving skills are distinct from partisanship.Footnote 23
Linkages between Caregiving Perspectives, Caregiving Skills, and Policy Attitudes
Are caregivers’ perceptions of their caregiving role and skill set related to their stances on policies that offer support to family caregivers? Here we investigate that question, taking three analytical approaches to do so. First, we examine all caregivers together in a model that accounts for whether caregivers experienced an increase or decrease in caregiving time during the COVID-19 pandemic (caregivers who report that their caregiving time stayed the same serve as the baseline category). Second, we look at men and women separately to better understand if politicized caregiving perspectives work differently for each group. Finally, we look at racial groups separately. For each approach, our dependent variable captures levels of support for the Caregiving Policy Index (CPI), which we explored in the third section of this Element. As a reminder, the CPI is an additive scale of levels of support for policies that provide aid to low-income and middle-class families to help pay for child care, increased wages for early child care providers, funding for summer meals and expanded school lunch programs, upgraded and expanded child care facilities, increased wages for homecare workers, and pre-K and universal child care programs. Respondents indicated their level of support for each policy on a five-point scale with higher values indicating greater support.
For our first analysis, we examine all caregivers together and regress the CPI on a set of controls similar to the prior analysis,Footnote 24 caregiving time during the pandemic (though now the “same time” category serves as the baseline since we removed non-caregivers), and our measure of politicized caregiving perspectives and caregiving skills. Our results are shown in Figure 21.Footnote 25 In support of H1, we see that higher politicized caregiving perspective scores are positively correlated with greater support for the CPI (b = 0.12; p < 0.01). However, we find that caregiving skills has no impact on these policy attitudes. Though the coefficient on the caregiving skills index is positive, it is not statistically significant, so we do not find support for H2. Among caregivers, there is also no meaningful association for time spent on caregiving and the CPI. As with the analysis in the full sample, we find that conservatives, men and individuals with higher levels of income are less supportive of caregiving policies, while people of color, those who are married, and those with more progressive gender role attitudes are more supportive.
OLS Regression, Impact of Caregiving Perspectives and Caregiving Skills on Policy Attitudes, All Caregivers.
Note: The figure plots beta coefficients from the OLS model. 90% confidence intervals depicted. Survey weights are used in the analysis.
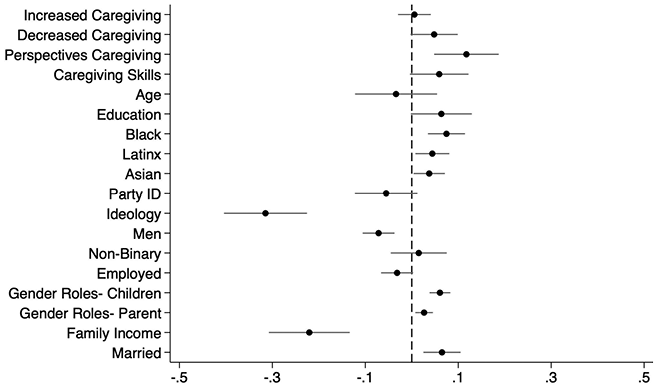
Though we did not develop hypotheses based on gender, we nonetheless explore these relations among women and men separately. In Figure 22, we see that politicized caregiving perspectives and caregiving skills are positive and significant predictors of support for caregiving policies among women (b = 0.09 and p < 0.05 in both cases). Among men who are caregivers, those who connect caregiving to politics are marginally more supportive of progressive caregiving policies (b = 0.12; p = 0.07), while the caregiving skills item is not statistically meaningful. We test whether the coefficient on these measures is different between men and women and do not observe any significant differences. Thus, we cannot conclusively say that the impact of politicized caregiving perspectives and caregiving skills are different for men and women. But the fact that differences emerge when the groups are treated separately suggests that this may be an area worthy of future research.
OLS Regression, Impact of Caregiving Perspectives and Caregiving Skills on Policy Attitudes, by Gender.
Note: The figure plots beta coefficients from the OLS models, one run on a subset of women who have caregiving responsibilities, and the other on a subset of men who have caregiving responsibilities. 90% confidence intervals depicted. The models also control for age, education, party identification, ideology, employment status, racial group, marital status, views on gender roles, and family income. Survey weights are used in the analysis.
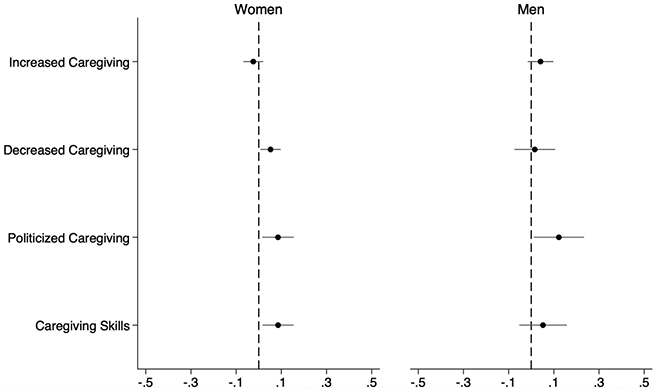
Finally, we examine these relationships separately by race/ethnicity among caregivers and illustrate the findings in Figure 23. The sample size gets much smaller given that this is just among caregivers, and politicized caregiving perspectives are only significant among Asians, and just outside of significance for whites and Blacks. If we test the coefficient across models, there are no meaningful differences. Thus, it seems the impact of politicized caregiving perspectives is similar across groups. In addition, caregiving skills is not significant for any of the groups.
OLS Regression, Impact of Caregiving Perspectives and Caregiving Skills on Policy Attitudes, by Race.
Note: The figure plots beta coefficients from four OLS models, one for each racial group who have caregiving responsibilities. 90% confidence intervals depicted. The models also control for age, education, gender, party identification, ideology, employment status, immigration status, marital status, views on gender roles, and family income. Survey weights are used in the analysis.
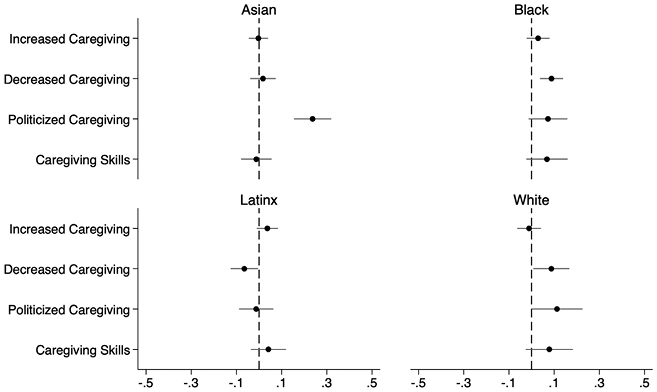
What about Partisanship?
Finally, we consider the role of partisan identification in our investigation. Do politicized caregiving perspectives or caregiving skills work differently by party? We run the model with Republicans, Democrats, and Independents separately and find that politicized caregiving perspectives are positively associated with support for caregiving policies among Democrats and Independents, but not Republicans (see Figure 24). If we test whether the association between politicized caregiving perspectives and the CPI is statistically different across these models, we find that the coefficients are different only between Independents and Republicans (p = 0.04). The null results among Republicans could therefore be due to the smaller sample size when we split the sample. To test this intuition, we used an alternative strategy of running the model on the full sample with interaction terms between caregiving perspectives and each partisan group and the interaction terms are not significant, which suggests more partisan similarity than difference in the association between caregiving perspectives and the CPI.
Turning back to Figure 24, caregiving skills have a significant and positive impact on policy support only among Democrats. However, if we test whether the coefficient on caregiving skills is significantly different across equations, we do not find any meaningful differences across partisan groups. These latter findings again suggest more partisan similarity than difference in the association between caregiving skills and the CPI, an intuition that is also supported if we run a model on the full sample with an interaction between each partisan group and caregiving skills.
What should we make of these results? We think the balance of evidence suggests a story more of similarity than of difference in how views of caregiving identity and perceptions of caregiving skills translate to policy preferences.Footnote 26 These findings of minimal partisan differences echo the findings from Section 3 on caregiving responsibilities.
OLS Regression, Impact of Caregiving Perspectives and Caregiving Skills on Policy Attitudes, by Partisan Identification.
Note: The figure plots beta coefficients for Caregiving Perspectives and Caregiving Skills from three OLS models, each run on a different partisan group who has caregiving responsibilities. 90% confidence intervals depicted. The models also control for caregiving time, age, education, gender, ideology, employment status, racial group, marital status, views on gender roles, and family income. Survey weights are used in the analysis.
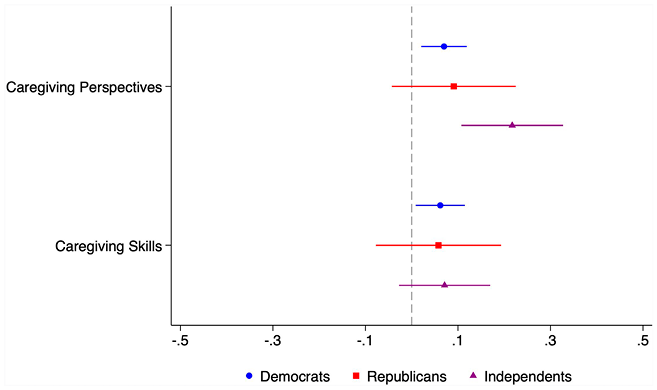
Linkages between Politicized Caregiving Perspectives, Caregiving Skills, and Spending Preferences
In Section 3, we looked at the relationship between types of caregiving and support for government assistance for child care and elder care separately. When we look only at caregivers, do we observe similar relationships? Here we explore how attitudinal variation among caregivers, via politicized caregiving perspectives and caregiving skills, might shape support for government policies that could relieve the burden of caregivers.
To do this, we look the impact of both politicized caregiving perspectives and caregiving skills on respondents’ willingness to support government assistance for children, as well as the elderly.Footnote 27 To refresh, the measures we use capture whether respondents are more likely to agree that public policies should be designed to help families afford the costs of child care and elder care, respectively. We control for the same set of variables as in our prior analysis.Footnote 28 We find no significant relationships between politicized caregiving perspectives or caregiving skills and child-related support policies or elder-related support policies. Instead, support for these policies is driven by variables such as being a Democrat, liberal, and supporting egalitarian gender roles. These null results for politicized caregiving perspectives and caregiving skills suggest that perhaps support for these government policies is high across all caregivers, rendering the distinction of having a politicized caregiving perspective less of a meaningful distinction on these attitudes. Caregivers who draw political meaning from their caregiving role may be more likely to support caregiving policies in principle but are not more likely to support government assistance on specific policies, compared to caregivers who do not have politicized caregiving perspectives. Perhaps all caregivers share similar stances when it comes to government assistance on these policies.
Conclusion
In this section, we define and develop two new concepts that capture how caregivers think differently about their caregiving role: politicized caregiving perspectives and caregiving skills. In Table 3, we summarize our findings regarding how politicized caregiving perspectives and caregiving skills influence policy attitudes. Caregivers who have higher scores on politicized caregiving perspectives draw political meaning from their caregiving role or understand that their caregiving role has important political implications. We articulate politicized caregiving perspectives as the connection that individuals make between the caregiving responsibilities that they have in their personal lives and their political views, their sense of politically relevant expertise, and their motivation to engage in political and civic life. Individuals who score high on the politicized caregiving scale are more supportive of caregiving policies. We find this is the case for both women and men and across racial and ethnic groups. We also find this for Democrats and Republicans. While evidence that politicized caregiving perspectives contribute to more support for caregiving-linked policies among caregivers is robust, we find less support for a relationship between caregiving skills and support for caregiving policies. Though many caregivers in our sample identify that they have gained politically relevant skills from their caregiving role, this self-assessment has a less consistent impact on their support for public policies. Democrats are the one group among whom we find caregiving skills has a positive impact on their support for social safety net programs.
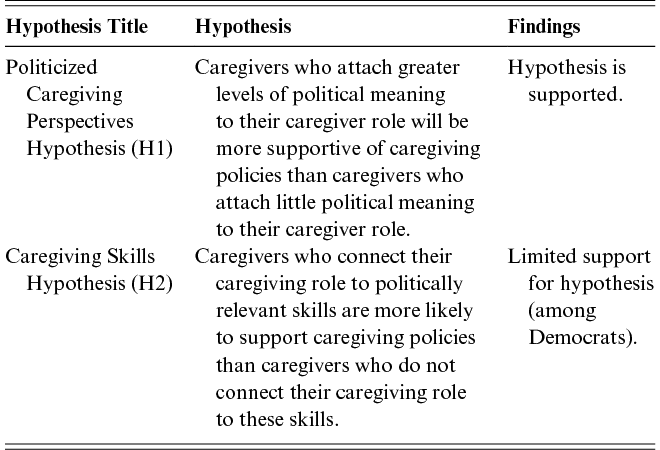
All told, our findings in this section provide important evidence that the internal experience of caregiving is consequential for policy attitudes and potentially for other forms of political engagement as well. In other words, our findings illustrate that the personal is indeed the political. The impact of caregiving on policy preferences is not merely a function of whether one experiences caregiving but also how they experience caregiving, and how they understand their role and responsibilities in a broader political context.
5 Caregiving in a Post-Covid Context
Our findings in this Element show a relationship between caregiving experiences and policy attitudes in the context of the COVID-19 pandemic. But what happened when the pandemic ended, the most acute pressures of that time period faded, and public attention moved away from caregiving?
Years after the start of the global pandemic, life has returned to “normal” for many caregivers. Schools and daycare centers have long reopened, and families can once again call on their social networks for support. There have even been signs of progress in terms of gender equity in caregiving since the pandemic (Hegewisch and Ahmed, Reference 91Hegewisch and Ahmed2025). During this time, public attention to caregiving also waned. As a piece of anecdotal evidence, we searched for the number of New York Times articles that referenced caregiving beginning on April 1, 2020 (by which point most U.S. states had issued stay at home orders) to April 1, 2025.Footnote 29 Coverage peaked at around 250 articles in 2021 and dropped below 150 in 2022. By 2025, fewer than 50 articles in the New York Times referenced caregiving. Thus, even just five years out from the pandemic, caregiving had largely dropped out of the public conversation.
Despite this, caregivers continue to face challenges, and those difficulties are felt unevenly across the population. Women, especially women of color, continue to shoulder more of the caregiving burden (Hegewisch and Ahmed, Reference 91Hegewisch and Ahmed2025). Some new pressure points have also emerged after the pandemic, particularly around child care.Footnote 30 Thus, the decline in media coverage of caregiving masks the reality that caregiving continues to dominate many Americans day to day lives, even though it is not currently dominating the headlines. In this section, we explore the relationship between caregiving responsibilities and policy attitudes after the pandemic ended.
Do Pandemic Era Findings Persist and Extend to Adjacent Policies?
How should we think about our pandemic era findings in a post-pandemic world? One question that naturally arises is whether the associations between caregiving responsibilities and support for government policies that address caregiving persist after the pandemic. The challenges of caregiving may have become less intense (and certainly less well documented), but does this mean that caregiving no longer impacts policy views? Here we attempt to answer these questions for both caregiving experiences and politicized caregiving perspectives. We first use data from the 2022 Cooperative Election Survey (CES) to look at linkages between caregiving responsibilities and attitudes related specifically to care related policies. We then use data from a module with 1,000 respondents on the 2024 CES to look at linkages between caregiving responsibilities and attitudes and support for spending on policies adjacent to caregiving and compare those results to our 2021 NCCS survey to assess whether our pandemic era findings persist.
Caregiving Experiences and Care-Related Policy Attitudes
The 2022 CES (using the common content, N = 59,926) does not have our robust measures of caregiving responsibilities and attitudes, but there are some rough proxies that capture whether the respondent cares for children. More specifically, the survey has measures for whether the respondent has children under eighteen, the number of children under eighteen, and whether they had a new child in the last year. We use these indicators (each in a separate model), along with the same set of control variables that we use in earlier sections,Footnote 31 to explore how they relate to attitudes on a policy item included on the survey that contains a number of care related items. More specifically, respondents were asked if they favor or oppose the following: “Spend $2.2 trillion over the next decade to provide universal prekindergarten, subsidies for child care, expanded financial aid for college, housing support, home and community care for older Americans, and to shift the U.S. economy away from fossil fuels to renewable energy and electric cars.” Among the U.S. public, 62.3% favors the policy. This item is not ideal since it lumps together child and elder care policies with others such as the environment, but it was the only one available on the CES somewhat related to the Caregiving Policy Index (CPI) that we used in prior sections.
In Figure 25, we show the association between each child responsibility indicator and this care policy item. No matter which item we use to capture child care responsibilities, we find a positive and significant association with policies related to enhanced support for child and elder care. For the most part, these associations are similar for men and women, with the exception of the number of children, which only seems to matter for women. We also looked at variation by partisanship and did not find consistent patterns across the three indicators of child care responsibilities, similar to what we found in Section 3. Thus, we continue to find strong relationships between care responsibilities and support for care policies at a time when the intense pressures of the pandemic had abated.
Probit on Care Policy Support by Child Care Responsibilities, CES 2022.
Note: Beta coefficients from the probit model are displayed. 90% confidence intervals depicted. The models also control for age, education, partisanship, ideology, racial group, gender, family income, employment status, marital status, and sexism. Survey weights are used in the analysis.
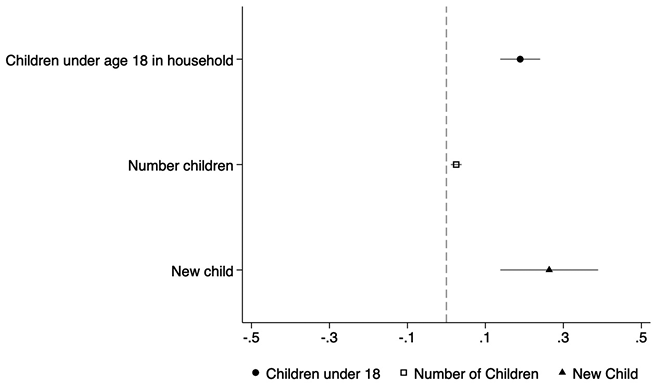
Caregiving Experience and Care-Adjacent Policy Attitudes
Next, we turn to a comparison of the 2024 CES and the 2021 NSCC data. In the 2024 CES, we asked 1,000 respondents to indicate for whom they provided care during the pandemic, providing us with an identical measure to our 2021 NCCS survey.Footnote 32 Unfortunately, the battery of questions that make up the Caregiving Policy Index (CPI) is not available for the 2024 CES. Therefore, we examine broader questions about policy issues that are closely related to caregiving such as spending on welfare, health care, and education, which both surveys contained. Respondents were asked to indicate if they were in favor of increasing spending, decreasing spending, or keeping spending the same for each policy. We recoded these such that higher values reflect support for more spending. The 2024 CES also included questions on the importance people attach to health care and education policy on a four-point scale, with higher values reflecting greater importance.
In Figure 26, we present the results for the spending measures for our 2021 NSCC data for the full sample and broken down by gender. Turning first to the full sample (see the lines with the circle in the figures), we find meaningful and positive associations between caregiving responsibilities and support for spending on welfare and health care but not spending on education.Footnote 33 It is possible that respondents’ experiences with caregiving during the pandemic are top of mind, and thus their answers reflect a feeling that more resources should be invested in welfare and health care, which were vital for a time of great job loss and acute illness. Yet, for many parents, home schooling during the height of the pandemic was a challenge – thus, it is a surprise that we do not see a significant correlation for education spending.
OLS on Support for Spending by Caregiving Responsibilities, 2021 (NSCC Survey), Full Sample and Broken down for Men and Women.
Note: Beta coefficients for the caregiving responsibilities item are displayed from three OLS models: welfare spending, health spending and education spending. The models using the full sample include controls for age, education, racial group, gender, marital status, employment status, family income, party, ideology, and views of gender roles. The models for men and women include these same controls, except gender since we use the gender variable to split the sample. 90% confidence intervals depicted. Survey weights are used in the analysis.
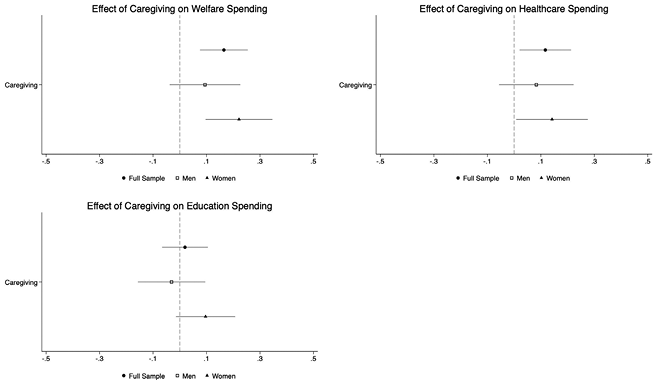
In the figure, we also disaggregated the analyses by gender to see if the association between caregiving and spending preferences varies for men and women. Starting with men (see the lines with a square in the center), providing care does not appear to have a significant influence on their opinions on these three spending policies. Among women (see the lines with a triangle in the center), caregiving is significantly associated with support for increased spending for welfare and health spending, similar to the results in the full sample.
Next, we turn to Figure 27, which shows our analyses using the 2024 CES data. In the full sample, we only observe a significant correlation between caregiving responsibilities and welfare spending. Thus, there is some evidence that the association between caregiving responsibilities and support for care-adjacent policies are weakened outside of the pandemic context. We also do not observe any statistically meaningful effects if we look at the importance people attached to education and health care policy in 2024. These results tell us that as caregivers are no longer in a collective crisis situation like the one caused by the pandemic, perceptions of caregiving as a personal and private responsibility could be outweighing support for broader government policies, which are viewed as public.
OLS on Support for Spending by Caregiving Responsibilities, 2024 (CES), Full Sample and Broken down for Men and Women.
Note: Beta coefficients for the caregiving responsibilities item are displayed from three OLS models: welfare spending, health spending and education spending. The models using the full sample include controls for age, education, racial group, gender, marital status, employment status, family income, party, ideology, and sexism. The models for men and women include these same controls, except gender since we use the gender variable to split the sample. 90% confidence intervals depicted. Survey weights are used in the analysis.
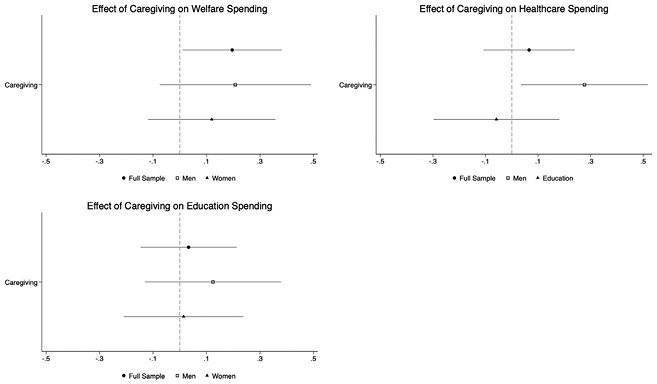
Are there any differences if we break down the analysis by gender? In 2024, there is a significant association between being a male caregiver and spending on health policies; but there is no significant effect for the other two spending measures or two importance measures. By the time we get to 2024, there is no connection between caregiving and women’s spending preferences in these areas or in the importance they attach to education and health care policy. These findings suggest that being in a crisis situation motivates women to offer broader support for strengthening the social safety net. While the pandemic made caregiving more salient for both men and women, our results show that women caregivers were somewhat more likely in that crisis context to connect caregiving to broader social policy attitudes.
Politicized Caregiving
In Section 4, we examined the impact of politicized caregiving perspectives and caregiving skills on policy attitudes among caregivers. Here again we use the 2024 Cooperative Election Study (CES) as a comparison point. Using the same measures from the NCCS, we find a mean score of .5 for politicized caregiving perspectives (compared to a mean of .45 in the NCCS). Interestingly, this suggests a higher level of politicized caregiving perspectives, on average, among the 2024 sample, as compared to the 2021 sample. We use the same outcome measures that we used in the last set of analyses, the three spending measures for both surveys and the two measures of issue importance for the 2024 CES, and regress these on politicized caregiving perspectives along with the set of controls we used in the prior analyses.
In our 2021 NCCS, we find that politicized caregiving perspectives has a positive and significant association with support for spending on welfare, but no impact on education or health spending. In 2024, there is no significant association between politicized caregiving perspectives and any of the spending items. We only find that politicized caregiving perspectives has a positive impact on the importance of education policy for the 2024 CES respondents. These largely null results also hold when we break down the analysis by gender.
However, if we break down the analysis by partisanship, we observe some interesting differences. Looking at Democrats and Republicans separately, we find that politicized caregiving perspectives has a positive impact on welfare spending among Democrats in both surveys, and on the importance of education policy in 2024. Spending on health nearly reaches standard levels of significance among Democrats and is also in the expected direction in both surveys. For Republicans, politicized caregiving perspectives is a significant and positive predictor of the perceived importance of education in 2024, but nothing else. While these results are suggestive of some differences by partisanship, we do not find significant effects for most of our outcome measures.
Do our findings persist outside the COVID context? Based on our evaluation of the evidence, we believe that they do, but in nuanced and limited ways. Specifically, we find that even after COVID-19 faded into the background, caregiving responsibilities continued to be linked to one out of three measures related to caregiving policy – attitudes on welfare spending. We further find that politicized caregiving perspectives has a strong, positive impact on the perceived importance of education and on welfare spending among Democrats and on the perceived importance of education for Republicans. While these results point toward the ongoing relevance of politicized caregiving perspectives on policy attitudes, it is clear that the influence of caregiving experience and politicized perspectives is more limited for care-adjacent policies and stronger during a crisis context. Put another way, dramatic events such as the COVID-19 pandemic may encourage individuals to draw sharper connections between their experiences and policy outlook than they otherwise would.
Indeed, we anticipate that events in the future that plunge all or some groups of caregivers into new, stressful, and widely experienced contexts will illicit similar reactions from caregivers. What might these widely experienced contexts look like? We see two elements that are critical to creating such scenarios. The first is a public policy failure. This could look like cuts to programs that support families or individuals in need of care, an insufficient policy response to public health emergencies that affect children or other dependent groups, or renewed school closures that once again put pressure on parents and guardians of school aged children without adequate support. The second element needed to create this context is for the connection between policy and caregiving to be made clear and communicated widely. Particularly because informal caregiving takes place in the home and in the contexts of personal lives, it is seldom seen as a collective struggle in need of a public policy response. When political advocates, elected officials, activists, and community organizations draw public attention to private, yet ubiquitous, struggles, the context is ripe for caregivers – particularly those whose caregiving role is politicized – to lean toward supporting public policy solutions that support those who give and receive care.
6 Caring about Care
“I didn’t ever even realize I was one.” Actor Bradley Cooper, on being a caregiver for his father (Mitchell, June 13, Reference Mitchell2025).
Caregiving, a 2025 PBS documentary, demonstrates the ubiquity of caregiving, highlights the need for policy reform, and calls for increased support for caregivers (Caregiving, 2025). The film was narrated by actress Uzo Aduba, whose experience caring for her own terminally ill mother while raising her young child informed her participation in the project (Wynn, Reference Wynn2025). The documentary was produced by Bradley Cooper, whose quote about his own caregiving experience opens this section. Through powerful personal stories, the documentary illustrates the vital role of government-funded programs in assisting families with their daily caregiving responsibilities. Advocates featured in the documentary draw a clear connection between individual caregiving experiences and the broader need for publicly supported solutions.
The COVID-19 pandemic shed renewed light on longstanding weaknesses in the care infrastructure. In this Element, we sought to investigate if and how caregiving experiences during the pandemic influenced attitudes regarding policies designed to address challenges of providing care. We recognize that there are two types of caregiving: formal and/or paid care that professional care workers or institutions provide and informal and/or unpaid care that is undertaken by family or community members. Our analysis centers on informal, unpaid caregiving because it is the core of long-term care in the U.S, and because it helps us understand linkages between personal and political identities beyond professional roles. Using a representative sample of respondents, we first examined associations between experiences and policy opinions for both men and women, as well as among different racial and ethnic groups. Secondly, we developed two new concepts – politicized caregiving perspectives and caregiving skills – to explore how variation in how caregivers see themselves and their caregiving role might also influence their positions on policy issues.
We first asked: how does being a caregiver shape attitudes on care-linked public policies? We found strong associations between being a caregiver during the pandemic and support for a broad set of care-linked public policies, supportive of what we would expect given a social role theory perspective. While nuanced differences do emerge in different populations, in general we see a clear relationship between serving in a caregiving role and perceptions of caregiving policies across all racial, ethnic and gender groups, and controlling for a wide range of other relevant factors. We argue that this seemingly straightforward connection is noteworthy given the range of different caregiving experiences, and the known challenges of translating individual experiences into policy attitudes.
We also explored whether there were any meaningful differences in the effects of being a caregiver between gender and racial/ethnic groups. Given that women are often socialized to be the nurturers and caregivers, we expected that, in comparison, men’s policy attitudes would reflect a more pronounced response to their pandemic caregiving role. We did not find this. In fact, the association between policy attitudes and caregiving experiences was generally similar between men and women, though one interesting difference was that women caregivers were supportive of such policies regardless of whether their time spent providing care increased, decreased or stayed the same during the pandemic, while men became more supportive when their time spent caregiving increased only. Across racial and ethnic groups, the findings also reflected a generally similar response, though the link between personal experience and policy attitudes was stronger among white caregivers than Black caregivers.
We also assessed whether the types of policies that an individual supports are linked only to the type of care that they provide (e.g., child care or elder care), to assess whether the impacts are in part driven by self-interest. Here, the results were more mixed. Caregivers of children under eighteen and those who care for children and the elderly were supportive of government assistance with child care costs, but so too were those who only care for the elderly. However, for government assistance with elder care costs, only those who provide elder care were supportive. We did not find many meaningful differences in the impact of caregiving roles between men and women for either policy area. However, we found stronger associations between type of caregiving role and policies associated with that role among whites for child care and among Asians for elder care.
In our second set of analyses, we asked: Do some caregivers see their caregiving role as relevant to politics? Specifically, we defined and then examined politicized caregiving perspectives and caregiving skills and analyzed how they shape policy views among caregivers. We found that those with higher politicized caregiving perspective scores were more supportive of caregiving policies, and there were no consistent differences between men and women or across racial and ethnic groups. In contrast, caregiving skills appeared to have no impact on policy opinions overall. However, when we broke down the analysis by gender, we found that women connect their caregiving skills to greater support for care-related policies.
Overall, for those who provided care during a challenging time such as a global pandemic, we found that caregiving roles and politicized caregiving perspectives (among caregivers) positively shaped care-related support policies, and these impacts were fairly similar across race and gendered groups, as well as partisan groups. While we observed some interesting nuances by gender, race, and partisanship, the pattern of findings show more similarity than difference in how people connected their caregiving experiences to policy attitudes during this crisis context. We also find that some of these relationships between caregiving and support for care-focused policies linger past the pandemic, but some do not. Thus, the acute context of the pandemic may have tightened the connection between caregiving and public policy for individuals; a connection that may be looser during “normal times.”
Implications and Suggestions for Future Work
So where do we go from here? Perhaps the most obvious extension of our work is further theoretical exploration of the definition and implications of what constitutes care policy. While we aimed to cast a wide net in our discussion of who provides care and what that care looks like, we recognize the utility of deepening and differentiating that analysis further still. Reflecting on Fisher and Tronto’s expansive definition of caregiving that we highlighted in our introduction as “everything that we do to maintain, continue, and repair our ‘world,’” it would be beneficial to develop more nuanced understanding of how the politics of caregiving intersects with and informs the politics of health care, Social Security, Medicare, disability rights and environmental policy. Emphasizing the caregiving elements of policies not traditionally viewed through that lens helps make what Suzanne Mettler calls “submerged policies” (Mettler, Reference Mettler2011) more visible to those who benefit from them. It may even help us build the more “caring democracy” that Tronto envisions.
In a related vein, our findings offer an invitation to think more broadly about how salience and crisis conditions amplify the relationship between the personal and the political. Along these lines, we see several generative paths to pursue. The first pathway is to think about ways to measure the impact of salience more directly. We have argued that the association between experience and attitudes was strong during the COVID-19 pandemic and anticipate it would be as well in other moments of widespread, acute pressure on caregivers. One reason for this is because in those contexts, caregiving is “top of mind” for caregivers. This is a logical explanation, but not one we test directly in this study. However, in future iterations of our larger project, we will draw on an embedded survey experiment to consider whether priming caregiving affects policy attitudes.
A second pathway involves the study of “issue salience” in the media through an analysis of press coverage. In Section 5, we noted that media attention to caregiving has waned. Drawing on an extensive literature on the role of salience as captured by press coverage (see for example Epstein and Segal, Reference Epstein and Segal2000; Iyengar, et al., Reference Iyengar, Peters and Kinder1982; Kinney, Reference Kinney2005; VanSickle-Ward, Reference VanSickle-Ward2014), an analysis of whether and how policy attitudes on caregiving are informed by the media environment and individual media consumption would be fruitful. Such an investigation could help scholars better understand the conditions under which a widespread event reaches the level of salience needed to activate the relationships that we see between being a caregiver and policy stances. It would also be instructive to policy advocates who seek to create a political context in which caregivers can be activated – through voting or simply through communicating their support for public policies.
A policy feedback approach to assessing caregiving policy attitudes would be fruitful as well. We know from extensive literature that policy attitudes are in part a function of the policy conditions experienced by survey respondents (Do Béland et al, Reference Do Béland, Campbell and Weaver2022). In other words, policy is the cause as well as the effect (Pierson Reference Pierson1993). Applying this logic to caregiving policy prompts us to ask – do respondents in different caregiving policy environments view caregiving policy differently? For example, do those living in states with more generous programs for caregivers have a distinctive perspective from their counterparts in states with more meager support? Do these attitudes change as policies change? An investigation into the salience of caregiving and policy feedback dynamics would help us untangle caregivers’ direct experiences from the broader context. In other words, how much of the increased ability to make the personal public connection during COVID-19 was a function of the actual conditions of caregiving changing, and how much was a function of the increased attention to caregiving? This analysis, in combination with our findings on politicized caregiving, may also help facilitate the development of a “pocket book” (individual status) versus “sociotropic” (evaluation of broader environment) model for attitudes in the caregiving context.
The COVID-19 pandemic will not be the last time that caregiving receives widespread attention or that caregiving undergoes a dramatic shift. Declining birthrates and delayed child bearing, often motivated by concerns about child care, continue to put pressure on caregivers for older generations (Tavernise and Adelson, Reference Tavernise and Adelson2026). While we cannot predict the next “caregiving crisis,” a likely contender is the implementation of the “Big Beautiful Bill,” passed by Congress and signed by President Trump in the summer of 2025. As we note in the second section of this Element, the Medicaid cuts and work requirements in this law will have significant negative consequences for caregivers and those they care for (Yang, Zahn and Sunkara Reference Yang, Zahn and Sunkara2025). The added strain of immigration crackdowns and cuts to administrative support for caregiving programs could make caregiving once again highly salient, as the elder care workforce is diminished by anxiety among immigrant workers and bureaucratic supports of programs are reduced.
The gendered dimensions of caregiving, and the tension between private and public caregiving responsibilities, have been high-profile considerations in recent years. So called “trad wife” content – influencers espousing the joys and comfort of women’s commitment to domesticity – has flourished on social media, reviving and reinforcing traditional, some might say antiquated, gender roles through new mediums (Beatty, Reference Beatty2024). The reelection of Donald Trump, and his appointment of Robert F. Kennedy as Health and Human Services Secretary, gave rise to “MAHA moms,” advocates pledging to “Make America Healthy Again” through assertions of parental rights and resistance to mandated vaccinations (Mansfield & Kochi, Reference Mansfield and Kochi2025). Understanding the political significance and policy consequences of these developments requires continued analysis of how individual experiences are linked to attitudes and potential political advocacy.
In addition to forging scholarly pathways, we believe this project has critical normative and practical implications. Our analysis, along with other polling on caregiving, suggests a deep disconnect between public opinion on caregiving policy and the current policy response. On balance the public is very supportive of expanding programs and financial support for caregivers and those they care for. This is true across racial, ethnic and gender groups and while it is truer for Democratic respondents than Republicans, it is nonetheless often true for Republicans as well. In fact, a recent study using the COVID-19 and Life with Impacts across Mental and Behavioral Health (CLIMB) survey found that more than 75% of people in the U.S. are in favor of policies intended to strengthen the caregiving infrastructure in the country. This means that in cutting those programs and financial support in recent federal policies, Republican policymakers are doing the opposite of what the public wants. This is a troubling failure of representative governance and policy responsiveness.
We do not believe this disconnect is intractable. Indeed, we believe our project helps point toward part of the solution. A key takeaway of our argument is that it is not just if caregiving is experienced but how it is experienced that informs public opinion. We further argue that the relationship between caregiving experience and policy attitudes is stronger when caregiving is more salient. Neither of these elements are static. Political advocates and stakeholders can encourage caregivers to make the personal-public connection, and they can work to increase the salience of caregiving, so the personal-public connection is more easily made. The first step is helping individuals recognize that they are a caregiver. The second step is helping them recognize that their experience is widely shared and that their needs – ongoing or in the past – are also widely shared. Organizations and advocates currently do this work; for example, The Geena Davis Institute and the CARE Fund both work to showcase the voices of caregivers and represent their experiences to the broader public. While these efforts cannot single handedly reverse the decisions of lawmakers, the more caregiving stories are amplified the harder they are to ignore. And most importantly, the more caregivers are encouraged to see the political significance of their own caregiving, the clearer the demand for policy change becomes.
Acknowledgements
The authors wish to thank the following individuals for their research assistance: Diya Baskaran, Jackley Dahlberg, Isabella Guerra, Maryam Jamali, Maungo Kabelo, Adriana Maciel, Nina Ude and Sesay Zakiah. Sarah Hayes (Georgetown University) coauthored Chapter 3. We are also grateful to the reviewers and editors whose feedback considerably improved this volume.
Tiffany D. Barnes
University of Texas at Austin
Tiffany D. Barnes is Professor of Political Science at the University of Texas at Austin. She is the author of Women, Politics, and Power: A Global Perspective (Rowman & Littlefield, 2007) and, award-winning, Gendering Legislative Behavior (Cambridge University Press, 2016). Her research has been funded by the National Science Foundation (NSF) and recognized with numerous awards. Barnes is the former president of the MidwestWomen’s Caucus and founder and director of the Empirical Study of Gender (EGEN) network.
Diana Z. O’Brien
Washington University in St. Louis
Diana Z. O’Brien is the Bela Kornitzer Distinguished Professor of Political Science at Washington University in St. Louis. She specializes in the causes and consequences of women’s political representation. Her award-winning research has been supported by the NSF and published in leading political science journals. O’Brien has also served as a Fulbright Visiting Professor, an associate editor at Politics & Gender, the president of the Midwest Women’s Caucus, and a founding member of the EGEN network.
About the Series
From campaigns and elections to policymaking and political conflict, gender pervades every facet of politics. Elements in Gender and Politics features carefully theorized, empirically rigorous scholarship on gender and politics. The Elements both offer new perspectives on foundational questions in the field and identify and address emerging research areas.