Introduction
Moulting is a cyclic phenomenon in which the rigid exoskeleton of crustaceans is periodically shed to enable growth and maturity (Drach, Reference Drach1939; Charniaux-Cotton, Reference Charniaux-Cotton1957; Charniaux-cotton, Reference Charniaux-cotton1960; Travis, Reference Travis1960a, Reference Travis1960b, Reference Travis1965; Stevenson, Reference Stevenson1961, Reference Stevenson1964; Skinner, Reference Skinner1962; McWhinnie, Reference McWhinnie1962; Roer and Dillaman, Reference Roer and Dillaman1984; Vigh and Fingerman, Reference Vigh and Fingerman1985; Gorissen and Sandeman, Reference Gorissen and Sandeman2022). Each moult cycle encompasses the period between two consecutive moults and has been subdivided into four major stages: intermoult, premoult, ecdysis, and postmoult (Drach, Reference Drach1939; Carlisle, Reference Carlisle1953; Passano, Reference Passano1960a; Stevenson, Reference Stevenson1968; Sudha and Anilkumar, Reference Sudha and Anilkumar2007; Kuballa and Elizur, Reference Kuballa and Elizur2008; Supriya et al., Reference Supriya, Sudha, Krishnakumar and Anilkumar2017).
Like most crustacean groups, brachyuran crabs generally undergo fasting throughout the moulting period, and a severe nutrient deficiency may result from fasting (Sánchez-paz et al., Reference Sánchez-paz, García-carreño, Muhlia-almazán, Peregrino-uriarte, Hernández-lópez and Yepiz-plascencia2006). Feeding ceases entirely during moulting and resumes only when the animal has an exoskeleton that is rigid enough to support its weight and manage food (Rivera-pérez and García-Carreño, Reference Rivera-pérez and García-Carreño2011). According to Nguyen et al. (Reference Nguyen, Chim, Lemaire and Wantiez2014), cumulative moults are influenced by voluntary food or energy intake. As moulting in crustaceans is a highly energy-demanding process, the moulting activity is initiated when there is sufficient energy to reach a threshold level (Niu et al., Reference Niu, Lin, Jiang, Chen, Wu, Tian and Liu2012; Nguyen et al., Reference Nguyen, Chim, Lemaire and Wantiez2014). The intermoult interval may exceed its normal duration if food supplies are reduced (Oh and Hartnoll, Reference Oh and Hartnoll2000). A high incidence of moult death syndrome is defined as sudden death after moulting or in a situation where the animal is only partly moulted (Bowser and Rosemark, Reference Bowser and Rosemark1981). Although the exact cause of this issue is unknown, it is most likely due to poor nutrition (Bowser and Rosemark, Reference Bowser and Rosemark1981). For instance, Homarus americanus has been shown to suffer from moult death syndrome due to a dietary deficiency in phospholipids (Bowser and Rosemark, Reference Bowser and Rosemark1981). Experimental observation of Marsupenaeus japonicus larvae fed with phospholipid-deficient diets showed that the larvae could not advance to the zoeal 2 stage (Teshima et al., Reference Teshima, Kanazawa and Yamashita1986).
Available literature has shown that decapod crustaceans exhibit no uniformity with respect to the utilisation of their metabolites for moulting, as they display an amazingly high level of diversity, even among closely allied groups or within the same species, occupying different geographical realms in the programming of moulting (Hasek and Felder, Reference Hasek and Felder2005; Nath et al., Reference Nath, Priya and Kappalli2024; Kappalli et al., Reference Kappalli, Nath and Gopinathan2025). For example, the mobilisation and use of carbohydrates during the moult cycle are highly variable and species-specific, driven by distinct physiological and ecological demands. The classic metabolic pattern observed in many decapods, such as Penaeus vannamei, M. japonicus, Penaeus duorarum, and Crangon crangon, involves the rapid consumption of stored fuel, particularly the quick depletion of carbohydrate or glycogen stores to meet the intense energy needs of initial cuticle synthesis (Sánchez-paz et al., Reference Sánchez-paz, García-carreño, Muhlia-almazán, Peregrino-uriarte, Hernández-lópez and Yepiz-plascencia2006). Furthermore, demand-driven shifts are common in the blue swimmer crab (Portunus pelagicus) and the American lobster (H. americanus). Free sugars temporarily increase in the premoult stage, leading to lower hepatopancreatic glycogen in the premoult stage of Litopenaeus vannamei (Telford, Reference Telford1968; Galindo et al., Reference Galindo, Gaxiola, Cuzon and Chiappa-carrara2009). In Hemigrapsus nudus and Penaeus esculentus, protein serves as the main energy source (Neiland and Scheer, Reference Neiland and Scheer1953; Barclay et al., Reference Barclay, Dall and Smith1983). In Niphargus rhenorhodanensis and Niphargus virei, lipids are the preferred energy source (Hervant et al., Reference Hervant, Garin, Mathieu and Freminet1999). In a brachyuran crab, Metapograpsus messor, the major hepatopancreatic reserves show a tendency to decline towards the late premoult and postmoult due to the increased utilisation of the reserves for the formation of a new exoskeleton and post-ecdysial recuperation (Kappalli et al., Reference Kappalli, Nath and Gopinathan2025). In Penaeus vannamei, Palaemon serratus, Callinectes sapidus, and Gelasimus hesperiae, haemolymph protein shows a significant increase as they enter premoult, suggesting increased protein synthesis, reduced degradation of proteins and resorption of cuticular proteins (Travis, Reference Travis1955; Soumoff and Skinner, Reference Soumoff and Skinner1983; Chan et al., Reference Chan, Rankin and Keeley1988; Nath et al., Reference Nath, Priya and Kappalli2024).
Experimental evidence is available, revealing the utilisation and variation in energy reserves during the prepubertal moulting and larval/juvenile moulting or moult-related starvation in crustaceans (Sánchez-paz et al., Reference Sánchez-paz, García-carreño, Muhlia-almazán, Peregrino-uriarte, Hernández-lópez and Yepiz-plascencia2006; Johnston et al., Reference Johnston, Ritar and Thomas2004; Li et al., Reference Li, Li, Wang, Chen, Hao and Wang2022). For instance, lipids are the primary energy source during food deprivation in late stages of growth in Jasus edwardsii phyllosoma larvae that were starved for 6–11 days. In contrast, protein catabolism was more significant in the early moulting stages (Ritar et al., Reference Ritar, Dunstan, Crear and Brown2003). Johnston et al. (Reference Johnston, Ritar and Thomas2004) further confirmed that the protease activities in phyllosoma larvae were significantly elevated from developmental stage 1 onwards. These findings suggest that utilisation of each energy source is dependent on distinct metabolic demands, and also that resources are closely allocated among survival, growth, and reproduction (Adiyodi and Adiyodi, Reference Adiyodi and Adiyodi1970; Capparelli and Flores, Reference Capparelli and Flores2011). It is, therefore, highly challenging to assume a typical metabolic profile during moulting in crustaceans (Sánchez-Paz et al., Reference Sánchez-Paz, García-Carreño, Hernández-López, Muhlia-Almazán and Yepiz-Plascencia2007).
In most of the crustaceans, moult and reproduction are simultaneous and often necessitate a physiological trade-off or synchronisation of these two high-energy-demanding physiological events (Sudha and Anilkumar, Reference Sudha and Anilkumar1996; Supriya et al., Reference Supriya, Sudha, Krishnakumar and Anilkumar2017; Kappalli et al., Reference Kappalli, Supriya, Krishnakumar, Gopinathan and Chang2012, Reference Kappalli, Nath and Gopinathan2025). In brachyuran female crabs like Aratus pisonii and Metopograpsus messor, this synchronisation relates directly to the management of energy reserves by employing either an income breeding strategy using newly acquired energy during the reproductive period or a mixed capital-income breeding strategy, where both stored and newly acquired energy are utilised (Carver et al., Reference Carver, Meidell, Cannizzo and Griffen2021; Griffin, Reference Griffin2025; Kappalli et al., Reference Kappalli, Nath and Gopinathan2025). The intermoult phase is critical not only for growth and reproduction, but also for resource mobilisation and preparation of the biochemical machinery for future demands. A key molecule in crustacean endocrine regulation is methyl farnesoate (MF), the unepoxidated analogue of insect juvenile hormone, which is principally known for its role in regulating crustacean reproduction and moult (Tobe et al., Reference Tobe, Young and Khoo1989; Nagaraju et al., Reference Nagaraju, Reddy and Reddy2006; Reddy et al., Reference Reddy, Nagaraju and Reddy2004; Gopal and Devi, Reference Gopal and Devi2018). Despite MF variations and general metabolic profiles available in the context of the female reproductive cycle, its role in synchronising reproductive preparation during the male moulting cycle remains largely unexplored.
In crustaceans, gas chromatography-mass spectrometry (GC-MS) analysis has been applied to elucidate moult-related changes in the metabolites of different tissues (Hopkins, Hopkins, Reference Hopkins1992; Li et al., Reference Li, Li, Wang, Chen, Hao and Wang2022). This analytical technique is used to analyse metabolic samples, where GC provides separation capabilities for the volatile compounds in a sample, while MS enables metabolite identification by fragmenting the components and determining them based on their molecular masses. As such, in green mud crab, Scylla paramamosain, GC-MS analysis has revealed metabolic variations in the hepatopancreas and ovary during the moult cycle (Li et al., Reference Li, Li, Wang, Chen, Hao and Wang2022). In the fiddler crab, Uca pugilator, the pleiotropic effects of ecdysteroids during moulting, regeneration, and reproduction have been analysed using GC-MS/LC-MS analysis (Hopkins, Reference Hopkins1992). Reports are also available for GC-MS identification and variation analysis of MF in the haemolymph during the female reproductive cycle of the spider crab, Libinia emarginata (Borst et al., Reference Borst, Laufer, Landau, Chang, Hertz, Baker and Schooley1987), the swimming crab (Portunus trituberculatus) (Xie et al., Reference Xie, Zhu, Li, Qiu, Cui and Tang2015) and the freshwater crab, Travancoriana schirnerae (Ayanath and Arath, Reference Ayanath and Arath2020). Despite the aforesaid studies, a comprehensive biochemical approach to understand the dynamics of metabolic profile related to crustacean moult cycle stages is still lacking. Since the haemolymph is one of the critical tissues reflecting all the metabolic changes related to any physiological process, the study on haemolymph metabolomics related to moult cycle is highly relevant to elucidate the metabolic mobilisation and its utilisation according to the growth demand of the organisms.
Fiddler crabs belong to the family Ocypodidae, are evolutionarily relevant, and are found in dynamic environments across various geographical regions worldwide (Rosenberg, Rosenberg, Reference Rosenberg2020; Nath et al., Reference Nath, Jose Priya and Kappalli2023, Reference Nath, Priya and Kappalli2024). The distribution of fiddler crabs helps reveal their adaptations to regional variations in climatic and edaphic factors of the marine upper shore environment and aids in reconstructing palaeoecological events (Barnwell and Thurman, Reference Barnwell and Thurman1984). In fiddler crabs, haemolymph (haematological) metabolites, primarily the low-molecular-weight molecules, serve as valuable biomarkers of nutritional status, moulting, and reproductive variations (Capparelli et al., Reference Capparelli, Thurman, Choueri, Dmds, Fontes, Nobre and McNamara2021; Nath et al., Reference Nath, Priya and Kappalli2024). These metabolites (<1000 Da in molecular weight) can also represent dietary nutrients and byproducts of cellular regulatory processes (Li et al., Reference Li, Alfaro, Nguyen, Young and Lulijwa2020). Therefore, a haemolymph metabolomics approach was used in the present study to investigate the metabolomic changes during the major moult cycle stages such as intermoult, premoult, and postmoult stages of the male fiddler crab, G. hesperiae. This ecologically important mangrove species is endemic to the Northern part of the Western Indian Ocean and adjacent waters (Shih et al., Reference Shih, Wong, Chan, Nguyen, Ngo and Hsu2022; Nath et al., Reference Nath, Jose Priya and Kappalli2023, Reference Nath, Priya and Kappalli2024). The male population of G. hesperiae inhabiting northern Kerala, India shows continuous moulting activity throughout the year, with peak moulting incidents (>55%) during the May–June months (Nath et al., Reference Nath, Priya and Kappalli2024). This study represents the first GC-MS metabolomic analysis of haemolymph in male fiddler crab species considering the major moult cycle stages. By identifying key energy metabolites and their variations, this work elucidates the biochemical management of this energy-intensive moulting process, providing crucial data for future biomarker discovery, endocrinological studies, and ecological monitoring of this important brachyuran group.
Materials and methods
Animal collection, rearing, and sampling
This study used adult, sexually mature male G. hesperiae with a range of carapace widths and body weights of 1.7–2.1 cm and 1.39–1.86 g, respectively (Nath et al., Reference Nath, Jose Priya and Kappalli2023), collected by catch per unit effort from the mangrove ecosystem of the Muzhapilangad estuary (11º46ʹ48ʹʹN 75º27ʹ36ʹʹE), located in the Kannur District of Kerala, India. The live specimens were successfully transported to the Marine Zoology Laboratory of the Central University of Kerala within 2–3 hours, yielding a 100% survival rate. They were kept in 10 L plastic cisterns containing mud and water collected from their natural habitat (Mangrove region). Each cistern was housed with five crabs to avoid overcrowding. Rearing conditions were maintained at a temperature of 29–32°C and a salinity of 30–33 ppt. Water was exchanged every 12 hours, and the crabs were fed clam meat twice a day. The amount of clam meat provided per cistern at each feeding was 2.00–2.50 g. The uneaten food was removed before the second feeding to minimise the risk of contamination. After 24 hours, moult staging was done, and 8 crabs from each moult stage (intermoult, premoult, and postmoult) were considered for sampling the haemolymph for GC-MS analysis.
Determination of moult staging
Detailed moult stage determination was made based on the characteristic changes observed in the epipodite of the third maxilliped as described earlier (Kappalli et al., Reference Kappalli, Supriya, Krishnakumar, Gopinathan and Chang2012; Supriya et al., Reference Supriya, Sudha, Krishnakumar and Anilkumar2017; Nath et al., Reference Nath, Priya and Kappalli2024). Accordingly, for the present study, the crabs were classified into 3 groups, viz. intermoult, premoult, and postmoult. The epipodite of the third maxilliped was excised and observed under the research microscope (Axio Lab A1; Carl Zeiss, Oberkochen, Germany) for the identification of the moult stages based on epidermal retraction, advancement of setogenesis processes, and variation in the haemocyte count in the epipodite matrix. During the intermoult stage, the epidermis lay close to the cuticle, and the matrix appeared opaque with dispersed haemocytes. The epipodite matrix of the intermoult stage showed the presence of a layer adjacent to the cuticle, referred to as a pseudolayer in 90% of cases. The premoult stage showed the retraction of the epidermis from the old cuticle along with the appearance of newly forming setae, and the haemocytes were found aggregated in the retracted epidermis. As the premoult stage advanced to the mid-premoult stage, the newly forming setal base became visible with more extended setal elongation. The epipodite matrix showed an increased number of haemocytes around the newly forming setae. As it advanced to the late premoult stages, the prominence of the newly forming setal base was visible, with anteriorly oriented newly forming setal tips visible, and a relatively smaller number of haemocytes were observed in the matrix. At the late premoult stage, the setal tip was more extended and reached closure to the setal base. The opening of the setal grooves was found to be widened, facilitating the extrusion of the newly formed setae. This was followed by ecdysis. The postmoult stage exhibited a transparent matrix channelled into the setal lumen of the fully-fledged, newly formed setae. The haemocytes were found dispersed in the matrix.
Haemolymph sampling
A total of 24 healthy crabs, eight from each of the three different moult stages (intermoult, premoult [D2], and postmoult) as technical replicates, were considered for haemolymph sampling. It was done quickly with minimal handling of animals to minimise physiological and endocrinological stress. Approximately 30–35 µL of haemolymph from each crab was collected using a syringe (25 gauge × 1 inch), pierced through the arthrodial membrane of the fifth walking leg. The collected haemolymph was transferred into a micro-centrifuge tube containing 50% anticoagulant solution (0.5 M ethylenediaminetetraacetic acid [EDTA] at pH 8.0; for a 100 ml solution, 1.17 g of EDTA was dissolved in 80 ml of distilled water [dH2O], then made up to 100 ml with dH2O, and the pH was adjusted to 8.0 using 2 M sodium hydroxide). The collected haemolymph from the individual crabs at respective moult stages was pooled and stored at −80°C for GC-MS analysis. The pooled haemolymph sample volume was approximately 500 µl.
Gas Chromatography-mass spectrometry
Sample preparation for GC-MS
The haemolymph samples were centrifuged at 12,000 g for 5 minutes, and the supernatant was collected and transferred to a fresh 1.5 ml Eppendorf tube and then stored at −20°C. For further analysis, 800 µl of methanol was added to 100 µl of the haemolymph sample, and replicates were maintained. The sample was vortexed for 10 seconds, incubated on ice for 1 hour and then centrifuged at 20,000 g for 10 minutes. The supernatant collected was transferred to a GC vial and dried under vacuum for 3 hours. Then, 90 µl of methoxylamine hydrochloride (15 µg/µl in pyridine) was added to the sample in the GC vial and incubated for 16 hours at room temperature. Then, the sample was subjected to trimethylsilylation by adding 90 µl of N-methyl-N-(trimethylsilyl) trifluoroacetamide (MSTFA) and 1% trimethylchlorosilane for 1 hour. Finally, 120 µl of hexane was added to the samples as the final step of the reaction (Zhang et al., Reference Zhang, Lu and Xu2013). The internal standard for the analysis was 0.1 µg/µl sucrose in 100 µl dH2O.
Loading of the samples to GC-MS
The equipment used for the analysis was the 7890A-5975C GC-MS system (Agilent Technologies, Santa Clara, CA, USA) equipped with an HP-5MS capillary column (30 m × 0.25 mm × 0.25 μm) (Agilent J & W Scientific, Folsom, CA, USA). The samples and their replicates were injected in randomised order. The samples were also prepared as quality controls, which were injected at specific intervals throughout the analysis. A 1 µL aliquot of the derivatised sample solution was injected into the GC column using a TriPlus autosampler (Thermo Fisher Scientific) at a constant helium flow rate of 1 ml min−1. The injector was kept at a constant temperature of 280°C. The temperature of the mass spectrometry (MS) transfer line to the quadrupole was set at 150°C, and the temperature of the electron impact ion source was maintained at 230°C. The compound elution settings were 2 minutes at 80°C isothermal, followed by a 10°C min−1 oven temperature gradient to a final temperature of 325°C, and then a 6-minute hold at 325°C. After that, the system was temperature-equilibrated at 80°C for 1 minute, and then the sample was injected. A 70 eV electron beam was used to produce ions. The scanning range of the spectra was recorded within 50–550 mz−1.
Data analysis
The individual peaks were identified by comparing the retention times with metabolite standards. Other peaks were identified by matching the mass spectra with the reference database available from the National Institute of Standards and Technology. A reverse match factor value above 700 was considered a good match. Overlapping peaks were resolved using single-ion traces. The individual integrated peak areas were converted to a relative response ratio, normalised to the internal standard (sucrose) peak area.
For principal component analysis (PCA), the relative response ratios for all haemolymph metabolites at different moult stages (intermoult, premoult, and postmoult) were analysed using MetaGeneAnalyse 1.7 (Max Planck Institute of Molecular Plant Physiology, Germany) and separated by their principal components. Data were log-transformed to achieve normality and centred to ensure the analysis focused on variations between the moult stages and among the moult stages. Non-detects (zero values) were treated as missing data or replaced with a small value (half the minimum detected) to allow for logarithmic transformation, ensuring they did not disproportionately bias the linear patterns observed in the bi-plots. The exclusively, commonly, and differentially expressed haemolymph metabolites (as technical replicates) at intermoult, premoult, and postmoult stages, along with their pairwise comparison data (intermoult and premoult; premoult and postmoult; postmoult and intermoult; intermoult and premoult and postmoult), were subjected to PCA using PAST software, version 4.03. Of the three principal components (PC1, PC2, and PC3) generated, only PC1 and PC2 were considered for interpretation. The variance and covariance were computed as 49.48%, and the correlation was 38.06%. Similarly, the common and differential metabolic pathways among different moult stages were also subjected to PCA to understand the moult-related variations, if any. The data used to generate the PCA plot Figure 7a are based on the frequency and presence/absence of 51 identified metabolic pathways across the three moult stages.
The fold changes, if any, in the shared/overlapping haemolymph metabolites between the two moult stages (intermoult and premoult, premoult and postmoult, intermoult and postmoult) and among all three moult stages (intermoult, premoult, and postmoult) are shown.
Results
Overview of metabolites in the haemolymph of G. hesperiae-GC-MS analysis
The total ion chromatograms (TICs) of the haemolymph samples demonstrated strong signals, large peak capacity, and reproducible retention times, indicating the reliability of the GC-MS for the present study (Figure 1 and Supplementary File S1). The derived haemolymph metabolite profile comprised 30 carbohydrates, 39 amino acids, 9 fatty acids, included with their respective derivatives or metabolites, and 48 compounds, including organic, carboxylic, and inorganic acids. In addition, 14 keto acids, 13 vitamins or their metabolites, 3 neurotransmitters, 12 nucleosides or nucleotides included with their derivatives or metabolites, 4 terpenoids, 6 amines, 9 benzenoids or phenols, 7 alcohols, 7 aldehydes, 11 inorganic compounds, and 14 other identified metabolites (Table 1).
Total ion chromatograms of the haemolymph at different moult stages in male Gelasimus hesperiae. (a) Intermoult, (b) premoult, (c) postmoult.

Figure 1 Long description
Three line graphs display total ion chromatogram traces of haemolymph samples across three moult stages. The x-axis in each graph represents retention time and the y-axis represents signal intensity, though exact numeric axis labels are not legible at this resolution. The image A shows the intermoult stage. The trace begins near the baseline, with several small peaks visible in the early portion of the run. A tall, narrow peak occurs at approximately mid-run, labeled with a value near 72.11. After this dominant peak, several smaller labeled peaks appear, including values near 73.44, 74.54, 75.55 and 76.59. The signal then gradually declines but remains elevated above the baseline, producing a noisy, slowly decreasing tail toward the end of the run. The image B shows the premoult stage. The trace stays very close to the baseline for most of the run. One very tall, narrow spike appears at approximately mid-run, labeled near 32.11. Before this spike, a smaller peak is visible near 9.57. After the spike, the trace returns close to the baseline and remains there for the remainder of the run. This panel shows the most distinct and isolated single peak of the three. The image C shows the postmoult stage. The trace begins near the baseline, then rises steeply to a tall narrow peak at approximately mid-run, labeled near 17.11. After the peak, the signal drops but settles at a level noticeably higher than the starting baseline, continuing as a relatively flat but noisy plateau toward the end of the run. This post-peak elevated plateau distinguishes image C from image B, where the signal returns to baseline and from image A, where the signal shows a more gradual decline.
Categorisation of identified metabolites from the haemolymph at different moult stages of male Gelasimus hesperiae

Table 1 Long description
Three columns list No., Category, and Metabolites, with rows numbered I through XV. Category I, Carbohydrates, their derivatives, metabolites, lists monosaccharides including D- erythrose, D- ribose, D- ribulose, D- xylulose, L- arabinose, lyxose, xylose, glycerone, and arabinonate; polysaccharide chitin; multiple monosaccharide derivatives; and pathway noted metabolites including 1,2- cyclohexanedione, 1,4- butanediol, ethylene glycol, D- glycerate 2,3- diphosphate, glycerol 3- phosphate, and hydroxyacetone. Category II, Amino acids, their derivatives, metabolites, lists non essential amino acids including alanine through cystine, essential amino acids lysine, methionine, and valine, plus amino acid derivatives and metabolites including putrescine and spermidine. Category III, Fatty acids, their derivatives, metabolites, lists saturated and unsaturated fatty acids, fatty acid derivatives, and metabolites including trioxilin. Category IV, Organic acids, carboxylic acids, inorganic acids, lists many organic acids including citrate, fumarate, malic acid, succinate, and pyruvic acid, plus carboxylic acids including phosphoenolpyruvate and shikimate, and inorganic acid phosphoric acid. Category V, Keto acids, lists compounds including alpha- ketoglutaric acid, 2- oxoglutarate, 4- hydroxyphenylpyruvate, phenylpyruvate, and 3- hydroxypyruvate. Category VI, Vitamins and their metabolites, lists vitamins including ascorbic acid, niacinamide, pyridoxal 5- phosphate, thiamine, and nicotine, plus related metabolites including 3,4- dihydroxybutanone 4- phosphate. Categories VII through XIV list neurotransmitters acetylcholine, gamma- aminobutyric acid, serotonin, and choline; nucleosides and nucleotides with derivatives and metabolites; terpenoids; amines; benzenoids and phenols; alcohols; aldehydes; and inorganic compounds including nitrate, nitrite, urea, calcium and calcium carbonate, tetrathionate, trithionate, and sulfur. Category XV, Others, lists additional named compounds including 2- hydroxypyridine, indole 3- acetamide, N- carbamoyl L- glutamate, tagaturonate, carbamate, formamide, methane sulfonate, and 1-hydroxy 2- naphthoic acid.
Metabolite profile of haemolymph at different moult stages of G. hesperiae
Obvious chromatographic differences were observed between samples from different moult cycle stages, and the typical TICs from each group are shown in Figure 1a–c and Supplementary Figure S1A–C. Among the 229 total metabolites, 117 were detected at the intermoult stage. These included 12 carbohydrates (10.25%), 22 amino acids (18.80%), and 20 fatty acids (17.09%) each including with their respective derivatives or metabolites, 6 organic or carboxylic or inorganic acids (5.12%), 13 keto acids (11.11%), 8 vitamins or their metabolites (6.83%), 2 neurotransmitters (1.70%), 5 nucleosides or nucleotides included with derivatives or metabolites (4.27%), 2 terpenoids (1.70%), 2 amines (1.70%), 6 benzenoids or phenols (5.12%), 4 alcohols (3.41%), 3 aldehydes (2.56%), 5 inorganic compounds (4.27%), and 7 other metabolites (5.98%) (Figure 2a).
Metabolite profile of haemolymph at different moult stages of male Gelasimus hesperiae. (a) Intermoult, (b) premoult, (c) postmoult.

Figure 2 Long description
A showing a pie chart with slice labels and percentages: Carbohydrates or derivatives or metabolites 10.25 percent. Amino acids or derivatives or metabolites 18.80 percent. Fatty acids or derivatives or metabolites 17.09 percent. Organic acids or derivatives or metabolites 5.12 percent. Keto acids 11.11 percent. Vitamins or metabolites 6.83 percent. Neurotransmitters 1.70 percent. Nucleosides or nucleotides included with derivatives or metabolites 4.27 percent. Terpenoids 1.70 percent. Amines 1.70 percent. Benzenoids or phenols 5.12 percent. Alcohols 3.41 percent. Aldehydes 2.56 percent. Inorganic compounds 4.27 percent. Other metabolites 5.98 percent. B showing a pie chart with slice labels and percentages: Carbohydrates or derivatives or metabolites 11.85 percent. Amino acids or derivatives or metabolites 17.12 percent. Fatty acids or derivatives or metabolites 18.85 percent. Organic acids or derivatives or metabolites 29.62 percent. Keto acids 2.34 percent. Vitamins or metabolites 1.85 percent. Nucleosides or nucleotides included with derivatives or metabolites 1.85 percent. Terpenoids 1.85 percent. Amines 1.85 percent. Benzenoids or phenols 1.85 percent. Alcohols 7.40 percent. Aldehydes 9.25 percent. Inorganic compounds 7.40 percent. Other metabolites 7.40 percent. C showing a pie chart with slice labels and percentages: Carbohydrates or derivatives or metabolites 13.86 percent. Amino acids or derivatives or metabolites 17.12 percent. Fatty acids or derivatives or metabolites 18.05 percent. Organic acids or derivatives or metabolites 20.93 percent. Keto acids 1.85 percent. Vitamins or metabolites 1.85 percent. Neurotransmitters 1.85 percent. Nucleosides or nucleotides included with derivatives or metabolites 1.85 percent. Terpenoids 2.77 percent. Amines 2.77 percent. Benzenoids or phenols 4.62 percent. Alcohols 2.77 percent. Aldehydes 2.77 percent. Inorganic compounds 4.77 percent. Other metabolites 6.85 percent.
In the premoult stage, 54 distinct metabolites were identified that comprising 1 carbohydrate (1.85%), 7 amino acids (12.96%), 1 fatty acid (1.85%) included with their respective derivative or metabolites, 16 organic or carboxylic or inorganic acids (29.62%), 3 keto acids (5.55%), 1 vitamin or its metabolites (1.85%), 3 nucleosides or nucleotides including their respective derivatives or metabolites (5.55%), 1 terpenoid (1.85%), 2 amines (3.70%), 3 benzenoids or phenols (5.55%), 4 alcohols (7.40%), 5 aldehydes (9.25%), 3 inorganic compounds (5.55%), and 4 other identified metabolites (7.40%) (Figure 2b).
In the postmoult stage, of the 146 identified metabolites included 20 carbohydrates (13.69%), 25 amino acids (17.12%), 3 fatty acids (2.05%) included with their respective derivatives or metabolites, 36 organic or carboxylic or inorganic acids (24.65%), 3 keto acids (2.05%), 10 vitamins or their metabolites (6.84%), 2 neurotransmitters (1.36%), 7 nucleosides or nucleotides included with their derivatives or metabolites (4.79%), 3 terpenoids (2.05%), 4 amines (2.73%), 7 benzenoids or phenols (4.79%), 5 alcohols (3.42%), 4 aldehydes (2.73%), 7 inorganic compounds (4.79%), and 10 other metabolites (6.84%) (Figure 2c).
An overview of the distribution of common and differentially expressed metabolites at intermoult, premoult, and postmoult stages is presented as Venn diagrams (Figure 3a). Comprehensive metabolite profiles corresponding to each moulting stage are also detailed in the Supplementary Table S1. According to the data, only 17 metabolites (out of 229; 7.42%) were commonly expressed throughout the moult cycle. Of 117 metabolites profiled at the intermoult staged crabs, 61 (52.13%) were uniquely expressed at this stage. A total of 54 metabolites were identified at the premoult stage, of which 13 (24.07%) were found only at the premoult. Of the 146 metabolites, 85 (58.62%) were specific to the postmoult. Also, 10 metabolites were exclusively shared by intermoult and premoult, 14 by premoult and postmoult, and 29 by intermoult and postmoult (Figure 3b–d).
Venn diagram depicting the number of common and differential metabolites identified at different moult stages in male Gelasimus hesperiae. (a) Total number of metabolites identified across the three moult stages; pairwise comparison between (b) intermoult and premoult, (c) premoult and postmoult, and (d) postmoult and intermoult; and (e) sequential changes in the number of common and differential metabolites during the moult cycle.

Figure 3 Long description
Five diagrams labeled A to E. Diagram A is a 3-set Venn diagram with sets labeled Intermoult, Premoult and Postmoult. Intermoult contains 61, Premoult contains 13 and Postmoult contains 85. The overlap between Intermoult and Premoult is 10, between Premoult and Postmoult is 14 and between Intermoult and Postmoult is 29. The central overlap of all three sets is 17. Diagram B is a 2-set Venn diagram comparing Intermoult and Premoult, with Intermoult containing 90, Premoult containing 27 and their overlap being 27. Diagram C is a 2-set Venn diagram comparing Premoult and Postmoult, with Premoult containing 23, Postmoult containing 114 and their overlap being 31. Diagram D is a 2-set Venn diagram comparing Postmoult and Intermoult, with Postmoult containing 99, Intermoult containing 71 and their overlap being 46. Diagram E is a flow diagram showing sequential changes in metabolite numbers during the moult cycle. Intermoult is labeled with 117, Premoult with 54 and Postmoult with 145. Arrows indicate transitions between stages, with numbers 27, 31, 46, 71 and 114 indicating changes between stages.
Moult stage-dependent fluctuation of major haemolymph metabolites
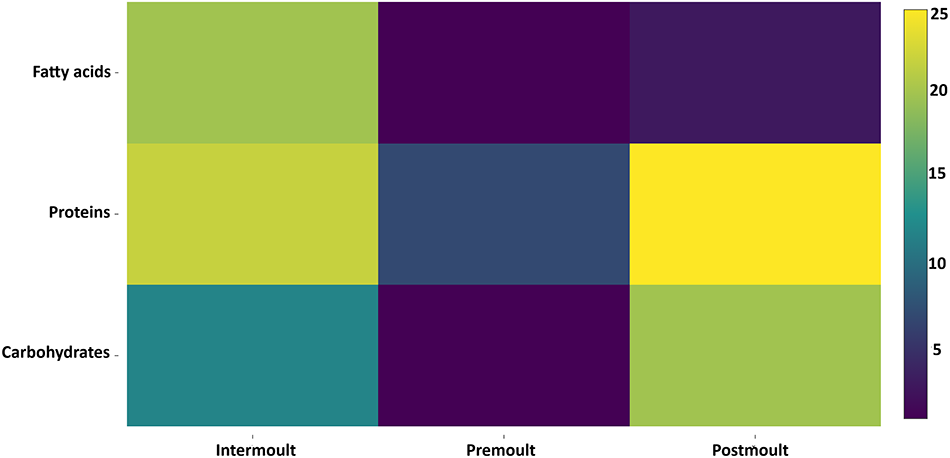
The three major biochemical components, such as carbohydrates, proteins, and fatty acids, exhibited a distinct pattern of fluctuation across the moult cycle (Figure 4). Carbohydrates and proteins showed a trend of depletion from the intermoult stage towards the premoult stage. 22 protein or their metabolites recorded at the intermoult were found to decline to 7 when the crabs attained the premoult. A similar pattern of depletion also occurred in carbohydrate reserves, as their number was 12 while the crabs were at the intermoult stage, but at the premoult stage, the number was only 1. Even fatty acid levels showed a drastic decline from the intermoult (20) to premoult (1) stages. This sharp drop indicates a massive mobilisation of these macromolecular reserves to fuel the energetic demands and structural synthesis required for ecdysis. Following ecdysis, the crabs exhibited a marked replenishment of reserves; by the postmoult stage, the number of identified carbohydrates, proteins, and fatty acids had increased to 20, 25, and 3, respectively.
Heatmap showing the fluctuation pattern of biologically important groups (carbohydrates, proteins, fatty acids) in male Gelasimus hesperiae.

Differential metabolite analysis
For differential metabolite analysis, a pairwise comparison was performed between 1) intermoult and premoult, 2) premoult and postmoult, and 3) postmoult and intermoult stages, using either of the samples as the control group (Figure 3b–d). According to the data, between the intermoult and premoult stages, a total of 27 metabolites (out of 171, including 117 at intermoult and 54 at premoult) were commonly expressed (Figure 3b). Similarly, between the premoult and postmoult stages, a total of 31 metabolites (out of 199, including 54 at premoult and 146 at postmoult) were commonly expressed (Figure 3c). Likewise, the postmoult and intermoult comparison showed a total of 46 (out of 262, including 146 at postmoult and 117 at intermoult) common metabolites (Figure 3d). While considering the sequential moult cycle stages, the variation in the number of metabolites was observed as the transition occurred from one stage to the subsequent stage. For instance, during the transition from intermoult to premoult, of 117 metabolites (found at the intermoult), 27 (commonly expressed metabolites) were retained at the premoult stage. Of the 54 metabolites found at the premoult stage, 31 were found retained at the postmoult stage. Of the 146 metabolites present at the postmoult stage, 46 were found retained as the crab attained the intermoult stage. Interestingly, 17 metabolites were retained across the moult cycle stages (Figure 3e).
Principal component analysis
The biplot of the principal component analysis indicated that the main components, PC1 (eigenvalue 1.47; 49.02% of variance) and PC2 (eigenvalue 1.00; 33.48% of variance), exhibited a correlation of metabolites with different moult stages (Figure 5a). Zone 1 indicated that all metabolites at the premoult vs. postmoult stages correlated with both the premoult and postmoult stages. Also, 33.33% of metabolites in the intermoult vs. premoult vs. postmoult correlate with both the premoult and postmoult stages. In Zone 2, 97.67% of metabolites in the postmoult correlate with the same stage (postmoult). Similarly, 34.48% of metabolites in the postmoult vs. intermoult correlate with the postmoult stage. The remaining 65.52% of metabolites in the postmoult vs. intermoult correlate with the intermoult stage in Zone 3. Likewise, all the metabolites in the intermoult and 2.32% of the postmoult vs. intermoult correlate with the intermoult stage. Zone 4 showed that the metabolites of the intermoult vs. premoult correlate with both the intermoult and premoult stages. Also, metabolites in the premoult stage correlate with the premoult stage and 66.66% of the intermoult vs. premoult vs. postmoult metabolites correlate with the premoult stage. According to the correlation loading plot of principal component PC1, metabolites at the postmoult stage were positively influenced. In contrast, the intermoult and premoult stages showed a negative influence (Figure 5b). However, the correlation loading plot of the principal component PC2 positively influenced the premoult stage. It negatively affected the intermoult and postmoult stages (Figure 5c). Overall, there was no distinct separation in the cluster analysis performed among the metabolites at intermoult vs. premoult, premoult vs. postmoult, and postmoult vs. intermoult stages. However, a close correlation of metabolites specific to intermoult, premoult and postmoult with their respective moult stages was found.
Principal component analysis of the haemolymph metabolites at intermoult, premoult, and postmoult stages in male Gelasimus hesperiae. (a) PCA biplot showing the correlation of metabolites between intermoult, premoult, and postmoult stages and moult-related clustering of metabolites based on exclusive (intermoult, premoult, postmoult), common, and differential metabolites (intermoult and premoult; premoult and postmoult; postmoult and intermoult; intermoult and premoult and postmoult). (b, c) Loading plots of PC1 and PC2. Each colour point represents an individual metabolite. The relative response ratios for all metabolites were analysed and separated by their principal components.

Figure 5 Long description
A scatter plot with the horizontal axis labeled, PC1 and the vertical axis labeled, PC2. The PC1 axis shows tick labels negative 2.0, negative 1.5, negative 1.0, negative 0.5, 0.0, 0.5, 1.0, 1.5, 2.0. The PC2 axis shows tick labels negative 2.0, negative 1.5, negative 1.0, negative 0.5, 0.0, 0.5, 1.0, 1.5, 2.0, 2.5. A legend lists, Intermoult; Premoult; Postmoult; Intermoult and Premoult; Premoult and Postmoult; Postmoult and Intermoult; Intermoult and Premoult and Postmoult. The plotted points form several clusters across the plot area, including clusters at negative PC1 with positive PC2, near PC1 around 0 with PC2 between about 0 and 2 and at positive PC1 with PC2 between about 0 and 1.5. Text labels near plotted points include, Premoult, Intermoult and Postmoult. The image B showing a bar graph with three category labels on the horizontal axis, Intermoult, Premoult, Postmoult. The vertical axis shows tick labels 8.0000, 6.0000, 4.0000, 2.0000, 0.0000, negative 2.0000, negative 4.0000, negative 6.0000, negative 8.0000. The vertical axis label is not readable. The bar heights are: Intermoult at negative 6.0000, Premoult at negative 1.0000, Postmoult at 8.0000. Postmoult is the highest bar and Intermoult is the lowest bar. The image C showing a bar graph with three category labels on the horizontal axis, Intermoult, Premoult, Postmoult. The vertical axis label reads, Correlation coefficient. The vertical axis shows tick labels 0.90, 0.75, 0.60, 0.45, 0.30, 0.15, 0.00, negative 0.15. The bar heights are: Intermoult at negative 0.15, Premoult at 0.90, Postmoult at negative 0.10. Premoult is the highest bar and Intermoult is the lowest bar.
Fold changes of common/shared metabolites
The commonly observed metabolites of intermoult vs. premoult stages showed noteworthy overexpression at the premoult stage; particularly, 3-hydroxypropanal and 3-aminopropanal showed a noticeable 1.41-fold increase (Figure 6a). The premoult-to-postmoult stage transition revealed a 0.82-fold change in trimethylamine and acetate. Oxaloglycolate and mevalonate underwent subtle changes (0.6–0.7-fold) in the postmoult stage. A 0.49-fold change was observed for P-benzoquinone at the premoult stage, and all those metabolites showing fold changes also exhibited substantial fold changes in the premoult vs. postmoult stages (Figure 6b). About 13% of the differential metabolites in the postmoult vs. intermoult stage showed 1.41 fold change of 3-amino-3-oxohexanoate. Indole-3-acetamide exhibited a 1.02-fold change, while shikimate and ethanol exhibited minor changes (0.88 and 0.52-fold, respectively) during the postmoult stage. 0.86 fold change of quinoline-4-carboxylic acid was noted at the intermoult stage (Figure 6c). Approximately 7.4% of shared metabolites among the intermoult, premoult and postmoult stages showed more than 0.5-fold increases in urocanic acids, nitrous oxide, arginine and anthranilate at the postmoult stage. In the premoult stage, there was a substantial 1.43-fold increase in hydroxyacetone, a 1-fold change in glycolic acid and a 0.7-fold change in glycine related to the intermoult stage. The premoult stage revealed a 1-fold change in 1,3-diaminopropane compared to the postmoult stage (Figure 6d).
Fold changes of the common metabolites at different moult stages in male Gelasimus hesperiae. (a) Intermoult vs. premoult; (b) premoult vs. postmoult; (c) postmoult vs. intermoult; (d) intermoult vs. premoult vs. postmoult. Inter-intermoult, pre-premoult, post-postmoult. Data are expressed as mean ± SD (sample size panel a = 10; b = 14; c = 29; d = 17).

Figure 6 Long description
Four grouped horizontal bar charts labeled A, B, C and D compare metabolites across different stages: Intermoult, Premoult and Postmoult. Each chart has the horizontal axis labeled Log 2 Value, ranging from 0 to 3.5. Chart A compares Intermoult and Premoult stages for 10 metabolites, including Hypoxanthine and Pyruvic acid, where Premoult generally shows higher values, with Hypoxanthine reaching approximately 2.5. Chart B compares Premoult and Postmoult stages for 14 metabolites, such as Homocysteine and Trimethylamine. Premoult tends to be higher, with Homocysteine around 2.8. Chart C compares Postmoult and Intermoult stages for 29 metabolites, including O-Acetyl-L-serine and Kynurenate. Postmoult is generally higher, with O-Acetyl-L-serine near 3. Chart D shows all three stages for 17 metabolites, such as Limonene and Urocanic acid. Premoult often exceeds others, with Limonene around 2.5. The charts illustrate pairwise comparisons and overall trends, highlighting that Premoult often has higher metabolite levels. The combined view in Chart D confirms Premoult′s dominance across shared metabolites. Visual differentiation is indicated by distinct bar colors for each stage.
Mapping of metabolic pathways at different moult stages
From the identified metabolites, a total of 51 metabolic pathways were deduced, of which 32 were commonly found across all three moult stages. These shared pathways were related to the metabolism of carbohydrates, amino acids, lipids, cofactors, vitamins, nucleotides, terpenoids, polyketides, limonene, and pinene and were also associated with membrane transport, translation, signal transduction, signalling molecules, and interaction. However, no metabolites were observed under the metabolic pathway of D-glutamine and D-glutamate under amino acid metabolism in premoult and postmoult stages. Additionally, the metabolites of the ubiquinone and other terpenoid-quinone biosynthesis pathways, as well as those involved in vitamin and cofactor metabolism, unsaturated fatty acid biosynthesis, linoleic acid metabolism, and arachidonic acid metabolism, were observed solely in the premoult stage. Likewise, metabolites involved in chitosan biosynthesis, amino sugar, and nucleotide sugar metabolism, which are part of carbohydrate metabolism, were only observed in the postmoult stage. Also, the metabolites of carbohydrates (including inositol phosphate) and amino acids (including histidine), were exclusively observed during the intermoult and premoult stages, while the signal transduction pathway, including mTOR signalling pathway, was solely detected in the premoult and postmoult stages, metabolites involved in oxidative phosphorylation, membrane transport translation (including ABC transporters), carbohydrate metabolism (including ascorbate and aldarate), amino acid metabolism (cysteine and methionine, lysine, and glutathione), vitamin metabolism (vitamin B6, thiamine, and pyrimidine) were present in both the intermoult and postmoult stages. Furthermore, metabolites associated with the amino acid metabolic pathways and energy metabolism (including beta-alanine, taurine, hypotaurine, glyoxylate, dicarboxylate, methane, and nitrogen) were relatively higher (>60%) during the intermoult stage when compared to the premoult and postmoult stages. Similarly, the predominant metabolic pathways (>60% of metabolites) identified during the postmoult stage included carbohydrate metabolism (including citric acid cycle, glyoxylate and dicarboxylate metabolism) as well as energy metabolism including methane, nitrogen and oxidative phosphorylation (Figure 7c).
Principal component analysis of the correlation of moult stage-specific metabolites with their associated metabolic pathways in male Gelasimus hesperiae. (a) PCA biplot showing the distribution of 51 metabolic pathways across moult stages. (b) Eigenvalues and cumulative variance of the principal components. (c) Heatmap showing the moult-related variation in the number of metabolites, as a percentage, associated with their metabolic pathway. The plot is based on the relative abundance of metabolites mapped to each pathway. Key drivers of separation include carbohydrate and protein metabolism pathways.

Figure 7 Long description
Panel A is a scatter plot illustrating principal component analysis (PCA) of metabolic pathways across moult stages. The horizontal axis is labeled PC1 with 49.48 percent variance and the vertical axis is labeled PC2 with 38.06 percent variance. Points are distinguished by colors representing different pathways, with arrows indicating loadings. Premoult, Intermoult and Postmoult stages are clustered separately. Panel B is a bar chart with a line showing eigenvalues and cumulative variance for principal components. The horizontal axis lists components PC1, PC2, PC3, with eigenvalues of 1.002, 0.769 and 0.42 respectively. The cumulative variance line rises from PC1 to PC3, reaching approximately 100 percent. Panel C is a heatmap comparing pathway intensities across moult stages: Intermoult, Premoult and Postmoult. The color scale from 0 to 90 represents relative abundance, with darker shades indicating higher values. Notable pathways include carbohydrate and protein metabolism. The panels collectively show how metabolic pathways vary across different moult stages, with PCA highlighting separation, eigenvalues summarizing variance and the heatmap detailing pathway abundance.
Moult-specific correlation of metabolic pathways: PCA analysis
All the identified metabolites across the moult stages were mapped to known biological pathways archived in the KEGG database and assigned to 51 distinct pathways. Based on metabolites associated with specific or multiple pathways, a PCA analysis was performed to detect the moult-specific correlation. The biplot of the PCA showed that the principal components PC1 (eigenvalue 1.60; % of variance 53.37) and PC2 (eigenvalue 0.91; % of variance 30.62) exhibited a correlation between metabolites with different moult stages (Figure 7a and b). A total of 44 metabolic pathways were plotted in both the intermoult and postmoult stages, whereas the premoult stage differed substantially, involving metabolites associated with 39 distinct pathways. Specifically, the premoult stage showed a positive correlation with metabolites involved in the pathways of neuroactive ligand-receptor interaction, metabolism of arginine and proline, taurine and hypotaurine, beta-alanine, lysine, serine and threonine, cyano amino acid, glycerolipid, nicotinate and nicotinamide, methane, sulphur, butanoate, propanoate, and aminoacyl tRNA biosynthesis. In contrast, the intermoult and postmoult stages were correlated with metabolic pathways related to alanine, aspartate, glutamate, phenylalanine, tyrosine, tryptophan, pyruvate, glyoxylate and dicarboxylate, glycerophospholipid, riboflavin, vitamin B6, nitrogen, and oxidative phosphorylation (Figure 7a).
Discussion
Like other crustaceans, growth in fiddler crabs is a discontinuous process, during which the exoskeleton is periodically replaced through successive moults. Moulting induces physiological stress, and its success can be assessed by measuring cyclical variations in metabolites such as carbohydrates, amino acids, fatty acids, organic acids, vitamins, and other resource-related metabolites in the haemolymph. Previous reports suggest that during moulting, the metabolic activities of the crabs increase rapidly, causing the hepatopancreas and haemolymph to release elevated levels of metabolites into the haemolymph (Sugumar et al., Reference Sugumar, Vijayalakshmi and Saranya2013; Nath et al., Reference Nath, Priya and Kappalli2024; Kappalli et al., Reference Kappalli, Nath and Gopinathan2025).
Among the 229 identified haemolymph metabolites during the entire moult cycle of G. hesperiae, carbohydrates, amino acids, fatty acids, organic acids, and keto acids and their derivatives and/or metabolites constituted a noteworthy portion, and their stage-wise variations are closely linked to the energy demands of the moulting process. Throughout the moult cycle of G. hesperiae, noteworthy differences in carbohydrates were observed between the moult stages. A remarkable decrease in carbohydrates during the intermoult and premoult staged crabs suggested that free sugars were utilised for energy production. However, during the postmoult stage, elevated levels of monosaccharides (excluding glucose), polysaccharides, and other carbohydrate derivatives were found circulating in the haemolymph. This result may suggest dietary absorption or mobilisation of the hepatopancreas during the postmoult stage to recover its normal condition, agreeing with the previous reports (Sugumar et al., Reference Sugumar, Vijayalakshmi and Saranya2013; Jimenez and Kinsey, Reference Jimenez and Kinsey2015). However, the absence of glucose in the postmoult stage in G. hesperiae during the present study could indicate that the glucose derived from the diet or the glycogenolysis during the premoult stage might be used up for chitin synthesis after moulting, as evidenced by the presence of chitin in the postmoult stage. The mobilisation and use of carbohydrates during the crustacean moult cycle are highly variable and species-specific, driven by distinct physiological and ecological demands. The classic metabolic pattern observed in many decapods, such as Penaeus vannamei and M. japonicus, involves the rapid consumption of stored fuel, particularly the quick depletion of glycogen to meet the intense energy needs of initial cuticle synthesis (Sánchez-paz et al., Reference Sánchez-paz, García-carreño, Muhlia-almazán, Peregrino-uriarte, Hernández-lópez and Yepiz-plascencia2006). This rapid decline in carbohydrates from premoult to postmoult is also documented in Paenaeus duorarum and C. crangon (Sánchez-paz et al., Reference Sánchez-paz, García-carreño, Muhlia-almazán, Peregrino-uriarte, Hernández-lópez and Yepiz-plascencia2006). Furthermore, demand-driven shifts are common in species like the blue swimmer crab, P. pelagicus, and the American lobster, H. americanus. Free sugars temporarily increase in the premoult stage due to hormonally driven mobilisation (glycogenolysis) from stores, leading to lower hepatopancreatic glycogen in the premoult stage of L. vannamei (Telford, Reference Telford1968; Galindo et al., Reference Galindo, Gaxiola, Cuzon and Chiappa-carrara2009). These circulating sugars are subsequently consumed for final cuticle hardening and expansion, resulting in a sharp postmoult decline. In a brachyuran crab, M. messor, the hepatopancreatic oligosaccharide and polysaccharide fractions showed a perceptible increase as the crabs entered premoult stage, then showed a tendency to decline towards late premoult. The possible reason for the initial increase is the resorption of these reserves from the cuticle into the hepatopancreas, or as premoult is initiated, the hepatopancreas responds to the intrinsic stimuli and begins synthesis of the organic reserves to be subsequently utilised for the formation of the new cuticle and exo-skeleton. This subsequent depletion was quite possibly due to the increased utilisation of the reserves for the formation of a new exoskeleton. Levels of the carbohydrate reserves showed a further decrease immediately postmoult; these reserves were mobilised in connection with post-ecdysial recuperation, which might include strengthening of the hitherto soft exoskeleton and replenishment of the alimentary resources, as the individuals were incapable of feeding immediately after moulting (Kappalli et al., Reference Kappalli, Nath and Gopinathan2025). In contrast, this study reveals a massive accumulation of carbohydrates during the postmoult phase of G. hesperiae, a finding that represents a remarkable species-specific divergence from the established pattern. This difference is best explained by the unique ecological niche and metabolic strategy of the fiddler crab. As an intertidal surface deposit feeder, the diet of G. hesperiae supplies a constant influx of complex, carbohydrate-rich detritus. Crucially, its small size allows it to quickly resume feeding after ecdysis. This rapid dietary absorption fuels the postmoult accumulation. Metabolically, this surge is not just passive storage but a specialised allocation strategy. The immediate absence of glucose alongside elevated levels of monosaccharides and derivatives (especially those linked to chitosan biosynthesis and amino sugar metabolism, pathways exclusive to the postmoult stage) may suggest the rapid and efficient shunting of newly absorbed carbohydrates towards the energy-intensive process of new exoskeleton synthesis and calcification. Therefore, this pattern is not merely an opposite strategy, but a specialised, adaptive strategy driven by the unique ecological/nutritional context of the fiddler crab, ensuring rapid hardening for survival in its possibly predator-rich habitat.
In G. hesperiae, the amino acid composition and concentration in the haemolymph of the intermoult, premoult, and postmoult were notably different. Specifically, the nonessential amino acids, such as asparagine, glutamate, beta-alanine, citrulline, and L-glutamine, were predominantly observed during the intermoult stage, while crabs in the postmoult stage exhibited higher concentrations of essential amino acids such as cysteine, valine, and methionine. The nonessential amino acids, such as arginine, glycine, and L-aspartate, were relatively stable throughout the moulting cycle. The nonessential amino acids take part in regulating cellular osmotic pressure, as investigated in the tissues of C. sapidus (Gerard and Gilles, Reference Gerard and Gilles1972). In crustaceans, marked differences in osmotic pressure were observed across different moult cycle stages (Baumberger and Olmsted, Reference Baumberger and Olmsted1928). Alanine was found to be more prevalent in male crustaceans, contributing to the regulation of muscle osmotic pressure (Gerard and Gilles, Reference Gerard and Gilles1972). Glutamate and asparagine were found in both postmoult and intermoult stages. Arginine, a well-known phosphagen, can substitute for creatine phosphate in muscle contraction during moulting in crustaceans (Simpson et al., Reference Simpson, Allen and Awapara1959; Meister, Reference Meister2012). Glycine, aspartic acid, and glutamic acid are the predominant protein residues attributed to the cuticular protein in crustaceans (Welinder, Reference Welinder1974; Kragh et al., Reference Kragh, Mølbak and Andersen1997; Andersen, Andersen, Reference Andersen1999; Shafer et al., Reference Shafer, McCartney and Faircloth2006). The presence of vital amino acids responsible for cuticle formation was present in the postmoult and intermoult stages, which can be correlated with the higher concentration of the cuticular protein during these moult stages in the P. pelagicus (Sugumar et al., Reference Sugumar, Vijayalakshmi and Saranya2013). The presence of valine in male G. hesperiae (present study), has also been reported in another male crab, Ocypode platytarsis, where this amino acid is involved in the hardening of the exoskeleton during the postmoult stage (Sankar and Yogamoorthi, Reference Sankar and Yogamoorthi2012). Asparagine and methionine were not detected in the haemolymph at the premoult phase during the present study, as these amino acids might be attributed to the hydration state of premoult phase (Cohen et al., Reference Cohen, March and Pinto1986). The absence of cysteine, proline, serine, and valine at the intermoult stage and also the absence of asparagine, glutamate, glycine, aspartate, cysteine, proline, serine, and valine at the premoult stage (when compared with that of the postmoult stage) might be due to their hydrolysis, aligning with findings in another crab, Chionoecetes opilio (Martinez et al., Reference Martinez, Hernandez and Lage-yusty2007).
Haemolymph proteins and their derivatives were found in greater numbers during the postmoult and intermoult stages of G. hesperiae, potentially indicating that internal tissue growth occurs during these moult stages. The result was contrary to Passano (Passano, Reference Passano1960a, Reference Passano1960b), as the postmoult, premoult, and intermoult stages exhibited a considerably low level of haemolymph protein. Decapod crustaceans exhibit no uniformity with respect to the utilisation of their metabolites for moulting, as they exhibit a high level of diversity in the programming of moulting even among closely allied groups or within the same species, but occupying different geographical realms (Hasek and Felder, Reference Hasek and Felder2005; Nath et al., Reference Nath, Priya and Kappalli2024; Kappalli et al., Reference Kappalli, Nath and Gopinathan2025). This may lead to species-wise variation in the use of resources during the moult cycle. The species-specific mobilisation and utilisation might be driven by distinct physiological and ecological demands as reported in several decapod species inhabiting diverse habitats and different geographical regions.
Crustaceans can synthesise saturated and monounsaturated fatty acids from the carbohydrate precursors (Castell, Reference Castell1983); however, unsaturated fatty acids must be acquired through diets (Tacon, Reference Tacon1990). The metabolomic profile of G. hesperiae revealed the presence of both saturated and unsaturated fatty acids along with their analogues, including 8-aminocaprylic acid, heptadecanoic acid, linoleic acid, and methyl palmitoleate during the intermoult stage. Lipoic acid was predominantly seen in the postmoult stages of G. hesperiae, as evidenced by the present study. It can be synthesised de novo, and as an antioxidant, it is involved in lipid metabolism and also acts as a cofactor of complex enzymes like pyruvate dehydrogenase and alpha-ketoglutarate dehydrogenase in the Krebs cycle (Jayanthi and Varalakshmi, Reference Jayanthi and Varalakshmi1992; Bast and Haenen, Reference Bast and Haenen2003; Trattner et al., Reference Trattner, Pickova, Park, Rinchard and Dabrowski2007). Both linoleic acid and lipoic acid are crucial under adverse conditions in crustaceans, especially during ecdysis, as they are involved in cell synthesis, reproduction, and endocrine and immune functions (Catacutan, Reference Catacutan1991; Dall, Reference Dall, Allan and Dall1992; Xu et al., Reference Xu, Ji, Castell and O’dar1994; Glencross, Reference Glencross2009; Emerenciano et al., Reference Emerenciano, Cuzon, Arevalo, Miquelajauregui and Gaxiola2012).
The vitamins like ascorbic acid (vitamin C) and its oxidative form, L dehydro-ascorbate are found during the intermoult and the postmoult stage is characterised by the presence of pyridoxal-5-phosphate (vitamin B6) and thiamine, along with ascorbic acid. According to previous reports (Guary et al., Reference Guary, Kanazawa, Tanaka and Ceccaldi1976; Song et al., Reference Song, Cai, Bu, Liu, Song, Yang, Wang, Shi, Qin and Chen2023), ascorbic acid and L-dehydroascorbate are involved in the synthesis of benzoquinone, a key component of crustacean shells. Recently, in the Chinese mitten crab, Eriocheir sinensis, the role of these vitamins in shell hardening has also been documented (Song et al., Reference Song, Cai, Bu, Liu, Song, Yang, Wang, Shi, Qin and Chen2023). The present study further reveals the presence pyridoxal-5-phosphate which plays a vital role in amino acid metabolism and protein utilisation during the crustacean moulting process (Deshimaru and Kuroki, Reference Deshimaru and Kuroki1979; Li et al., Reference Li, Yu, Chen, Zeng, Liu and Qin2010). Niacinamide/nicotinamide (a form of Vitamin B3) is present in the haemolymph of all three moult stages (intermoult, premoult, and postmoult) of G. hesperiae. These compounds act as precursors of essential cellular metabolic coenzymes, including nicotinamide adenine dinucleotide (NAD+) and nicotinamide adenine dinucleotide phosphate (NADP+), which are involved in lipid metabolism, respiratory oxidation, and anaerobic catabolism of sugars (Lanska, Reference Lanska2012). All these energy-requiring physiological processes are crucial for the moulting process in crustaceans.
Among the neurotransmitters, acetylcholine was identified at the intermoult stage, while 4-aminobutyric acid/Gamma-Aminobutyric Acid was found at the postmoult stage in G. hesperiae. In crustaceans, acetylcholine is a key neurotransmitter in the chemosensory neuronal pathways (Florey, Reference Florey1973), playing a role in locomotory activities through the neuronal transmission across neuromuscular gaps and is regulated by the inhibitory actions of the acetylcholine esterase (Kravitz et al., Reference Kravitz, Kuffler and Potter1963; Singh et al., Reference Singh, Rostant, Mohammed, Jairam, JJHervant, Khan Ali and Mohammed2022).
The role of phenol compounds as tanning agents released from the hyaline cells and crosslinked with the newly formed cuticle in crustaceans has been suggested (Vacca and Fingerman, Reference Vacca and Fingerman1983). The serum of a fiddler crab, Uca pugilator, showed the presence of an unidentified phenol compound throughout the moult cycle stages except the late postmoult (Vacca and Fingerman, Reference Vacca and Fingerman1983). However, in the present study, phenols such as guaiacol and salicyl alcohol were found only at the intermoult stage of G. hesperiae.
The organic acids deduced from the present study at different moult stages are likely involved in various energy metabolic pathways. In crustaceans, the intermoult stage is considered an ideal period of growth and development (Devaraj and Natarajan, Reference Devaraj and Natarajan2006). During this stage, the organic acid picolinic acid, an intermediate in the tryptophan metabolism, takes part in neuroprotective and immunological functions (Grant et al., Reference Grant, Coggan and Smythe2009). Pyruvic acid, a product of glycolysis, provides sufficient energy to the cells under aerobic conditions, thereby promoting growth and development at the intermoult stage (Huang et al., Reference Huang, Wang, Yue, Chen, Gaughan, Lu, Lu and Wang2015). Compared to the intermoult stage, organic acids involved in diverse metabolic pathways (lysine and tryptophan metabolism, terpenoid backbone synthesis, fatty acid biosynthesis, and as a cofactor) were found to be differentially detected during the premoult stage. Organic acids identified during the postmoult stage include hydrocinnamic acid (mevalonate and shikimate pathways), lactic acid (lactic acid cycle/glycolysis), oxalic acid (glyoxylate/glycolate, ascorbate, and oxaloacetate pathway), methyl citric acid (beta oxidation of fatty acids), quinoline-4-carboxylic acid (inhibitors of alkaline phosphatase), 2,6-diaminopimelic acid (lysine biosynthesis), 2-benzylmalate, D-glycerate (glyoxylate and dicarboxylate metabolism), 2-hydroxyvaleric acid (fatty acid metabolism), acetamide (indole 3 acetamide pathway), methylmalonate (pyrimidine metabolism), perillic acid (limonene and pinene degradation), phthalic acid (pyrene metabolism/environment pollutant), succinate (citric acid, butanoate, pyruvate, vitamin B6, oxidative phosphorylation and sulphur, glyoxylate, dicarboxylate), D-glucarate (ascorbate and aldarate metabolism), maleate (butanoate metabolism), phosphoenol pyruvate (metabolites in citric acid cycle), tetranorbiotin (biotin metabolism), fumarate (citric acid cycle). However, the remaining metabolites derived from organic acids were shared with the same pathways at the intermoult and premoult stages.
Among the total metabolites recovered in this study, 117 were found in the intermoult stage, of which 61 (52%) were found exclusively at the intermoult stage. The intermoult-specific metabolites were found to be predominantly functional in the biosynthesis of the amino acid isoleucine, as well as glycerolipid and purine metabolism. Other metabolic functions of the deduced metabolites have been addressed under two categories. I) Metabolism of 15 amino acids (alanine, beta-alanine, proline, valine, leucine, isoleucine, L glutamine, aspartate, glutamate, lysine, citrulline, arginine, phenylalanine, tryptophan), monosaccharides (glycerone), vitamins (niacinamide/nicotinamide and ascorbate), signalling molecules (inositol phosphate, methane, nitrogen, sulphur), and omega-6 fatty acids (linoleic acid and arachidonic acid); II) metabolic pathways including glycolysis/gluconeogenesis, glyoxylate/dicarboxylate metabolism, pyruvate metabolism, ascorbate and aldarate metabolism, methyl palmitoleate, mevalonate, shikimic acid, serotonin, and salicyl alcohol pathways, terpenoid pathway and MF. Methylfarnesoate, a lipophilic sesquiterpenoid and an analogue of insect juvenile hormone, is crucial to coordinate both moulting and reproduction in crustaceans. While this study did not directly quantify MF, the observed dynamic changes in the lipid, fatty acid, and terpenoid-related metabolite pools in haemolymph are highly crucial.
The premoult stage showed the lowest number of metabolites (54 out of 229), and out of these, 13 metabolites (25%) were found exclusively in this stage. The presence of these premoult-specific metabolites was functionally linked to energy metabolism, viz., nicotinate and nicotinamide, butanoate, sulphur, glycine, serine and threonine, purine, and glyoxylate and dicarboxylate metabolism. Besides, derivatives of glycolysis (glycine and serine), byproducts of amino acids (glutaric acid), and byproducts of fatty acids (butanoic acid) were also found in the haemolymph of premoult crabs.
Contrary to the premoult stage, the postmoult stage showed the highest number of metabolites (146 out of 229). Among these, 85 metabolites (59%) were exclusive to the postmoult stage, and they primarily consist of organic acids/compounds and their derivatives with functional roles in the metabolism of fatty acids, amino acids, DNA replication, as well as intermediates in mevalonate biosynthesis, glycolysis, gluconeogenesis, citric acid cycle, and the electron transport chain (Wu, Reference Wu2009; Ahmed, Reference Ahmed2021; Wang et al., Reference Wang, Hou, Deng and Wang2023). Neurotransmitters and antioxidants, which are involved in pathways such as the citric acid cycle, mevalonate-shikimate biosynthesis, phthalic acid pathway, etc., are essential for recovery from moulting stress and returning to normal physiological condition (Li and Zhang, Reference Li and Zhang2016).
Other metabolites were functionally mapped for diverse functions. Briefly, the biosynthesis of 1-allyl-2-pyrrolidines, which are byproducts formed from microbial degradation of pyridine (Gupta et al., Reference Gupta, O’loughlin and Sims2019). Biosynthesis of glycoproteins and glycolipids is essential for cellular recognition and signalling (Ganem, Reference Ganem1996). The cofactor of carbamoyl phosphate synthase-1, which activates the urea cycle, removes excess nitrogen from the body (Ramakrishnan and Vijayakumar, Reference Ramakrishnan and Vijayakumar2017). Inositol phosphate metabolism is a crucial process in the cellular signalling (Hancock, Reference Hancock2017). Nitrogen and sulphur metabolism are essential for amino acid synthesis (Bromke, Reference Bromke2013). Mitogen-activated protein kinase pathways are important for cell responses, including stress reactions and differentiation (Matsuzawa and Ichijo, Reference Matsuzawa and Ichijo2008).
Furthermore, in our study, all of the differential metabolites of the moult stages were mapped to the biological pathways listed in the KEGG database, which were assigned to 51 pathways, 32 of which were commonly expressed in all the moult stages related to the metabolism of carbohydrates, amino acids, fatty acids, cofactors, vitamins, nucleotides, terpenoids, polyketides, limonene, and pinene and also associated with membrane, transport translation, signal transduction, signalling molecules, and interaction. However, 19 pathways were exclusively observed at specific stages, i.e., 1) D-glutamine and D-glutamate metabolism were specifically detected during the intermoult stage. These amino acids, along with other amino acids such as aspartate and alanine, serve as metabolic fuels for tissues other than hepatopancreas, which are necessary for the normal growth and development of the crabs (Li and Zhang, Reference Li and Zhang2016). 2) Ubiquinone and other terpenoid-quinone biosynthesis, and biosynthesis of unsaturated fatty acids, particularly linoleic acid and arachidonic acid at the premoult stage. As per the literature, polyunsaturated fatty acids (PUFA) from the linolenic (n-3) and linoleic (n-6) families have been recognised as vital nutrients that enhance moulting frequency (Kanazawa et al., Reference Kanazawa, Teshima, Tokiwa and Ceccaldi1979; D’abramo and Sheen, Reference D’abramo and Sheen1993; Xu et al., Reference Xu, Ji, Castell and O’dar1994; Merican and Shim, Reference Merican and Shim1996). Linoleic acid, an essential fatty acid, is metabolised into dihomo-γ-linolenic acid, which contributes to the composition of neuronal membrane phospholipids and is a substrate for the formation of prostaglandins, which appears to be important for preserving nerve blood flow, indicating an active mode of neuro-endocrine signalling during this stage. The presence of arachidonic acid metabolism in premoult stages is believed to regulate ecdysteroidogenesis, as demonstrated in the freshwater crab Oziotelphusa senex senex and the giant mud crab Scylla serrata, where in-vivo amino acid injections significantly increased the ecdysteroid levels in their haemolymph (Swetha et al., Reference Swetha, Girish, Hemalatha and Reddy2020). 3) Chitosan biosynthesis, amino sugar and nucleotide sugar metabolism were observed at the postmoult stage. Chitin is the structural component of the extracellular matrices, including the cuticle of the exoskeleton in crustaceans (Liu et al., Reference Liu, Zhang and Zhu2019). This metabolic pathway at the postmoult stage in G. hesperiae could reflect post-ecdysis recuperation. In the postmoult stage, the lipoic acid was found circulating in the haemolymph of G. hesperiae. According to previous reports, the moulting frequency of crustaceans is associated with the synthesis of eicosanoids derived from PUFA (Rowley et al., Reference Rowley, Knight, Lloyd-evans, Holland and Vickers1995; Castell and Covey, Reference Castell and Covey1976).
Inositol phosphate metabolism and histidine metabolism are found in both intermoult and premoult stages in G. hesperiae. Inositol phosphate metabolism plays a potential role in energy metabolism (Chatree et al., Reference Chatree, Thongmaen, Tantivejkul, Sitticharoon and Vucenik2020). Histidine acts as an active site for enzymes in metabolic pathways and functions as an antioxidant (Brosnan and Brosnan, Reference Brosnan and Brosnan2020). The present GC-MS analysis detects the mTOR pathway during the premoult and postmoult stages. This pathway is regulated by the moult inhibiting hormone as well as other signalling pathways, and it influences the distribution of energy and nutrients by facilitating the active synthesis of biomolecules (Cao et al., Reference Cao, Liu, Liu, Abbasi, Cai and Yao2019; Kim and Guan, Reference Kim and Guan2019; Liu and Sabatini, Reference Liu and Sabatini2020). mTOR signalling is required for the Y organ activation in the early premoult stages (Mykles and Chang, Reference Mykles and Chang2020). Metabolism related to ascorbate, aldarate, cysteine, methionine, lysine, glutathione, vitamin B6, thiamine, pyrimidine, oxidative phosphorylation, and ABC transporters was recorded at postmoult and intermoult stages of G. hesperiae. Ascorbate and aldarate pathways are substantial carbohydrate metabolic pathways that protect cells from oxidative damage resulting from aerobic metabolism and various pollutants. Ascorbic acid acts as an electron donor in enzymatic reactions such as collagen and catecholamine synthesis. Apart from its role as a vital antioxidant, ascorbic acid becomes an essential component of glycogen metabolism (Bánhegyi et al., Reference Bánhegyi, Braun, Csala, Puskás and Mandl1997). The present study detects the presence of methionine in the haemolymph of postmoult-stage G. hesperiae, similar to findings in the soft-shell crabs of P. pelagicus (Pathak et al., Reference Pathak, Shakila, Gppnn, Shalini, Arisekar, Patel, Kumar, Malini and Mayilvahnan2021). As methionine contributes to cuticle formation, soft shell/postmoult crabs tend to have higher levels of methionine (Covi et al., Reference Covi, Bader, Chang and Mykles2010).
Glutamate is present irrespective of the moult stages in P. pelagicus (Pathak et al., Reference Pathak, Shakila, Gppnn, Shalini, Arisekar, Patel, Kumar, Malini and Mayilvahnan2021), whereas in G. hesperiae, it is observed only during the intermoult and postmoult stages, as evidenced from the present study. Tyrosine was not detected in the haemolymph of G. hesperiae in any moult stage. Polyphenol oxidase in the cuticle and haemolymph converts tyrosine into quinones, linking with the side groups of other protein molecules and facilitating sclerotisation (Marc, Reference Marc2008). The non-detection of this amino acid in the haemolymph of G. hesperiae might be due to its rapid metabolism to support the sclerotisation process. The involvement of vitamin D3 in growth, antioxidant activity and moulting of larvae has been reported in the Chinese mitten crab, Eriocheir sinensis (Liu et al., Reference Liu, Wang, Bu, Lin, Li, Shi and Chen2021). In G. hesperiae, vitamin B6, a critical molecule for cellular metabolism, plays a role in both chitin formation and exoskeleton calcification during the post-ecdysis stage, similar to its function in the blue crab C. sapidus (Roer and Dillaman, Reference Roer and Dillaman2018). Pyrimidine metabolism participates in the synthesis of DNA, RNA, lipids, and carbohydrates (Garavito et al., Reference Garavito, Narváez-ortiz and Zimmermann2015). Oxidative phosphorylation generates most of the ATP, which is essential for maintaining homeostasis (Wilson, Reference Wilson2017). ATP-binding cassette transporters constitute a superfamily of integral membrane proteins that translocate various substrates across membranes (Rees et al., Reference Rees, Johnson and Lewinson2009).
The intermoult stage revealed the presence of the cellular non-homologous DNA end-joining pathway, as it involved proteins such as Ku, XRCC4, and ligase IV. The pentose phosphate pathway was also present, indicated by the detection of the presence of NADPH, ribose-5-phosphate and glyceraldehyde-3-phosphate. The enzymes belong to the superfamily NUDT (Nudix), responsible for the hydrolysis of the phosphodiester bond in nucleotide triphosphates, diphosphates, and nucleotide sugars, and are involved in diverse pathways. Polyprenol pyrophosphate is involved in the synthesis of diverse vital molecules such as cholesterol, ubiquinone, and dolichols, and it also serves as a substrate for prenylation of proteins (Verdaguer et al., Reference Verdaguer, Crispim, Hernández and Katzin2022).
Conclusion
GC-MS analysis was used to determine the haemolymph metabolite profile of the male fiddler crab, G. hesperiae. The data revealed several important pieces of information. i) The haemolymph contains a variety of metabolites essential for successful moulting, including monosaccharides, polysaccharide, amino acids, fatty acids and their derivatives/metabolites, phenols, benzenoids, alcohols, aldehydes, keto acids, organic and inorganic acids/compounds, vitamins, and other metabolites. ii) Moulting intensely affects the metabolite composition of the haemolymph, as demonstrated by the bi-plot analysis, which showed a substantial association of metabolites with each moult stage. Other relevant information from the study includes: i) The premoult stage might be characterised by the depletion of stable metabolites (mono/poly-saccharide/s, amino acids, and fatty acids), which are consumed for energy metabolism, chitin synthesis, oxidative stress, and calcium absorption, ii) the postmoult is assumed to be a critical period of highly active metabolism by substantial build-up of unstable metabolic intermediates in the metabolism of fatty acids, amino acids (glycine/serine/threonine), carbohydrates, vitamins, nucleotide/nucleoside/their derivatives/metabolites and the biosynthesis of chitosan, iii) the intermoult stage serve as a preparative period for the synthesis of primary metabolites. The presence of MF, a key molecule of crustacean moult and reproduction, invites further attention to the coordinating role of this endocrine factor in regulating moult and reproduction of male fiddler crabs. Overall, this present study makes a significant contribution to crustacean physiology by presenting the first metabolomic blueprint of haemolymph across the moult stages in male G. hesperiae, thereby bridging a major knowledge gap and establishing foundational data essential for future biomarker discovery, endocrinological studies, and ecological monitoring. Since, in crustaceans, moult and reproduction are two integral phenomena in their metabolism, and they inhabit diverse habitats and exhibit diverse patterns of moult and reproduction, future studies need to consider both functions together to get a better understanding of the specific way crustacean metabolite distribution meets these high-energy-demanding physiological processes.
Supplementary material
The supplementary material for this article can be found at https://doi.org/10.1017/S002531542610160X.
Acknowledgements
The authors acknowledge the Central University of Kerala, Kasaragod, for the research fellowship awarded to A.N.
Authors contributions
A.N.: Samples collection, carrying out study, data analysis, writing – original draft. T.A.J.P.: Conceptualisation, designing the study, review and editing. S.K.: Conceptualisation, review and editing, finalisation, project administration, funding acquisition.
Declaration of interest
The authors declare none.
Data availability statement
All the data are included in the manuscript.
Ethics and approach
The care and use of animals for the experiments were in accordance with all applicable Institutional ethical regulations and permission (CUK/IAEC/01/2019 dated October 10, 2019).
Funding statement
The financial supports for this study received from DST-SERB project (No. EMR/2016/001163/AS, 28.08. 2017); DST-RFBR project (No. INT/RUS/RFBR/P-330, 10.01.2019); DST-JSPS project (No. DST INT JSPS P-316 2020, dated July 30, 2021); DST WOS-A (No. SR/WOS-A/LS-78/2018 (G), 28.06.2019); and Kerala State Council for Science, Technology, and Environment, Government of Kerala (KSCSTE/5224/2017- SRSLS dated 28.8.2018), are gratefully acknowledged.