

Attempts to increase women's participation and representation in political systems since the early 1990s have brought renewed interest to questions of the role of women in politics both in terms of political engagement (Kittilson and Schwindt-Bayer Reference Kittilson and Schwindt-Bayer2012) and political representation (Krook, Lovenduski, and Squires Reference Krook, Lovenduski and Squires2009), which has produced a rich body of research on the impact of female stereotypes (Atkeson and Carillo Reference Atkeson and Carillo2007; Campbell, Childs, and Lovenduski Reference Campbell, Childs and Lovenduski2010; Desposato and Norrander Reference Desposato and Norrander2009; Matland Reference Matland1994; Rudman and Kilianski Reference Rudman and Kilianski2000). Using a novel experimental survey design, we investigate the question of how female candidates affect perceptions of election fraud. The average treatment effects of our experiment demonstrate that the presence of a female candidate systematically reduces the likelihood that individuals suspect a fraudulent election. After examining the average treatment effects, we delve deeper into our survey experiment to investigate how gendered perceptions of fraud vary across respondents depending on their party identification and gender. We find that while respondents, on average, are less likely to express strong suspicions of fraud in the presence of a female candidate, the findings are strongest among individuals who do not share a partisan connection with the candidate in question and among male respondents.
These findings have several implications for women running for office, both where immediate questions of election fraud are concerned, and also in the context of broader concerns about political corruption and trust in government. In particular, this research implies that women running for election in districts where fraud is a concern may actually be advantaged at the polls. In countries where fraud and corruption are perpetual concerns, the presence of female candidates and/or female office holders may work to increase confidence in elections and trust in the government in general. What's more, given that we find the presence of a female candidate is particularly effective at reducing fraud suspicions among noncopartisans, our findings suggest that female candidates and office-holders may be particularly effective at engendering trust among members of the opposition. Finally, however, the differential reactions to female candidates we observe across male and female respondents suggest that female candidates may not always have the ability to reduce concerns about corruption, particularly as female leadership becomes normalized.
GENDER STEREOTYPES, CORRUPTION, AND PERCEPTIONS OF FEMALE POLITICIANS
A large body of research suggests that voters employ gender stereotypes when evaluating female politicians. In particular, research demonstrates that stereotypes inform voters' evaluations of politicians' personalities such that women are typically viewed as being more ethical, honest, companionate, and generally concerned with people's welfare. By comparison, men are viewed as strong leaders, assertive, self-confident, and capable of effectively handling crises (Alexander and Andersen Reference Alexander and Anderson1993; Burrell Reference Burrell1994, Reference Burrell2008; Huddy and Terkildsen Reference Huddy and Terkilsen1993a; Kahn Reference Kahn1996; King and Matland Reference King and Matland2003; Lawless Reference Lawless2004; Leeper Reference Leeper1991; Paul and Smith Reference Paul and Smith2008; Rosenwasser and Dean Reference Rosenwasser and Dean1989; Sapiro Reference Sapiro1981). Voters use stereotypes in similar ways to appraise politicians' policy competencies. Women are generally presumed to be more interested in, and more competent at handling, issues such as education, health care, child care, women's issues, and the environment; conversely, men are thought to be better handling the economy, security issues, foreign affairs, and agriculture (Alexander and Andersen Reference Alexander and Anderson1993; Brown, Heighberger, and Shocket Reference Brown, Heighberger and Shocket1993; Dolan Reference Dolan2010; Huddy and Terkildsen Reference Huddy and Terkilsen1993a, Reference Huddy and Terkilsen1993b; Koch Reference Koch1999; Rosenwasser and Dean Reference Rosenwasser and Dean1989; Sapiro Reference Sapiro1981).
These stereotypes are believed to inform voters' evaluation of female candidates (Fox and Smith Reference Fox and Smith1998; Huddy and Terkildsen Reference Huddy and Terkilsen1993b; Lawless Reference Lawless2004; Sanbonmatsu Reference Sanbonmatsu2002), assessments of female office holders, and even perceptions of governments that host sizable proportions of female officials (Lawless Reference Lawless2004; Schwindt-Bayer Reference Schwindt-Bayer2010; Schwindt-Bayer and Mishler Reference Schwindt-Bayer and Mishler2005). Finally, these stereotypes have been perpetuated by biased, differential media coverage of male and female politicians (Carroll and Schrieber Reference Carroll, Schrieber and Norris1997; Devitt Reference Devitt1999; Jalalzai Reference Jalalzai2006; Kahn Reference Kahn1996). Such coverage often accentuates traditional gender stereotypes (Kittilson and Fridkin Reference Kittilson and Fridkin2008) and influences the range of issues covered (Atkeson and Krebs Reference Atkeson and Krebs2008). Recent research indicates that these trends in media perpetuation of feminine stereotypes are becoming less pronounced over time (Bystrom, Robertson, and Banwart Reference Bystrom, Robertson and Banwart2001; Jalalzai Reference Jalalzai2006); nonetheless, biased news coverage of candidates has likely contributed to the prevailing wisdom that women are more trustworthy and ethical than men.
While it is often assumed that gender stereotypes hurt women, previous research has not provided a clear consensus on whether stereotypes will consistently advantage or disadvantage female politicians. For example, stereotypes about leadership abilities may hinder women at the polls, but stereotypes about ethics may ultimately help them. Similarly, stereotypes about policy competencies may affect the fates of female candidates differently depending on voters' priorities. Those who prioritize issues such as education, healthcare, or women's issues, for example, may give preference to female candidates; meanwhile, voters who are primarily concerned with issues such as security, agriculture, or the economy may favor male candidates. In this research, we provide evidence of one such circumstance where gender stereotypes may actually help female candidates.
Linking Corruption and Gender
This research contributes to the literature on perceptions of corruption. Both observational and experimental research has found associations between knowledge of corruption scandals and reduced trust in government, with contextual factors such as scandal-saturation and number of parties involved affecting perceptions (Kumlin and Esaiasson Reference Kumlin and Esaiasson2012). Anduiza, Gallego, and Munoz (Reference Anduiza, Gallego and Muñoz2013) find in their recent experimental study that individual partisan identities also shape peoples' perceptions of corruption. Building on extant research on gender stereotypes, we posit that the gender of the political elites involved is another contextual factor that could affect individuals' evaluations of corruption.
This claim is consistent with both scholarly research and the behaviors of political elites with respect to women and corruption. Scholars report aggregate-level findings from cross-national analyses that higher proportions of female representatives are correlated with lower levels of perceived corruption (Dollar, Fisman, and Gatti Reference Dollar, Fisman and Gatti2001; Swamy, Lee, and Azfar Reference Swamy, Knack, Lee and Azfar2001; Transparency International 2011). By appointing women to leadership positions, leaders often believe they can help craft an image that a government, party, or institution is trustworthy, transparent, and ethical (Goetz Reference Goetz2007). For example, in Peru in 2000 President Alberto Fujimori and the Peruvian National Police began recruiting more women because officials perceived female officers as less likely to accept bribes (Goetz Reference Goetz2007). Similarly, Schwindt-Bayer explains that a woman was elected as the interim president of the senate in Colombia in an effort to “restore integrity to the Senate” after a corruption scandal involving a male politician (Reference Schwindt-Bayer2010, 171). In Uganda, women are frequently appointed as treasurers to local governments with the hope they will reduce misspending, and they are often tapped to lead commissions assigned to investigate corruption in the police force (Goetz Reference Goetz2007; Tripp Reference Tripp2001).
If political elites are speculating that females in power will promote an image of honesty and integrity, these hopes are, no doubt, grounded in the existing stereotypes about women discussed above. But there are two other potential reasons why women might be seen as providing a “solution” to corruption. First, studies have found women to be more risk-averse (Jianakoplos and Bernasek Reference Jianakoplos and Bernasek1998; Watson and McNaughton Reference Watson and McNaughton2007), suggesting that they are less likely to engage in unethical, fraudulent, or corrupt practices for fear of being caught.Footnote 1 Second, women are often perceived as political “outsiders”: U.S. elections in 1992, for example, saw record numbers of women elected, and while observers have noted a particular confluence of open seats and women's issues in that election, several scholars have argued that female candidates' outsider status likely played a role as well. Dolan (Reference Dolan1998) argues that this election saw a great deal of attention paid to the “problems of incumbents” (281). Noting women's status as “ultimate political outsiders” Delli Carpini and Fuchs (Reference Delli Carpini and Fuchs1993) ask, who was in a better position than female candidates to “clean the House” in the 1992 elections (34)? At the individual level, Dolan finds those who reported lower levels of congressional approval in 1992 were more likely to vote for female candidates (277).
Preferences for female candidates are more likely to be activated in low-information elections (Erickson and Black Reference Erickson and Black2001; Frederick and Streb Reference Frederick and Streb2008; McDermott Reference McDermott1997, Reference McDermott1998). McDermott (Reference McDermott1998), for example, uses survey experiments to demonstrate the candidate gender can provide “information cues to voters” when other means of evaluating candidates are not available (897). Specifically, she argues that women are stereotyped as being more liberal, compassionate, and trustworthy than men. Therefore female candidates should be preferred over male candidates by liberal voters, and those who prioritize particular issues such as ethics in government, in low-information electoral settings (900). Frederick and Streb (Reference Frederick and Streb2008) examine the success of female candidates in one class of low-information elections: judicial elections to intermediate-level court seats. They find that female candidates perform as well, if not better, than their male counterparts and posit that stereotypes of women as more ethical and impartial might account for the patterns they observe (951). In low-information settings, stereotypes of female candidates are more likely to influence election outcomes where electoral institutions allow voters to select candidates directly (Schwindt-Bayer, Malecki, and Crisp Reference Schwindt-Bayer, Malecki and Crisp2010; Valdini Reference Valdini2012, Reference Valdini2013b).
Reduced Concerns about Corruption: Causation or Correlation?
The literature clearly demonstrates that (1) female political elites are often seen as a solution to political corruption, likely because (2) women are perceived as more ethical and less likely to engage in corruption. Taken together, then, one might infer that women's presence in elite political positions should lead to higher levels of trust and decreased perceptions of corruption among government officials. Some recent research has tried to make this connection, showing, for example that more women are elected into office after a corruption scandal (Valdini Reference Valdini2013a), but this literature has not been able to establish a clear causal relationship between women's representation or women's involvement in politics and reduced concerns about corruption.Footnote 2 Generally speaking, we know that citizens are likely to feel better about their government and congress (Lawless Reference Lawless2004; Mansbridge Reference Mansbridge1999) and are more trusting of local government (Ulbig Reference Ulbig2007) when women are included in positions of power. In such studies, however, it is difficult to know whether females in power are the cause or the consequence of more trust in government, or whether female representation and trust are both caused by some other underlying condition. Schwindt-Bayer (Reference Schwindt-Bayer2010), for example, finds in survey data from 17 Latin American countries that higher levels of women's numeric representation are associated with higher levels of trust and decreased perceptions of corruption in political institutions in Latin America, but she theorizes that more representative democracies send signals of inclusiveness to citizens, which both increases female representation and engenders trust in political institutions (Schwindt-Bayer Reference Schwindt-Bayer2010; Schwindt-Bayer and Mishler Reference Schwindt-Bayer and Mishler2005).
This literature suggests two concrete implications for elections and democratic legitimacy. First, under certain circumstances—specifically those where corruption is a concern—women may benefit in elections; and second, institutions as a whole may be viewed as more legitimate when they include more women. While there are strong theoretical reasons to believe this causal relationship exists, extant research using observational data is limited in its ability to establish a causal link between women's involvement in politics and reduced concerns about corruption. To address this lacuna in the literature, we design a survey experiment that allows us to isolate the relationship between the presence of a female candidate and perceptions of election fraud. In doing so, we offer a direct test of the previously assumed relationship with our gender cue hypothesis:
H1: The presence of a female candidate will reduce suspicions of fraud.
TESTING THE GENDER CUE HYPOTHESIS: A SURVEY EXPERIMENT
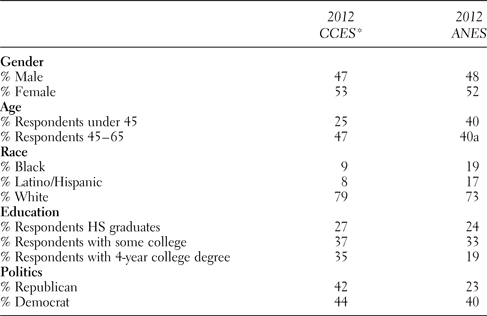
After the 2012 election, 843 individuals responded to a question that asked about their perceptions of election fraud as part of the follow-up Cooperative Congressional Election Study (CCES) administered by YouGov Polimetrix. The CCES uses an Internet-based survey platform, drawing a matched sample from a pool of Internet users to approximate a nationally representative sample obtained through random-digit dialing (Gerber and Huber Reference Gerber and Huber2010). Research that has used data from the CCES in the past has reported its sample to be consistent with other national surveys, particularly where party identification and ideology are concerned (Ansolabehere and Persily Reference Ansolabehere and Persily2007). A review of this particular sample suggests it indeed aligns with the U.S. population more broadly; Table 1 provides descriptive statistics for the sample and shows how it compares to the 2012 American National Election Study (ANES).
Comparison of descriptive statistics

*For the 843 respondents who participated in our survey experiment
To measure the impact of candidate gender on perceptions of corruption, we constructed a survey experiment with a 2− × −3 treatment design. To enhance the external validity of the experiment, all respondents received information that in the 2012 U.S. House election there were rumors of community organizations registering ineligible voters in another state and that the candidate who had been trailing in public opinion polls came from behind to win. Respondents were then asked, “How likely do you think it is that fraud was committed in this case?” Suspicions of fraud were measured on a 4-point Likert scale, ranging from “very likely” to “very unlikely.” This scenario was seen as particularly realistic based on recent research showing the extensive media coverage of voter registration scandals and because previous research has found individuals are particularly concerned about this type of fraud (Ansolabehere and Persily Reference Ansolabehere and Persily2007; Beaulieu Reference Beaulieu2013; Drier and Martin Reference Drier and Martin2010; Minnite Reference Minnite2010). We should note that the scenario presented to respondents emphasized a type of election fraud that has been associated with Democrats—and criticized by Republicans—in recent elections (Beaulieu Reference Beaulieu2013; Drier and Martin Reference Drier and Martin2010). Therefore, in this scenario we expect respondents to be more likely to suspect Democratic candidates of fraud.
The 2− × −3 treatment design indicates that two aspects of the survey question were varied at random, with two possible group assignments for the first treatment and three for the second. First, the survey question varied the partisan identity of the candidate, with approximately one-half of respondents (selected at random) told that a Democratic candidate had come from behind to win, while the other half was told that the candidate was Republican. The randomization of candidate party was included because partisanship has been shown to influence perceptions of corruption and fraud (Alvarez et al. Reference Alvarez, Atkeson, Hall and Sinclair2011; Anduiza, Gallego, and Muñoz Reference Anduiza, Gallego and Muñoz2013; Beaulieu Reference Beaulieu2013) and because scholars have argued that gender stereotypes should transcend the partisan divide (Sanbonmatsu and Dolan Reference Sanbonmatsu and Dolan2009). Thus, randomizing the candidate's partisanship in this experiment allows us to make sure that the impact of gender cues on perceptions of corruption are not being conflated with the impact of partisanship, while also investigating the impact of gender cues across both parties.
Second, respondents were randomly assigned to one of three groups varying the gender of the candidate, with one-third of respondents (randomly selected) asked about a female candidate (“although she had been trailing in public opinion polls …”), another third asked about a male candidate (“although he had been trailing in public opinion polls …”), and a control group receiving no information about candidate gender (“the [Democratic/Republican] candidate who had been trailing in public opinion polls …”). Figure A1 in the Appendix shows an example of what a respondent would have seen who received the Democrat treatment for candidate's party and the female treatment for gender cue.
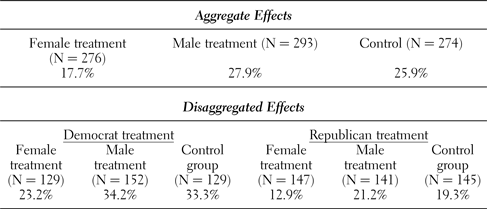
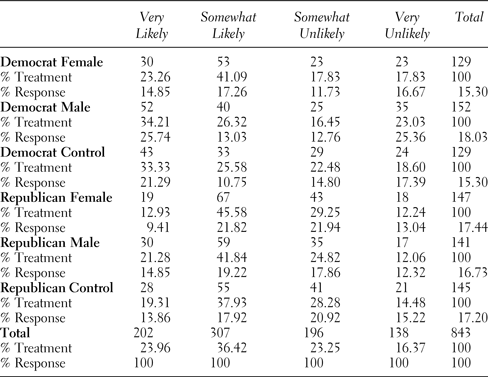
Table 2 shows the average treatment effects on respondents' perceptions that fraud was very likely in the scenario they read: first across the three groups associated with the gender treatment and then disaggregated across all six treatment groups to include the partisan treatment. These results are further disaggregated across the full range of response options in Table A1 in the Appendix. When we consider whether respondents found fraud very likely in their scenario, we observe three interesting patterns across the different treatment groups.
Percentage of respondents who found fraud very likely by treatment
Notes: Chi2 test for Aggregate Effects significant at p < 0.05; Chi2 test for Disaggregated Effects significant at p < 0.001
First, female candidates produce significantly less suspicion that fraud is very likely. Approximately 18% of respondents found fraud very likely in scenarios involving a female candidate, compared to 28% of those who received a male candidate and 26% of those with no information about candidate gender. This amounts to an 8%–10% reduction in suspicion that fraud is very likely when the candidate in the scenario is identified as a female. The same pattern holds when we look at the disaggregated effects, which account for the partisan treatment. A female Democrat reduced suspicions that fraud was very likely by just under 10% compared to the control group and 11% compared to the male Democratic candidate. A female Republican reduced suspicions that fraud was very likely by nearly 7% compared to the control and just over 8% compared to the male Republican candidate. Thus, we find support for the gender cue hypothesis, H 1, that female candidates reduce the strongest suspicions of election fraud.
Second, focusing on the disaggregated results, we see that all of the Democratic treatment groups generated higher suspicions of fraud compared to the Republican treatment groups. While somewhere between one-quarter and one-third of those presented with a Democratic candidate suspected fraud to be very likely, rates of suspicion of Republican candidates ranged from slightly more than 10% to slightly more than 20% of respondents. This result is consistent with our expectations, given the type of fraud portrayed in the scenario. However, we do not expect that this effect is generalizable beyond this particular scenario, as other research has shown different fraud concerns (such as voter suppression) heighten suspicion of Republican candidates, and some potential fraud concerns (such as tampering with electronic ballots) do not activate any partisan suspicions (Beaulieu Reference Beaulieu2013).
The third important feature to note is the close rates of response between individuals receiving the male treatment and those in the control group. This close correspondence of fraud perceptions between those who received explicit information that the candidate was male and those who received no information, in light of the substantial difference compared to female candidates, suggests that when individuals receive no information about a candidate's gender, they tend to assume the candidate is male. This finding makes sense for at least two reasons. One, despite gains in women's representation in recent decades, the U.S. political system still remains a male-dominated field, particularly at the national level. Two, research has found that people tend to assign masculine traits to individuals who work in male-dominated fields (Cejka and Eagly Reference Cejka and Eagly1999). Moreover, this finding lends support to the notion that voters view women as political outsiders, and because they are political outsiders they may be less likely to be involved in political corruption.
Finally, it is important to note that, when we include respondents who found fraud somewhat likely with those who found fraud to be very likely (see Appendix), the differences in average treatment effect are smaller, no longer follow clear partisan or gendered patterns, and do not retain statistical significance.Footnote 3 This change is not surprising for the gender treatment, as we would not expect a candidate's gender to definitively shape whether a respondent perceived fraud in a given scenario. Rather, we think of gender cues as playing a subtler role in dampening or reinforcing existing beliefs.
ACCOUNTING FOR HETEROGENEOUS EFFECTS
Given the randomized nature of the survey experiment on a representative sample of the population, we can be confident that the treatment effects reported in Table 1 reflect the impact of female candidates on strong suspicions of election fraud in the general population. However, we can also use the information gained in the survey experiment to investigate whether particular groups of citizens within the population are likely to react differently to gender cues. Since recent work has highlighted the importance of partisan identity in shaping perceptions of corruption (Anduiza, Gallego, and Muñoz Reference Anduiza, Gallego and Muñoz2013; Beaulieu Reference Beaulieu2013), we might wonder whether our results are robust within the subset of the population with partisan attachments. Following Beaulieu (Reference Beaulieu2013), we expect individuals with a partisan identity to be far less concerned about fraud when the candidate who benefits shares their partisanship, regardless of the candidate's gender.Footnote 4 Thus, it is only in circumstances where individuals are presented with candidates from the opposing party that gender stereotypes should work to improve perceptions of fraud.
H2: Female candidates will reduce suspicions of fraud when the candidate and respondent do not have shared partisanship, but will not reduce suspicions of fraud among copartisans.
The next question we can ask is whether respondents' gender influences the extent to which female candidates improve fraud perceptions. Based on research finding that female representation has a differential impact on women's perceptions of political efficacy and political participation (Atkeson and Carillo Reference Atkeson and Carillo2007; Barnes and Burchard Reference Barnes and Burchard2013), we expect male and female respondents to be affected differently by candidate gender cues. Furthermore, research from social psychology and organizational science has documented a gendered shift in the relevance of stereotypes when evaluating individuals in leadership positions. It used to be the case (in the 1970s and 1980s) that when tasked with identifying the qualities they associated with three groups of individuals—leaders, men, and women—both male and female respondents would select qualities that were similar for leaders and men, and different from the qualities they selected for women (Powell and Butterfield Reference Powell and Butterfield1989; Schein Reference Schein1973, Reference Schein1975). Since the 1990s, however, replication of these studies has found that women have begun to associate leadership as much with female qualities as with male qualities. Male respondents, however, have not changed and continue to employ gender stereotypes when evaluating women in historically masculine domains (Deal and Stevenson Reference Deal and Stevenson1998; Norris and Wylie Reference Norris and Wylie1995). As such, we might expect men to rely more on traditional female stereotypes when evaluating a female candidate, compared to women.
H3: Female candidates will reduce suspicions of fraud among men but not women.
Modeling Strategy
To further investigate the potentially heterogeneous effects of gender cues we develop a multivariate analysis that allows us to control for important characteristics of the respondent and the hypothetical candidate that may influence perceptions of fraud. We use logistic regression to evaluate the likelihood that respondents with certain characteristics have a strong suspicion of fraud.Footnote 5 Accordingly, based on the patterns revealed in our comparison of average treatment effects, our dependent variable is coded 1 for individuals who report that fraud is very likely and 0 otherwise. We begin by developing a Baseline Model that includes measures to account for treatment effects, partisan influences, and individual demographics. We then construct an interactive model to test the proceeding conditional hypotheses.
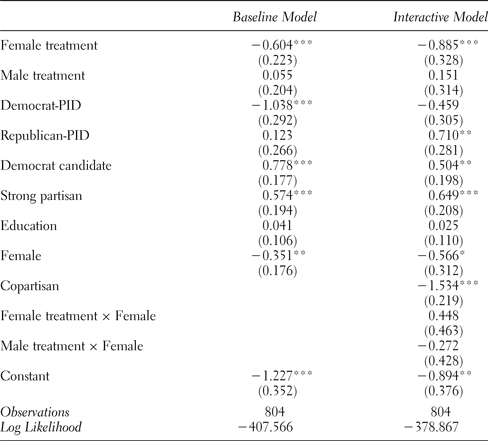
To distinguish between the effects of female and male treatments, we include two dummy variables. The first indicates if the respondent received a female treatment, which is coded 1 for Female treatment and 0 otherwise. The second dummy variable indicates if the respondent received a male treatment; again, it is coded 1 for Male treatment and 0 otherwise. The control group serves as the reference category.Footnote 6 In addition, our survey experiment varied the political party of the hypothetical candidate. As such, we include a dummy variable—Democrat candidate—that is coded 1 for Democrat and 0 for Republican to examine how the partisan affiliation of the candidate shapes fraud perceptions for the scenario employed in this survey.Footnote 7 We include two dummy variables to indicate if the respondent identifies as a Democrat or Republican. Each of these variables is coded 1 for respective partisans and 0 otherwise. Here, independents serve as the reference category.Footnote 8 We include a measure for strength of partisan identification; Strong partisan is measured using a dummy variable and is coded 1 for respondents who strongly identify as a Republican (6) or Democrat (0) on a seven-point Likert scale (ranging from 0 to 6) and 0 otherwise.Footnote 9 Third, we include a number of demographic variables. Specifically, we control for respondent sex and education. Sex is labeled Female and coded 1 for females and 0 for males.Footnote 10Education is a categorical variable coded 0 for no high school degree, 1 a high school degree, 2 for some college, 3 for a 2-year degree, 4 for a bachelor's degree, and 5 for a post-graduate degree.Footnote 11 The logistic regression results for the Baseline Model are reported in Table 3 in the first column.Footnote 12
Probability of responding fraud is very likely
Notes: The dependent variable is coded 1 if respondents indicate that fraud is very likely and 0 otherwise. The baseline category is a Republican candidate with no gender specification.
Standard errors in parentheses: *p < .10, **p < .05, ***p < .01
Finally, the Interactive Model builds on the Baseline Model by including three additional variables. To test the partisan hypothesis, H 2, we include a variable that indicates whether the respondent and hypothetical candidates are copartisans. Copartisan is coded 1 for respondents who share the partisan identity with the hypothetical candidate and 0 otherwise. This allows us to evaluate how gender affects fraud perceptions in the absence of shared partisanship.Footnote 13 To evaluate the respondent sex hypothesis, H 3, we include two interaction terms that allow us to evaluate if female and male respondents are equally likely to suspect fraud. Specifically, we include one interaction for female respondents receiving the female treatment and a separate interaction for female respondents receiving the male treatment. The coefficients from the Interactive Model are reported in the second column of Table 3.
Baseline Model Results: Additional Support for the Gender Cue Hypothesis
Consistent with the results presented for the average treatment effect, the Baseline Model indicates that respondents are significantly less likely to report that fraud is very likely if they were asked about a female candidate.Footnote 14 The coefficient on female treatment is negative and statistically significant (p < .01). This indicates that respondents are less likely to perceive fraud as very likely if they receive information indicating that the candidate is a female, compared to receiving no information. Equally important, the coefficient on male treatment is not statistically different than the control group and is very small relative to the female treatment coefficient. As with our comparison of average treatment effects, there is no significant difference between the male treatment and the control group. Turning next to the partisan variables, we see that, consistent with our expectations about the Democratic bias in the treatment scenario, respondents who identify as Democrats are far less likely to perceive fraud in this scenario, and scenarios with Democratic candidates increase the probability of finding fraud very likely. Strong partisans are more likely to suspect fraud than are individuals who weakly identify with a political party, which makes sense given the fact that respondents receive a partisan treatment in this scenario. Finally, with respect to the demographic variables in our Baseline Model, the respondent's education does not appear to have any bearing on fraud perceptions. Respondent's sex, however, approaches statistical significance.
Testing the Partisan Hypothesis
It is clear from both the average treatment test and the Baseline Model that, on average, individuals respond to gender cues in predictable ways. In this section, we test the extent to which our results are robust within the subset of the population with partisan attachments. Specifically, we hypothesize that female candidates will reduce suspicions of fraud when the candidate and respondent do not have shared partisanship, but will not reduce suspicions of fraud among copartisans. A test of the partisan hypothesis, H 2, can be found in the Interactive Model in Table 3. As previously noted, we include the variable Copartisan to assess this hypothesis.
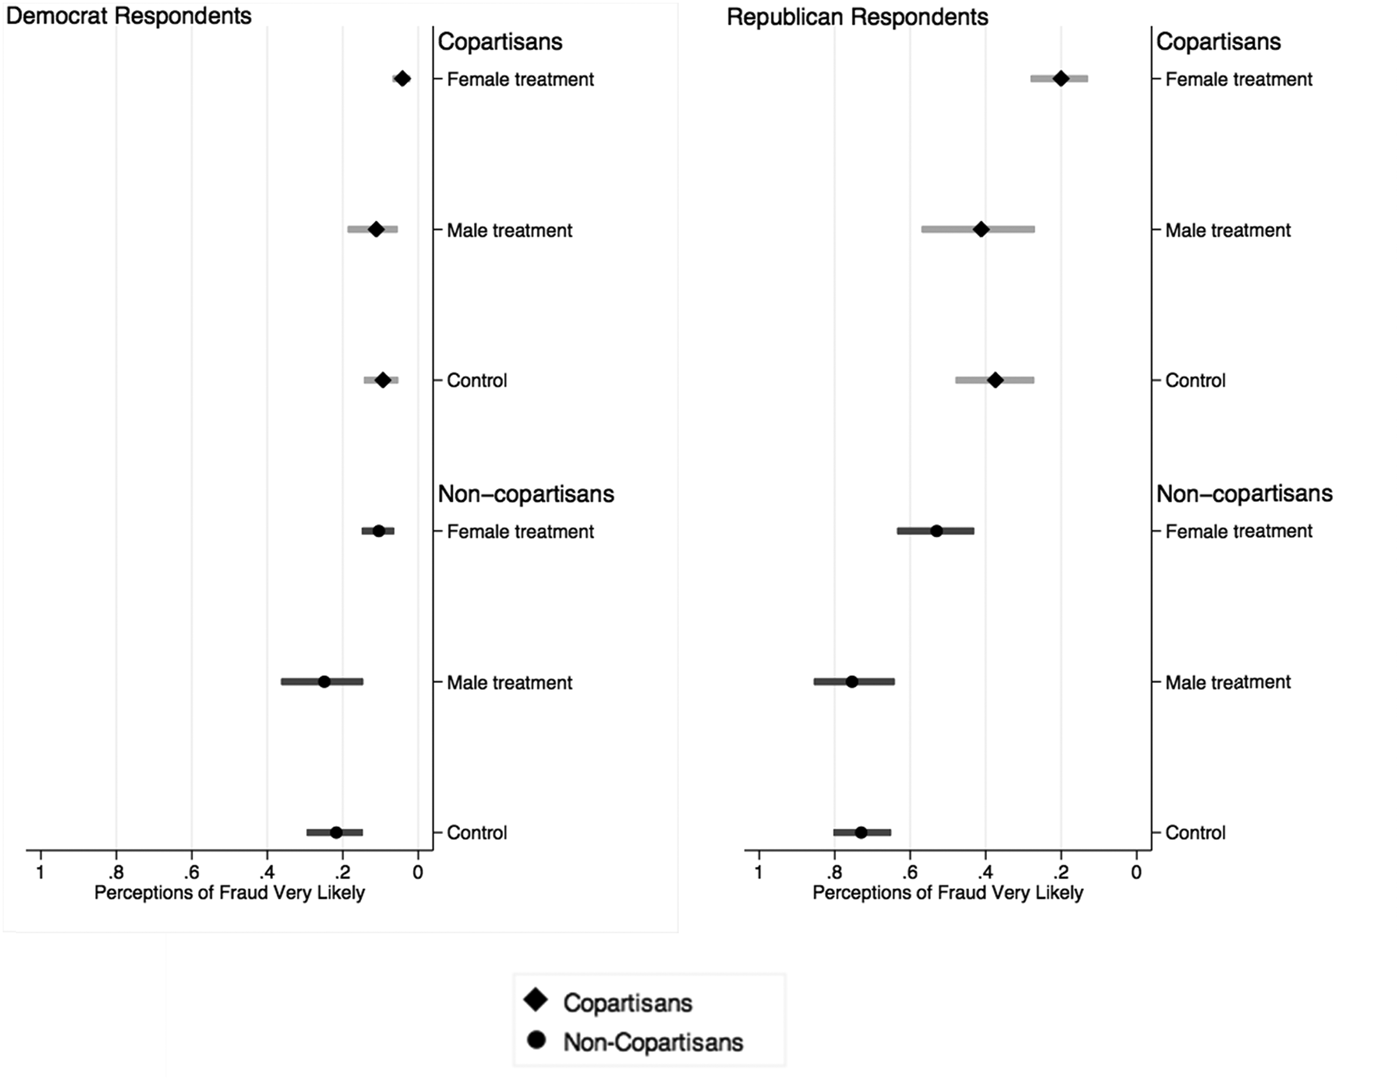
Our results indicate that when the respondent is affiliated with the same political party as the candidate (Copartisan), concerns about fraud are reduced substantially. The probability that respondents suspect fraud is very likely increases significantly when the candidate is from the opposing political party. Nevertheless, even when strong partisan cues are at work, the statistically significant, negative coefficient for female treatment indicates that receiving the female treatment still significantly reduces perceptions of fraud. To illustrate these effects we simulate coefficients and calculate predicted probabilities of a respondent reporting that fraud is very likely taking three factors into consideration: the respondent's party identification, whether the respondent received a copartisan or non-copartisan treatment, and the gender treatment received by the respondent, with all other values held constant (King, Tomz, and Wittenberg Reference King, Tomz and Wittenberg2000). Unlike the table of coefficients, this figure allows us to directly compare the probability of suspecting fraud for groups receiving the female treatment compared to those receiving the male treatment or control.
Figure 1 reports the results of these predictions with Democrat respondents in the left-hand panel, and Republican respondents on the right. As indicated by the coefficients in both models, Democratic respondents have a lower probability of strongly suspecting fraud compared to Republican respondents. Nonetheless, both Democrats and Republicans are less likely to suspect female candidates of fraud when that candidate is a non-copartisan—depicted in the lower half of each panel (Non-copartisans). Our model predicts only a 10% chance that a Democrat respondent who received a non-copartisan, female treatment would find fraud very likely compared to a 25% chance with a male treatment, and a 22% chance with the control—a statistically significant difference (at the 95% confidence level) of approximately 15% and 12%, respectively. Among Republican respondents who received a non-copartisan scenario, our model predicts a 38% chance of fraud to be very likely, compared to a 62% chance of finding fraud very likely for those who received the male treatment and a 59% chance for those who received the control, a statistically significant difference (at the 95% confidence level) from the female treatment group of 24% and 21%, respectively.
Partisan hypothesis (H 2): Predicted probability of perceiving fraud is very likely.
Taken together, the panels in Figure 1 provide strong support for the partisan hypothesis, H 2, by demonstrating that gender cues have their strongest reductive effect when the candidate in question does not share an individual's partisan identity. Furthermore, the top half of each panel shows that even among copartisans the gender cue has a reductive effect that approaches statistical significance. Democrat respondents receiving the copartisan scenario with a female treatment are predicted to have a 4% chance of finding fraud very likely, compared to an 11% chance for those who received a male copartisan, and a 9% chance for those who received a copartisan in the control group. Republican respondents receiving the copartisan female treatment are predicted to have a 12% chance of finding fraud very likely. By contrast, Republican respondents receiving the copartisan male treatment or the copartisan control have a 28% and 25% chance, respectively, of suspecting fraud to be very likely. However, none of these differences across gender treatments achieve statistical significance at 95% confidence levels, when the respondent and candidate share partisanship.
One final observation regarding Figure 1: the predicted probabilities for Republicans receiving any copartisan treatment are significantly lower than the lowest predicted probability for Republicans receiving non-copartisan scenarios (the female treatment). This pattern is consistent with our expectations for two reasons: (1) The candidate in the scenario is a Republican, but the fraud scenario is one that is largely associated with Democrat and not Republican candidates, and (2) the scenario pairs copartisans, which in itself should have a reductive effect on fraud perceptions. Thus, while the predicted probabilities generated from our logit analysis provide support for our claim that candidate gender should influence fraud perceptions, they also demonstrate that partisanship is an extremely important predictor of fraud perceptions (Beaulieu Reference Beaulieu2013).
Testing the Respondent's Sex Hypothesis
The next aim of this analysis is to evaluate the extent to which the use of gender cues transcends the gender of respondents. A test of Respondent's Sex Hypothesis can be found in the Interactive Model in the second column. The coefficients on the interaction terms Female treatment × Female and Male treatment × Female are not statistically significant. It is not, however, straightforward to interpret the effect of the interaction terms from the table of coefficients. Thus, we simulate coefficients and calculate predicted probabilities of fraud perceptions for different scenarios. To develop the full picture of how perceptions of fraud change depending on the respondent's sex, we examine male and female respondents separately across treatment groups (i.e., control, male treatment, and female treatment).
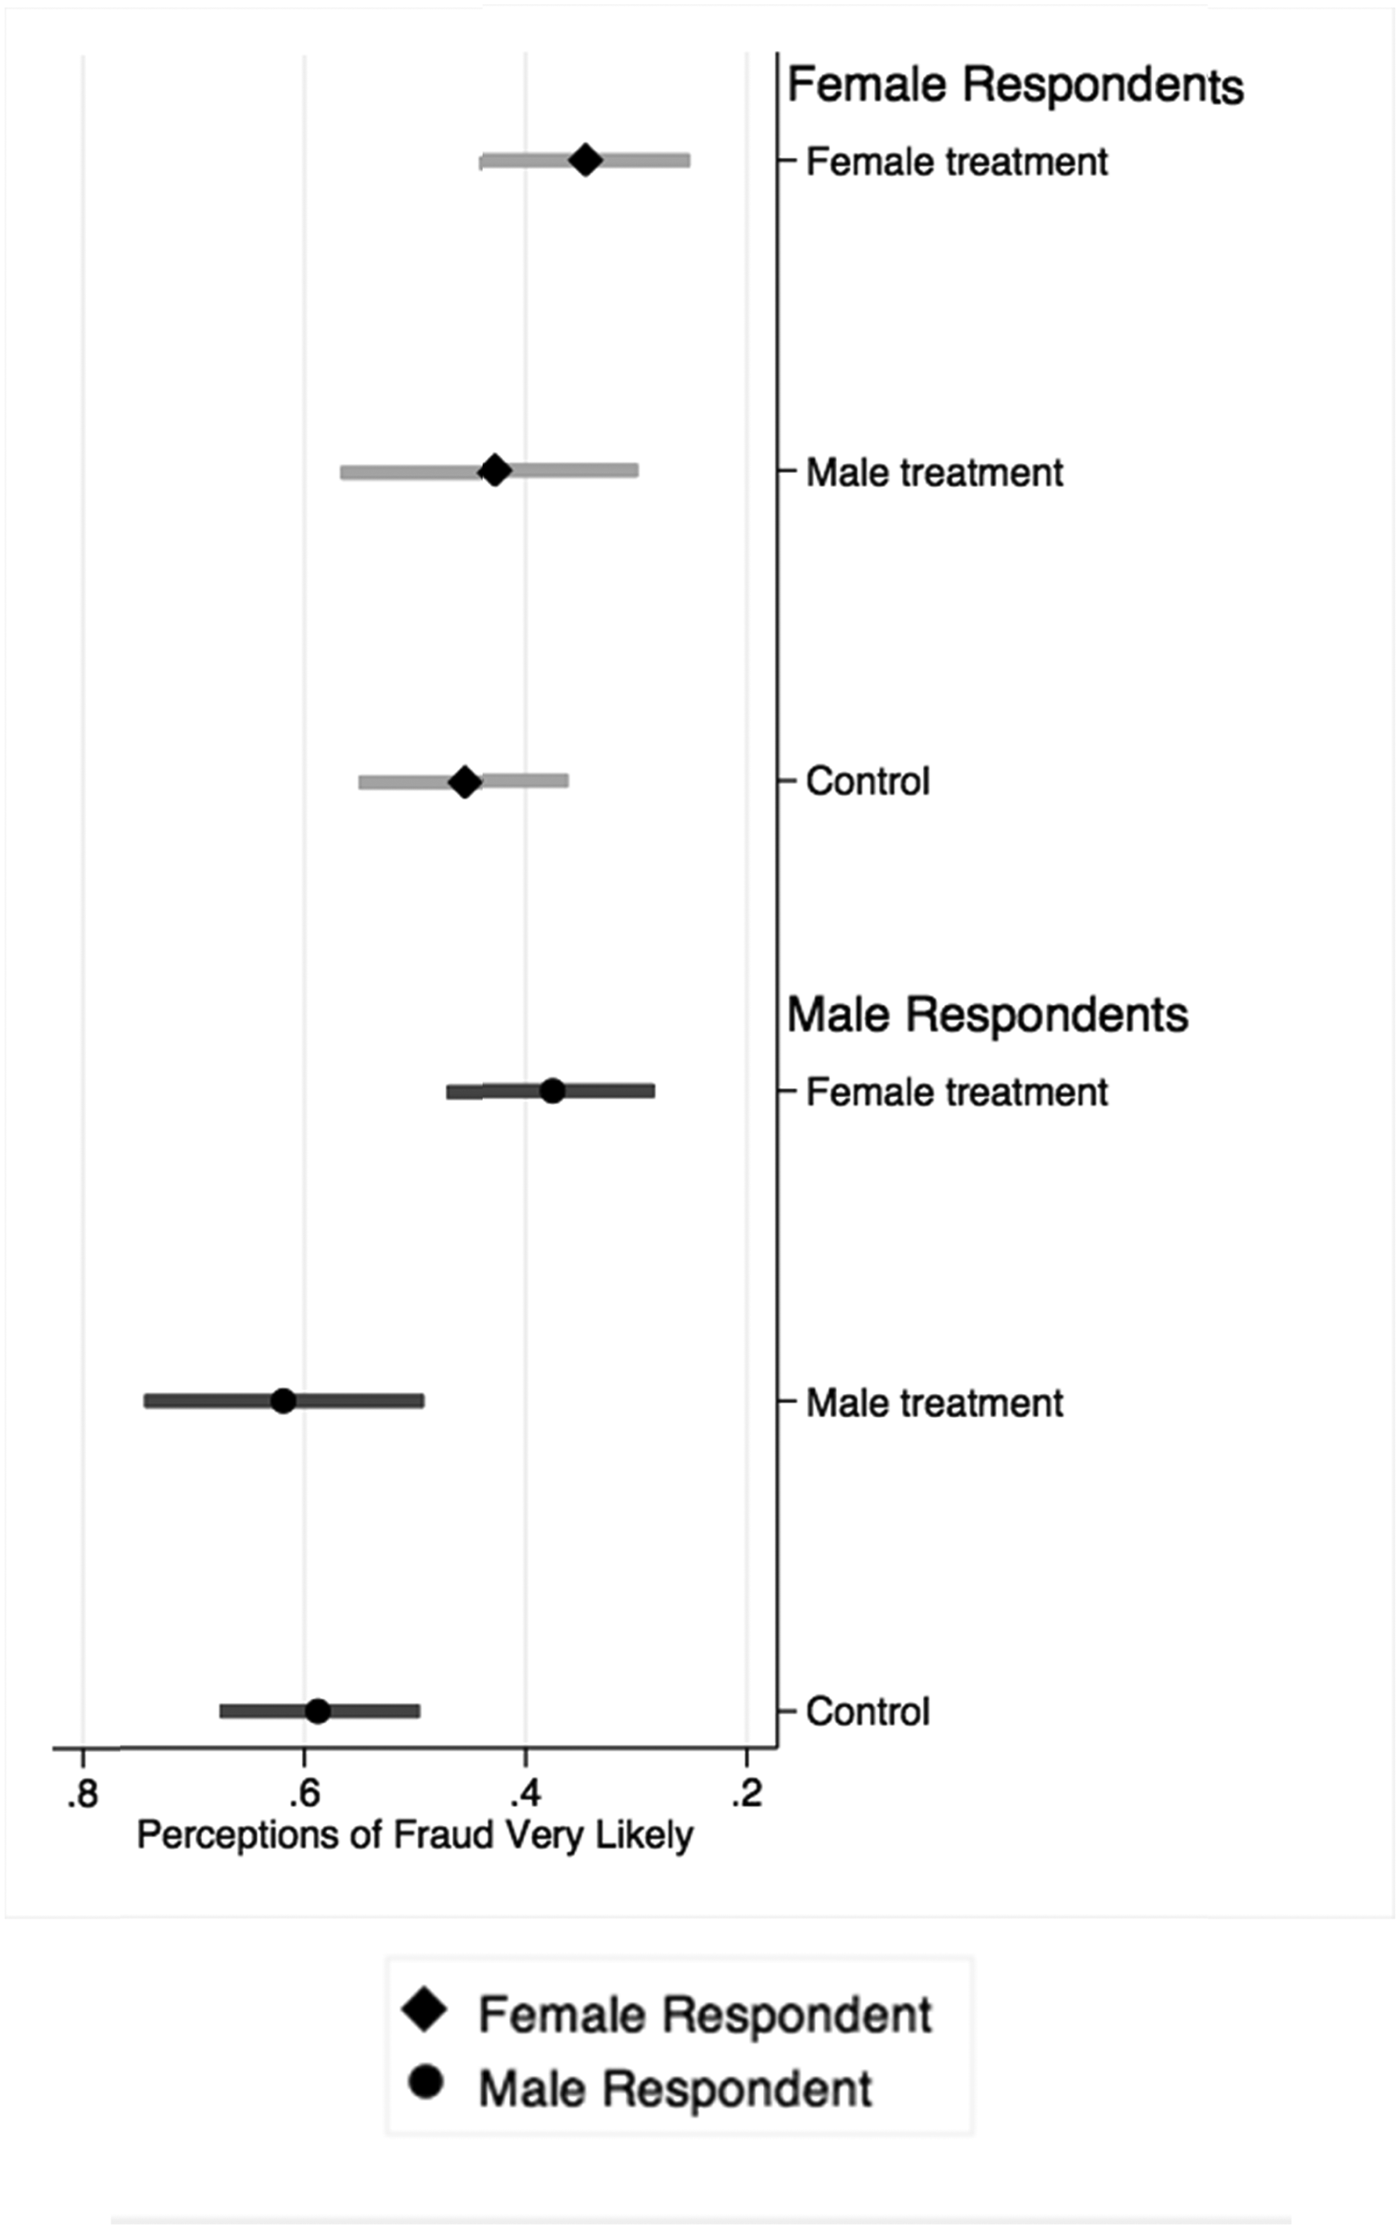
Figure 2 presents six predicted probabilities, grouped by respondent sex, and gender treatment. The top half of the figure looks at female respondents across the two treatment groups and the control group and shows differences in the predicted probability of finding fraud very likely that do not approach statistical significance. Female respondents who received the female treatment have a 34% chance of finding fraud very likely compared to a 43% chance for female respondents receiving the male treatment, and a 45% chance for female respondents in the control group. Here again, we note the lack of a meaningful difference between predictions generated from the male treatment and the control group. Even though these predictions display the patterns we would expect (female candidates reducing the probability of finding fraud very likely) the differences (8% and 11%, respectively) are not statistically significant at the 95% confidence level.
Respondent sex hypothesis (H 3): predicted probability of perceiving fraud is very likely
The bottom half of Figure 2 plots the predicted probability that a male respondent will view fraud as being very likely. Male respondents who received the female treatment are predicted to have a 37% chance of finding fraud very likely, whereas for male respondents who receive either the male treatment or the control, the chances of finding fraud very likely rise to 63% and 59%, respectively. While there is no statistically significant difference between the predicted probabilities for the male treatment and control categories among male respondents, there is a large difference between these two groups and those in the female treatment group—25% compared to the male treatment group and 22% compared to the control group. Both differences are statically significant at the 95% confidence level.
In sum, our data provide evidence that male respondents are more likely than female respondents to alter their perceptions of corruption depending on the treatment they receive. Although the same general trend is present for every respondent, the magnitude of the response varies significantly by sex. Figure 2 illustrates support for the respondent's sex hypothesis, H 3. That is, male and female respondents react differently to gender cues with respect to fraud perceptions, with men being more sensitive to the female treatment.
CONCLUSIONS
The causal connection between female candidates and fraud perceptions has been assumed by political elites, asserted by some scholars, and questioned by others. This experiment, however, allows us to establish a clear causal link between the presence of women in elite political positions and reduced concerns about corruption. The average treatment effect of our survey experiment shows that female candidates cause perceptions to improve among those with the strongest suspicions of election fraud. And while our findings indicate a clear causal connection between female candidates and reduced concerns about corruption, the heterogeneous effects we uncover show that only certain groups of individuals are responsive to such cues. Individuals' partisan attachments will still inform their thinking about fraud to a large degree, and if copartisanship has already reduced fraud concerns, the presence of a female candidate is not likely to alter opinions further. What's more, women are less likely to associate female candidates with reduced corruption compared to men.
The survey experiment in this study has demonstrated that female candidates reduce strong suspicions of election fraud, but are these results generalizable beyond this particular sample? Concerns about external validity are understandable in any experiment, though in many ways our findings are consistent with research that finds that (1) more females in political power are associated with less perceived corruption; (2) partisan attachments shape corruption perceptions; and (3) women's use of stereotyping in evaluating leadership has changed while men's has not (Schein and Mueller Reference Schein and Mueller1992; Schein et al. Reference Schein, Mueller, Lituchy and Liu1996). It seems plausible to conclude, then, that under some circumstances, for some groups of people, female candidates will improve corruption perceptions.
Our findings have multiple implications for female candidates and elected female officials. First, our results suggest that after a corruption scandal has occurred in a politically competitive district, women may have an electoral advantage. When corruption and fraud are salient factors in an election, it may activate gender stereotypes that characterize women as more honest, ethical, and trustworthy. Moreover, this gendered advantage may spur the recruitment and entry of more female candidates. When fraud is not a salient factor, voters may be more likely to employ gender stereotypes that characterize women as less politically savvy and as possessing fewer leadership skills, thereby effectively reducing women's chances of winning elections.
These implications may be more or less likely to hold depending on the context of the election. On the one hand, they are unlikely to hold in districts that are known safe seats. Indeed our results suggest that partisans are unlikely to suspect copartisans of fraud. As such, if a district is a partisan stronghold, the presence of a female candidate is not likely to be effective in swaying voters. In a competitive race, however, a female candidate might be in a better position than a male candidate to encourage voters concerned about corruption to cross party lines to vote. Given the limited amount of information that respondents had in our scenario, these patterns are more likely to hold in equally low-information elections, such as primaries or nonpartisan elections. Similarly, U.S. House elections and judicial elections are considered to be lower-information elections as compared to U.S. Senate and executive elections (Frederick and Streb Reference Frederick and Streb2008; Zaller Reference Zaller1992, 248).
Our results also imply that in countries where fraud and corruption are ongoing concerns, the presence of female candidates and/or female elected officials may minimize concerns of fraud and increase trust in the government and elections more generally. For example, in the case of Latin America, where previous research has found a strong positive correlation between women's presence in the legislature and trust in congress (Schwindt-Bayer Reference Schwindt-Bayer2010), our findings lend credence to the argument that this is a causal relationship. In addition, our findings demonstrate that when the candidate is otherwise an out-group member (a male evaluating a female or a partisan evaluating a member of the other party), the presence of a female candidate can bridge the “out group” divide and engender some level of trust. With respect to the United States more specifically, where trust in government is at a 60-year low (Pew Research 2013), these findings suggests that an increase in presence of female politicians could cultivate more trust in government and work to bridge the partisan divide.
The different reaction of male and female candidates to gender cues in this experiment suggests one important caveat—that any advantage female candidates might enjoy in terms of reducing fraud concerns and improving trust in government may not last indefinitely. If what we observe here is the result of women's shifting views on the leadership qualities of females over the past few decades, then it is entirely conceivable that men might experience a similar shift in perspective in the future. At the point at which the population as a whole views no significant differences in the characteristics of male and female leaders, then we would not expect female elites to improve perceptions of corruption.
Finally, in this article we have only addressed corruption perceptions, which say nothing about whether women are actually more corrupt than men. This study begs the question as to how an increase in female candidates would affect actual corruption in a given political system. It may be that female candidates shape public perceptions of corruption but have no real effect (positive or negative) on corrupt practices. Alternatively, more female candidates might reduce corruption, either because of gender differences in ethics or risk-aversion, or because women are political outsiders who lack access to those networks that facilitate corruption. In a worst-case scenario, more women in political power might provide a kind of window dressing that could enable corrupt politics as usual. As such, we do not wish to leave readers with the impression that women should be viewed as some sort of panacea for corruption problems. Rather, we hope that future work will expand upon our findings to investigate whether the perceptions of reduced corruption that female candidates engender are reflective of actual reductions in corruption.
APPENDIX
Example of survey experiment as it appeared to survey respondents.
Response to question “How likely do you think it is that fraud was committed in this case?”