1 Introduction
The analysis of text, most notably news content, is a fundamental research task, for example in social sciences, but also in the humanities and the political sciences. Often this task is performed manually (in a process known as ‘coding’ in that literature) before any quantitative analysis can be performed. One important set of tasks involves the identification of basic narrative information in a corpus, that is identifying the key actors and objects and their relations. We will refer to actors and objects generally as entities. This can be approximated by identifying the ‘subject–verb–object’ (SVO) triplets that appear in a text (Franzosi Reference Franzosi1998). For example, in the sentence “A dog bit a man’ we would extract the triplet ‘Dog-Bite-Man’. There are various applications in the detection of such semantic triplets, and we will focus mostly on the study of the networks that result from linking together all entities of a given narration. The resulting structure is sometimes called a semantic graph.
For example, in Quantitative Narrative Analysis (QNA) (Franzosi Reference Franzosi1987; Earl et al. Reference Earl, Martin, McCarthy and Soule2004) the fundamental idea is to find the actors and their relations by extracting all SVO triplets. While this is only a subset of the narrative information contained in a text, the set of all SVO triplets does contain information about the key entities and actions described in that text. In the QNA literature the SVO structure of a text is also called a ‘story grammar’.
According to Zeng et al. (Reference Zeng, Chen, Lusch and Li2010), media analytics is supposed to provide tools and frameworks to collect, monitor, analyse, summarize and visualize data in an automated way due to the massive amount of (mostly unstructured) data. The present paper describes a scalable methodology to extract narrative networks from large corpora, discusses various issues relative to the validation of the resulting information and shows two different applications of this methodology, to the analysis of crime and political stories. Our methodology is focused on the extraction of high quality triplets, and contains a series of filtering steps to ensure that only highly reliable information is identified. This high precision comes at the cost of smaller recall, as we will see, but does create networks that capture valuable information from a corpus.
The contribution of this study is not in the improvement of tools for the processing of language (e.g. parsers) but in the development of a new methodology for the extraction of knowledge from a large corpus. The information we extract (e.g. the political relations among actors) is not found in any individual document, but inferred from information distributed across the corpus, by effect of analysing a large network assembled by using all the documents. We test our approach on a corpus of 200,000 articles about the 2012 US elections as well as on small corpora relative to the past seven election cycles, always extracting statistically significant relations that result from the collective analysis of all the documents. We also present a study of crime stories from The New York Times corpus.
In Section 2 we discuss the related work. In Section 3 we present the key conceptual framework behind our methodology and describe the software pipeline that we have used to implement it. We have used existing tools whenever possible for the various stages of the pipeline.
In Section 4 we will describe some of the network properties that we can extract from the data. These include the centrality of entities, their tendency to be subjects rather than objects, the division of entities in different camps using spectral graph partitioning methods and more.
In Section 5 we will discuss the thorny issue of validating the methodology. This is difficult as there is very limited data that we can access, but we propose a multi-strategy approach to validation: validating the entire pipeline (by computing the p-value of certain network properties that we measure); hand validation of a small subset of triplets; and study of the existing literature that has validated various sub-components of the pipeline.
In Section 6 we present an experimental study of the 2012 US elections and the past six election cycles, focusing only on verbs of two types signalling positive or negative attitude from an actor to another actor or object and showing that the resulting network does capture the actual political relations among entities with a very high degree of significance (hence addressing some of the validation problems discussed in Section 5).
In Section 7 we discuss the validation of entity spectrums, obtained from the elections data that produce a ranking of entities from the left to the right of the political spectrum.
In Section 8 we present a study of crime stories from The New York Times, distinguishing between crimes against property and those against person. Again, we show that valuable information can be extracted by turning a corpus into a network.
Section 9 discusses the limitations of this approach, its relations with pre-existing methods and draws the conclusions from this study.
2 Related work
Several existing works from diversified domains have inspired us to design the proposed system. Our approach builds on an idea presented in Rusu et al. (Reference Rusu, Dali, Fortuna, Grobelnik and Mladenic2007) for purposes of triplet extraction. They discuss various ways of extracting triplets using different parsers like Stanford Parser, OpenNLP, Link Parser and Minipar. In this approach, SVO triplets are extracted from the text by a parser, and used to generate a semantic graph that captures narrative structures and relations contained in a text. These semantic graphs have been then used for document visualisation and construction of document summaries using SVM classifiers (Rusu et al. Reference Rusu, Fortuna, Grobelnik and Mladenic2008). This purpose is not the same as ours, and triplet extraction did not include any method to manage signal/noise ratio in network construction, which is instead a major part of our study.
Trampus and Mladenic (Reference Trampus and Mladenic2011) describe a pipeline for learning event templates from a large corpus of textual news articles. The templates are small subgraphs of sematic graphs in which nodes represent actors or objects. In addition, each node of a graph representing an event template is rich with statistics about the context within separate articles it appears in, which serves as a good starting point for training information extraction methods. There is a lack of efficiency measures in this work since it was not intended to scale to very large corpora. Our study is explicitly designed to work in these conditions, which also allows us to leverage statistics to address the signal/noise ratio problem.
Another work by Dali et al. (Reference Dali, Rusu, Fortuna, Mladenic and Grobelnik2009) describes a question answering system where the answer generated is described by a semantic graph, by its automatically generated summary and by a list of facts which stand for SVO triplets. Triplets are extracted from the question and are matched against the triplets extracted from the documents to find the answers.
The work presented in Velardi et al. (Reference Velardi, Navigli, Cucchiarelli and Antonio2008) takes into account the semantic concept that ties two actors through their communicative contents rather than only measuring the quantity of social relationship. Text mining and clustering is used to extract topics or concepts that connect the ties. While the approach presented in this paper uses the concept of semantic content analysis, it also considers weighting a relationship between actors as a function of topic overlapping that defines collaboration strength between two actors in a research community.
Recently, a large body of research work has been done in the field of social network analysis, aiming to describe the macro-level dynamics and characteristics of information diffusion. Kimura et al. (Reference Kimura, Saito, Ohara and Motoda2010) address the problem of predicting the expected opinion share over a social network at a target time from the opinion diffusion data under the value-weighted voter model with multiple opinions. Little work has been done on the front of extracting positive and negative relations between individuals from text, and one of those is by Hassan, Abu-Jbara and Radev (Reference Hassan, Abu-Jbara and Radev2012) where the goal is to mine positive and negative attitudes between individuals engaged in an online discussion and to create signed networks. The approach consists of identifying sentiment at the word level using Random Walk-based method over a word-relatedness graph, at the sentence level by training a classifier that identifies sentences with positive/negative attitude and finally build a network of individuals and use the predictions made at word and sentence levels to associate a sign to very edge.
Partitioning signed networks is an active area of research at present. Although several approaches have been proposed to detect partitions in unsigned networks, very little research has been focused on partitioning signed networks. Doreian and Mrvar (Reference Doreian and Mrvar1996) defined a criterion function to partition signed networks. Given the number of partitions required, a locally optimized value of the criterion function is obtained by starting with a random partition of k sets and moving into states which are neighbours of the current state until a local optima is reached. Kunegis et al. (Reference Kunegis, Schmidt, Lommatzsch, Lerner, De Luca and Albayrak2010) proposed a method to detect partitions in signed networks using spectral analysis by formulating a signed version of ratio cut. The objective function is solved by computing the eigenvalues of the signed Laplacian matrices of the network. Yang, Cheung and Liu (Reference Yang, Cheung and Liu2007) proposed an agent-based approach to detect partitions using a random walk starting from an arbitrary node and is used to detect the community it belongs to. Recently, Anchuri and Magdon-Ismail (Reference Anchuri and Magdon-Ismail2012) used a spectral approach augmented with iterative optimization based on frustration and signed modularity objectives to identify partitions in a signed network.
Analysis of semantic graphs has been used recently in humanities for the analysis of novels called ‘Distant Reading’ (Moretti Reference Moretti2011). In that domain, novels are turned into networks, whose nodes are the actors of the narration, and whose links are the verbs. Topological properties of the network are used to identify protagonists and antagonists. A recent study has compared the actor networks resulting from three mythological epics (Mac Carron and Kenna Reference Mac Carron and Kenna2012). Specifically they analysed three classical narratives with uncertain historicity, which was Beowulf, Iliad and T’ain B’o Cuailnge. From these was created networks where nodes represented characters and edges represented their social relation in the tale. Various network properties were studied to discriminate a given narrative into real or fictional, based on the social network it represented. Agarwal et al. (Reference Agarwal, Corvalan, Jensen and Rambow2012) built networks out of literary text, Alice in Wonderland, in which links between characters are different types of social events (interactions and observations). Analysing these networks gives insight into the roles of characters in the story. The bottleneck for these studies has always been the extraction of the entities and their relations, a work that is done manually, labour-intensive and therefore limits these studies to small samples.
Elson, Dames and McKeown (Reference Elson, Dames and McKeown2010) extracted networks from a corpus of the nineteenth century novels automatically using natural language processing techniques to attribute quoted speech to characters in the novels and then used this data to create networks. Because the study was limited to quoted speech, other types of interactions between characters were missing in the analysis. Gruzd and Haythornthwaite (Reference Gruzd and Haythornthwaite2008) discuss an automated approach to analysis of social networks created from threaded online discussions where they estimate and assign weights to the edges by measuring the amount of information (counts of concept terms) exchanged between pairs of nodes through natural language processing analysis. Techniques based on both web mining and network analysis techniques have been used in intelligence and security-related applications as well and have achieved considerable success. A fully automated crime data mining framework was developed and network centrality measures were used by Chen et al. (Reference Chen, Chung, Xu, Wang, Qin and Chau2004) to analyse crime data and detect key members in criminal groups. But this study was limited to only thirty-six criminal reports from the Pheonix police department in Arizona.
All this motivated us to develop an automated way to extract narrative triplets and analyse the resulting network that could scale to very large corpora and handle the inevitable noise found in the data or produced by statistical natural language processing tools. Our pipeline incorporates lessons learnt from all previous works to achieve this.
3 Network inference
The main idea of our methodology is to identify the entities (actors and objects) and actions that form the narration contained in a text or a corpus. In the election part of the study we are interested in extracting attitudes (positive or negative) of actors (e.g. persons, organisations, etc) towards other actors or other objects which may include ideas, issues, events, etc. This is based on classical approaches in social sciences.
Heider (Reference Heider1946) says that ‘we shall understand by attitude the positive or negative relationship of a person P to another person O or to an impersonal entity X which may be a situation, an event, an idea or a thing’. In the QNA literature (Franzosi Reference Franzosi1987) the only actors and objects that are kept are the ones that fit in an SVO structure, and the most general structures that can play the role of S or O in a sentence are noun phrases. For example, in the sentence: ‘The customer enjoyed the product’, we have two noun phrases (i.e. ‘The customer’ and ‘the product’) and a verb (enjoy). In other words, we extract the most general set of actors and objects that are compatible with the existing definition in QNA literature.
In social sciences there is an interest in identifying social actors which are animate entities (e.g. ‘the mob’, ‘the pope’ or ‘a woman’) as opposed to inanimate ones (e.g. ‘the earthquake’, ‘recession’). In this study we will not make any effort to distinguish between animate and inanimate entities, although this remains an important research question which we will discuss in the Conclusions. It is often possible to use information about their syntactical role (e.g. subject versus object) to identify actors from other entities.
For the elections study we will focus on statements in the text where a certain actor expresses positive or negative attitude towards another actor or object in the form of an SVO triplet. Noun phrases can appear on both sides of this triplet, and we will use them as candidate actors/objects (note that this set also includes named entities). We can easily distinguish between actors and pure objects by separating those noun phrases that have been seen ‘to act’ (by being the subject in a triplet) from those that have not been seen to act (by being only or mostly seen as the object of the triplet). Similarly, we consider as actions the verbs found in the text, and we focus in this study only on transitive verbs, although it would be technically possible to also operate on intransitive ones.
While this is a design choice, it is one that we have observed to cover many entities in our validation, achieving 62 percent precision and 57 percent recall. The entire approach is based on the idea that we extract explicitly stated information, ignoring metaphors and indirect allusions, relying on the fact that we analyse vast amount of data and focus only on relations that are supported by a large number of articles.
We will use a parser to extract SVO triplets. The process of parsing has been greatly improved in recent years but it is still a difficult task to automate as it can result in erroneous SVO triplets. In order to increase the precision of our system, we will only accept triplets that have been seen for a certain amount of time in the corpus. As this step lowers the recall of the system, we precede it with two steps aimed at reducing the number of different noun phrases that can be found: anaphora and co-reference resolution (these steps will be explained in detail below). We will also introduce a weighting scheme to identify those actors and actions that are relevant to a given analysis (e.g. the most specific to the corpus at hand, or the most frequent ones).
We also assign verbs to a small set of categories, by using lists of verbs, so that there are only a small number of verb types in the triplets. These can be seen as expressing a relation among the actors (in the example ‘The customer enjoyed the product’, there is a relation of ‘approval’ from the customer to the product).
The resulting set of triplets reduced in size by each of the above steps can then be assembled into a network. The topology of the network will represent some simplified information that is contained in the corpus, perhaps in distributed and implicit manner. From the topological structure among nodes it will be possible to infer relations among actors that appear in the same corpus, but perhaps never in the same document. The analysis of networks can, in this sense, replace other forms of inference.
3.1 Key definitions
We will call entities all noun phrases/proper nouns that have been seen as subject or object in an SVO triplet. Entities include both actors and objects in the context of social science. We will call actions the verbs that have been seen within an SVO triplet. We call two equivalent triplets that refer to the same entities in different ways, or use different verbs to express the same action. A parser is a software that identifies syntactic structures in natural language.
By using a parser, we can extract a list of all SVO triplets in a corpus. One of the main problems is to recognise equivalent triplets. While a full solution to this kind of problem is very difficult, we can introduce some pre-processing steps aimed at alleviating it.
Firstly, we perform co-reference resolution of named entities, which is the process of determining whether two expressions in natural language refer to the same entity in the world (Soon, Ng and Lim Reference Soon, Ng and Lim2001). Then we perform anaphora resolution of pronouns. Anaphora is a cohesion that points back to some previous item. The ‘pointing back’ (reference) is called an anaphor and the entity to which it refers is its antecedent. The process of determining the antecedent of an anaphor is called anaphora resolution (Mitkov Reference Mitkov1999). The example below will help clarify these steps. Consider the following sentence:
‘Romney praised Paul Ryan. He recalled the excitement of the country in electing Obama four years ago. Ryan criticized Obama for rejecting a deficit reduction plan’.
After co-reference and anaphora resolution, the sentence is rewritten as follows:
‘Romney praised Ryan. Romney recalled the excitement of the country in electing Obama four years ago. Ryan criticized Obama for rejecting a deficit reduction plan’.
After parsing, we can identify the following SVO triplets:
‘Romney praise Ryan’
‘Romney recall excitement’
‘Ryan criticize Obama’
Since the verb ‘recall’ is not a positive/negative attitude, we would create a small directed network out of these triplets as shown in Figure 1, where the edge between ‘Romney’ and ‘Ryan’ denotes praise (positive attitude) and the edge between ‘Ryan’ and ‘Obama’ denotes criticism (negative attitude). The real network would also have a positive/negative weight with the sign on the edges based on the number of positive and negative triplets extracted (explained in Section 3.2). Note incidentally that while Romney and Obama do not appear in the same triplet, this set contains implicit information about their relation that we may want to access.
Network.

3.2 Reliable and relevant triplets
Each of the steps described so far may introduce errors in the process of extracting narrative information. We will discuss the difficult issue of validation of our results, and of the methodology, in Section 5. However, there is an obvious step to reduce the amount of errors in our output: If sufficient input data are available, we can filter away all uncertain or irrelevant results to keep only those that are of more interest for our task.
This introduces the need to quantify the reliability and the relevance of a triplet, or perhaps an actor, an object or an action. We will do this by introducing a weighting scheme.
We will define the weight of an entity or action. These quantities, which can be changed for different applications and tasks, will allow us to rank and select the most relevant or reliable information to be included in our network.
3.2.1 Relevance of entities or actions
Relevance of entities or actions to a given topic can be gauged by comparing their relative frequency in the corpus at hand with that of a background corpus. For example if we want to emphasize sport-related verbs, we could compare the relative frequencies of all verbs in a corpus of sports articles with those in a background corpus, selecting those verbs that are most specific of sport. One possible choice of weight is shown in (1):
 \begin{equation}
{w_i} = \frac{f(i,{D_1})}{f(i,{D_2})}
\end{equation}
where wi refers to the weight of the entity/action i; and f(i,D 1) and f(i,D 2) refer to the frequency of the entity/action in a given corpus D 1 and a background corpus D 2. A similar approach is used in Sclano and Velardi (Reference Sclano and Velardi2007) to define the domain relevance of a term.
3.2.2 Reliability of triplets
We can select reliable (and relevant) triplets by various means. One is to use their frequency in the corpus: triplets seen in more than k independent documents could be considered acceptable. Another method is to choose those triplets that include key entities and key actions. We combine these and consider triplets containing key entities/actions that have been seen in more than k independent documents as reliable. The decision on k is explained later. The highest ranking candidates according to (1) are considered as key entities and key actions. For example, a reliable SVO triplet could be defined in these ways:
S (Key entity) V (key action) O (entity)
S (entity) V (key action) O (Key entity)
S (Key entity) V (key action) O (Key entity)
3.2.3 Strength of relations
In the elections study we will map verbs with positive/negative attitude between entities. Once we have identified a set of reliable triplets by the above methods, we can use them to assess the strength of a relation between two actors. For example, we could have two lists of verbs, one signalling actions compatible with positive attitude and another signalling actions compatible with negative attitude. Then we could just count every triplet as a vote in favour of positive or negative attitude, and calculate a weight for each of the two possible relations.
As we define the extent to which one actor a supports/opposes an object or another actor b, we need to combine the number of positive and negative statements observed in the data going from node a to node b. There are various ways to do this, and they correspond to slightly different interpretations of the meaning of that score. A possible approach to quantifying the weight of a relation between entities a and b is to consider also a confidence interval around our estimate of the value of that relation. This will relate to the estimation of the parameter of a Bernoulli distribution so that we can then calculate the confidence interval around this estimate by using standard methods.
The math for this was worked out by Wilson (Reference Wilson1927). According to it the Wilson score confidence interval for a Bernoulli parameter is given by
 \begin{equation}
w=\left(\hat{p}+\frac{{z^2}_{\alpha /2}}{2n}\pm z_{\alpha /2}\sqrt{\frac{\hat{p}(1-\hat{p})}{n}+\frac{{z^2}_{\alpha /2}}{4n^2}}\right){\bigg /}\left(\frac{{z^2}_{\alpha /2}}{n}+1\right)
\end{equation}
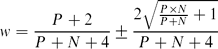
Here  $\hat{p}$ is the fraction of positive observations, z α/2 is the (1–α/2) quantile of the standard normal distribution and n is the total number of observations. For a confidence level of 95 percent, the value for z α/2 is 1.96. This could be approximated to 2 and a simplified version of the Wilson score interval could be obtained by considering the number of positive (P) and negative (N) triplets found between any two entities a and b. Equation (3) shows the simplified version,
 \begin{equation}
w=\frac{P+2}{P+N+4} \pm \frac{2\sqrt{\frac{P \times N}{P + N}+1}}{P+N+4}
\end{equation}
As we can see that this range consists the mean m that is,  $\frac{P+2}{P+N+4}$ and the actual interval i that is,
 $\frac{2\sqrt{\frac{P\times N}{P+N}+1}}{P+N+4}$ on either side of the mean. When a positive/negative relation is supported by many independently generated triplets (k), i becomes smaller and the resulting network would contain the most reliable information. Hence, we introduce a threshold to the percentage of i and accept relations only if i lies below this threshold. Details on how we select this threshold is explained in the Validation section. In this way the value for k remains very high implicitly.
The final score of our links should be associated as a function of the proportion of positive triplets, which is possible in this case since: (P − N)/(P + N) = 2P/(P + N) − 1; then to observe that P/(P + N) is the rate of positive mentions, and to treat the estimation of this quantity like the estimation of parameters of a Bernoulli distribution. This score is computed using the lower bound of the Wilson interval. Since the correction is (3) for 95 percent confidence, the final weight on the links becomes
 \begin{equation}
S=2\left(\frac{P+2}{P+N+4} - \frac{2\sqrt{\frac{P \times N}{P + N}+1}}{P+N+4}\right)-1
\end{equation}
The above methods can be used to select either a set of SVO triplets, or a set of binary relations that we consider as sufficiently supported by the corpus, calculate weights and use them to assemble a network.
3.3 Software pipeline
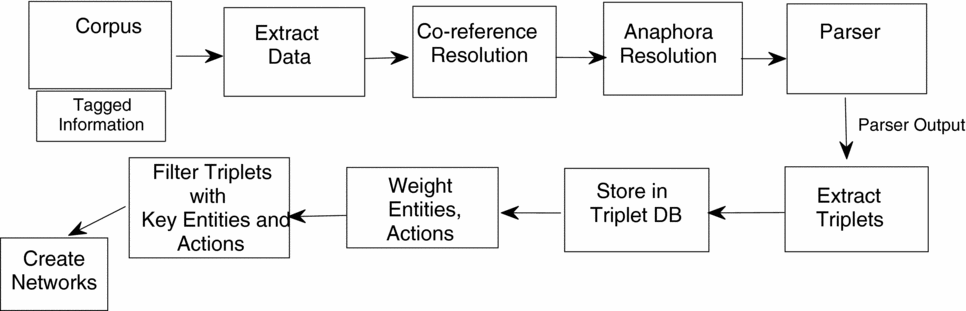
We have described in Sections 3.1 and 3.2 all the conceptual steps that we do in order to turn a corpus into a network of actors, objects and actions. Here we describe the software pipeline that we have used in our experiments. The two guiding principles were for us to re-use existing tools where possible, and to make a system that can scale to large corpora. Figure 2 shows the system pipeline. Each component of the pipeline is explained in detail.
• News Corpus: The system uses articles contained in an available news corpus to perform the task.
• Extract Data: We could first extract the content from articles that are specific to a domain which is of interest to the analysis, e.g. crime, elections, sports, etc.
• Co-reference Resolution: The text in every individual article is processed for named entity co-reference resolution. The Orthomatcher module in ANNIE Information extraction system in General Architecture for Text Engineering (GATE) (Cunningham Reference Cunningham2002) distribution is used to perform this task.
• Anaphora Resolution: Once the co-references have been resolved, the Pronominal resolution module in ANNIE is used to perform anaphora resolution. The system solves pronouns in all forms that are identified by GATE.
• Minipar Parser: We use the parser Minipar (Lin Reference Lin1998) to parse the above-processed text. The parser tags each word of the sentence with its grammatical relation to it. Minipar has its own limitations since it cannot parse sentences more than 1,024 characters long. On the other hand, we found that this length exceeds the size of a typical sentence in the news which is made of approximately 500 characters.
• Extract Triplets: From the Minipar parser output we extract words tagged with s (subject), i (verb) and obj (object of the verb) relations. An SVO triplet is formed out of these words if the s, i and obj relations are found in the sentence in this chronological order.
• Store in Triplet DB: All extracted triplets are stored in the triplets database along with the article information from which they were extracted. This includes article date, title, content and article feed URL. We also store the Minipar parser output for each article.
• Weight Entities and Actions: Entities (subject/object of triplet) and actions are weighted according to (1) and this weight is used to rank and select the highest ranking candidates as key entities and key actions.
• Filter Triplets with Key Entities and Actions: We then filter the triplets that have key entities as subjects/objects and key actions as verbs.
• Create Networks: Directed networks are created with the triplets where the nodes are entities and the edges are actions linking them. To create networks we use Cytoscape (Shannon et al. Reference Shannon, Markiel, Ozier, Baliga, Wang, Ramage, Amin, Schwikowski and Ideker2003) which is a general platform for complex network analysis and visualization. We also used Java Universal Network/Graph (JUNG)Footnote 1 for automatically generating networks and analysing network properties.
• Weight Positive and Negative Relations Between Entities: Positive and negative relations indicate friendship or hostility between actors like mentioned before. In order to identify the strength of these relations we introduce a weighting method which is shown in (4). This would result in entities linked by a positive/negative link with weights.
• Create Signed Networks: We create signed networks where nodes are entities and edges are the positive/negative links with weights.
• Spectral Graph Partitioning: Signed networks are partitioned using spectral graph partitioning methods to assess the degree to which actors/objects belong to or in favour of one of the two parties, in the assumption that the networks are naturally organised into two main communities. This is explained in Section 4.4. We used the JAMAFootnote 2 matrix package for Java to perform this task.
• List of Entities Showing Partitions: Once the network is partitioned we obtain a list of entities which shows the association of them to one of the two communities in the network.
System pipeline.
We do not discuss here the problem of validation of the software because we leave it for Section 5.
4 Network analysis
There are many advantages in representing the information extracted from a corpus in the form of a network (or semantic graph). One of them is that several types of relations among entities can easily be calculated without requiring any explicit form of logical or other inference. Another advantage is that the overall shape of the network can reveal much about the properties of the corpus, and allow comparisons with other corpora. For example, the role played by an actor (say a hero or a villain) within the narration might be reflected by its topological position within the network (Mac Carron and Kenna Reference Mac Carron and Kenna2012).
4.1 Finding central actors/objects
The most obvious application of network analysis to the extraction of corpus-level narrative information is to identify the most central actors/objects to the narration. There are several well-known measures of node centrality in a network, and each of them can be used to capture some different aspects of narrative centrality.
Betweenness centrality measures how important a node is by counting the number of shortest paths of which it is a part (Mihalcea and Radev Reference Mihalcea and Radev2011). In-Degree and Out-Degree measure the count of the nodes number of inward and outward ties to other nodes. Link analysis algorithms like Hyperlink-Induced Topic Search (HITS) (Kleinberg Reference Kleinberg1998) produce two network measures called authority and hub. The authority score indicates the value of the node itself and hubs estimates the value of the links outgoing from the node. PageRank (Brin and Page Reference Brin and Page1998) is a way of deciding on the importance of a node within a graph. When one node links to another node, it is casting a vote for that other one. The higher the number of votes that are cast for a node, the higher the importance of the node.
4.2 The subject/object bias of an entity
Another source of information about entities is how often they appear as subjects or objects in the narration. This can give information about their role in the news narrative, that is its tendency to be portrayed as an active or passive element in the story. We make use of subjects and objects in the collected triplets to do this.
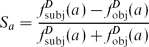
We can compute the subject/object bias of an entity Sa by finding the distance between the absolute frequencies of entities as subjects and objects like in (5),
 \begin{equation}
S_a = \frac{f_{\text{subj}}^{D}(a) - f_{\text{obj}}^{D}(a)}{f_{\text{subj}}^{D}(a) + f_{\text{obj}}^{D}(a)}
\end{equation}
 $f_{\text{subj}}^{D}(a)$ and
 $f_{\text{obj}}^{D}(a)$ refer to the frequency of entity a as a subject and object in a given corpus D. This quantity Sa is in the interval [–1, +1], where a positive score indicates subjectivity and a negative score indicates objectivity.
4.3 Lists of verbs
One way to identify higher level relations among entities is to classify the verbs into categories. For example, we could have verbs expressing friendship (or being compatible with a relation of friendship) or hostility. The sighting of a single triplet containing one such verb would not allows us to conclude that such a relationship exists, but the sighting of several independent such triplets (possibly in different documents) would start increasing the evidence towards that.
An important problem is therefore to create lists of verbs that are organised by type. We have experimented with verbs that denote political support and political opposition, and with verbs that denote crimes, but this can be extended to virtually any domain. Currently our lists are generated by using pre-existing resources such as ontologies, or manually. For example, we used VerbNet (Kipper et al. Reference Kipper, Korhonen, Ryant and Palmer2006) to obtain English verbs and annotated them with tags: crime against person, crime against property, political support and political opposition. Crime-related verbs were obtained from Wikipedia lists.Footnote 3 Verbs denoting political support/opposition were obtained by manually going through the actions in triplets that were extracted from The New York Times elections data (Sandhaus Reference Sandhaus2008). Synonyms of these verbs were also added to the corresponding lists using the online thesaurus dictionary.
Future work would include automating this part using the OpinionFinder (Wilson et al. Reference Wilson, Hoffmann, Somasundaran, Kessler, Wiebe, Choi, Cardie, Riloff and Patwardhan2005) which is a system that performs subjectivity analysis, automatically identifying when opinions, sentiments, speculations and other private states are present in text. Specifically, OpinionFinder aims to identify subjective sentences and mark various aspects of the subjectivity in these sentences, including the source (holder) of the subjectivity and words that are included in phrases expressing positive or negative sentiments. Incorporating this in our pipeline to automatically classify verbs in the corpus as positive/negative would automate the process of defining positive/negative verb lists in our system.
4.4 Spectral analysis of networks
We are interested in assessing the degree to which actors or objects are in favour of one of the two parties in the assumption that the network is naturally organised into two main communities. We would expect that the actors in the same community will have positive attitudes towards each other, while actors in different communities will have negative attitudes towards each other. In the case of objects, certain issues or concepts could be favoured by one of the two parties. We are interested in partitioning the graph into two classes such that nodes in the same class are linked by positive edges and nodes in different classes are linked by negative edges. The division of a network into two parts can be a computationally expensive step, but it can be relaxed to a simple algebraic task by introducing the approximation that the adjacency matrix is symmetric and positive definite, an assumption that can be readily satisfied: given a network with its adjacency matrix A, we make it symmetric by adding it to its transpose resulting in matrix M = A + AT.
In matrix M, where Mij ∈ {− 1, +1}, we want to assign each node to one of the two classes {− 1, +1} as mentioned. This leads to the following optimisation problem,
 \begin{equation}
argmax_{y \in \lbrace -1,+1\rbrace ^m} \sum _{ij} M_{ij} y_i y_j
\end{equation}
We relax this problem (which is NP hard) by allowing the membership function of each node to assume values in  $\mathbb {R} (y_i \in \mathbb {R})$ while keeping the norm of y fixed to avoid trivial solutions. The problem now reduces to the following optimisation problem,
 \begin{equation}
max_y\frac{y^{T}My}{y^{T}y}
\end{equation}
This is equivalent to the eigenproblem My = λy by Rayleigh quotient, since M is symmetric and positive definite by construction, and therefore is efficiently solvable.
The real value assigned to each node in the eigenvector can be interpreted as the degree to which it belongs to one of the two classes. Each eigenvector corresponds to a possible bi-partitioning of the graph, with the quality of the partition being represented by the corresponding eigenvalue. Therefore, it is natural to make use of the first eigenvector, possibly looking at the second one when the eigenvalues are very similar.
Results of spectral graph partitioning methods on real networks will be presented in the experiments section.
5 Validation of the pipeline
Estimating the performance of this methodology is a difficult and important task. There are no accessible corpora that have been annotated in terms of SVO triplets that we can use in order to measure precision and recall of our method, and there are no other networks of actors/objects that have been generated manually based on a corpus. This is not an unusual situation, as most new tasks do not come with a gold-standard benchmarking dataset attached. However, there are various things we can measure in order to increase our confidence in the method and obtain a rigorous statistical estimate of performance.
In Validation 1 we estimate the probability P(T) of a given triplet T extracted once by our tool and was not in the source text. When the probability of this event is known, we can estimate the probability of detecting the same spurious triplet multiple times in the assumption that the extraction process is independent (i.e. it is applied on independently written text). While this is obviously a simplifying assumption, we feel that it is a reasonable one, and it allows us to obtain a ballpark estimate for the probability of a spurious triplet being seen k times in k independent observations of text by trivial calculation of probability of joint independent events.
Secondly, we can easily measure precision of our tool by examining manually the number of errors in its results. This can be readily done. What cannot be readily done is to estimate the number of missing results, as this would require actually having the set of all true triplets, which we do not have. We will call this Validation 2.
Thirdly, we can apply rigorous statistical testing to properties of the network that we know must be true. If the resulting network has the expected properties, then we know that the entire process for its production must have been extracting valid information, even without estimating the performance of each individual step. In one of the following sections, we will report experiments on the 2012 US elections and the past seven election cycles, and each time we measure if the two main parties ‘Democrats’ and ‘Republicans’ are correctly separated in the network of political support. These entities are chosen because these are present in every election, and are always on distinct camps. This removes subjectively choosing the test statistics and increases rigour. We apply statistical hypothesis testing to that experiment, obtaining a p-value that very strongly rejects the null hypothesis. We call this Validation 3.
In other words, by following a multi-strategy approach, we can increase our confidence that the system is extracting valid and valuable information. In particular, the statistical significance study on the elections network and the precision estimates performed on the triplets we have extracted point in the same direction: Our system extracts very precise information that represents the true relations among the actors in the corpus. Estimating the recall would be harder, but since we work in the setting of very large datasets, we choose to focus on obtaining high precision rather than high recall.
5.1 Validation 1
We have used a corpus covering the Civil Rights movement in the Northern Ireland. For that corpus (which contains little or no repetitions) a previous analysis had been done (De Fazio Reference De Fazio2012) and therefore seventy-two manually extracted triplets were available. We applied our methodology, without filtering ‘reliable’ triplets, due to the limitations of the data. Our method extracted sixty-six triplets, out of which forty-one were correct while thirty-one were missed. This gives us 62 percent precision and 57 percent recall in the very unfavourable case when we cannot use any filtering for reliable triplets. This means that there is a probability of 38 percent of a triplet being incorrect if it has been seen just once. If we use this figure as the error rate for triplets seen once, we can use it in a model for the probability of error in triplets seen more than k times, which would be 0.38k. This is true under the assumption that the triplets seen more than k times are independently generated. By only selecting triplets that are seen at least thrice we achieve 5 percent error rate. We implicitly use even higher values for k when sufficient data are available, which was explained in Section 3.
5.2 Validation 2
We have analysed manually seventy-five triplets coming from the 2012 US election campaign, and checked how many were actually present in the articles that were indicated by our pipeline as supporting them. seventy-two triplets out of seventy-five were actually present in the article achieving 96 percent precision. This gives us a clear estimate of precision after our filtering step, but no estimation of recall, which we expect to be low.
5.3 Validation 3
In the following sections we will describe two experiments, one of which identifies the key entities in US elections data for the past years by applying spectral analysis to the resulting network of entities, the experiment produces a ranking of all entities from the left to the right of the political spectrum. We observe manually that in each case the two candidates are maximally separated (an event that would be very improbable by chance). We have therefore run a non-parametric statistical test (Siegel Reference Seigel1957) based on directly sampling the distribution rather than introducing assumptions as in a Student’s t-test. The details in designing this statistical test and the p-value computations are reported in Section 7. Here we also show the effect on p-values for different thresholds to the percentage of interval in (4), which was discussed earlier, and prove that we remove noise and keep signal by applying our filtering step.
5.4 Remarks
Finally, we can corroborate our findings by identifying in the literature the performance rates of the main modules that we have deployed. This would allow us to have confidence in our pipeline. The precision and recall results are on average 96 percent and 93 percent respectively for the ANNIE orthomatcher (co-reference resolution module) and 66 percent and 46 percent respectively for the ANNIE pronominal anaphora resolution module (Bontcheva et al. Reference Bontcheva, Dimitrov, Maynard, Tablan and Cunningham2002). An evaluation with the Susanne corpus shows that MINIPAR is able to achieve about 89 percent precision and 79 percent recall (Lin Reference Lin1998).
6 Experiment 1: analysis of US elections
We present here the results on experiments done with the past six (1988–2008) US presidential election data from The New York Times corpus (Sandhaus Reference Sandhaus2008) and also with 200,000 articles on the 2012 US elections data obtained from our News Outlets Analysis and Monitoring System (NOAM) (Flaounas et al. Reference Flaounas, Ali, Turchi, Snowsill, Nicart, Tijl and Cristianini2011). Experiments were done separately on data from January to August (during primaries) and from August to September (after the conventions). For this experiment we define key entities as those that were most mentioned in this domain instead of comparing the relevance of actors with a background corpus. This was because entities in elections are also key entities in many other domains (e.g. Obama). Hence, we used their absolute frequencies and selected the top one hundred most frequent entities as key entities in this domain. Then we filter triplets that contain the key entities, and actions that denote positive/negative attitudes using our verb lists.
Prior to this if there is a negation preceding a verb in a triplet like ‘Romney not support cuts’, the ‘not support’ is replaced with the verb ‘oppose’. Again if there is ‘not oppose’ in a triplet, it is replaced with the verb ‘support’. Using our weighting method in (4) we assigned positive and negative weights to the links between key actors denoting the strength of friendship/hostile relations between them. From this we were able to create endorsement networks where nodes represent actors/objects and edges represent positive/negative attitudes between them.
Figures 3 and 4 show the endorsement networks obtained from year 2004 US presidential election data from January to August and August to November. We observed that in each year there were many hubs representing candidates campaigning in different states in the network for the period of January to August, while there were only two main hubs during August to November showing the two main opposing candidates from the Republicans and Democrats.
Network with positive and negative edges between entities (US presidential election data: January to August 2004).
Network with positive and negative edges between entities (US presidential election data: August to November 2004).
6.1 Spectral graph partitioning
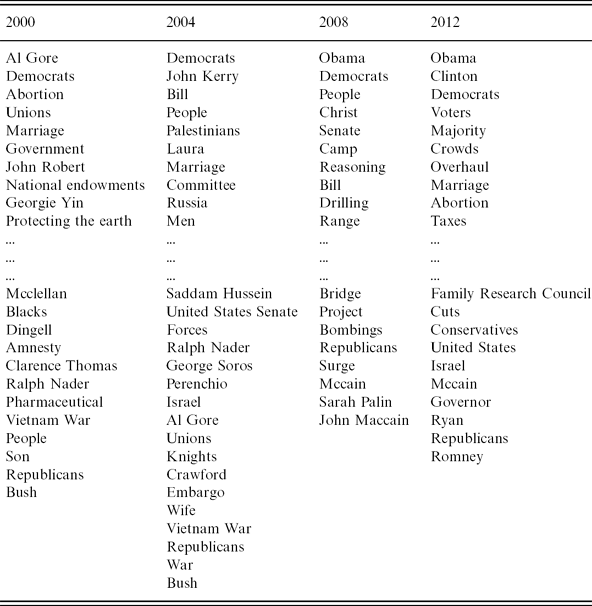
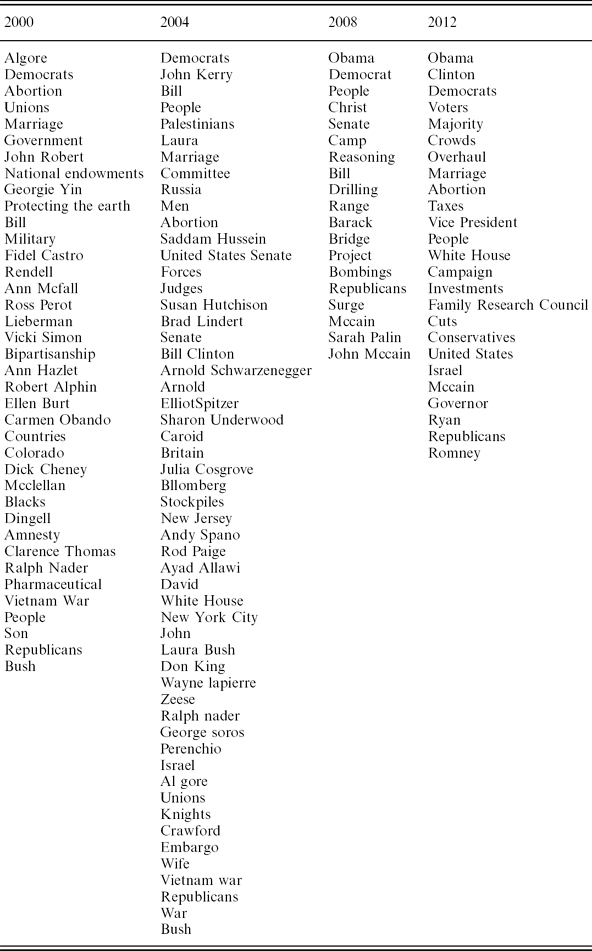
We applied our spectral graph partitioning technique to the networks obtained in the previous election cycles after the conventions. The output was two lists of actors ordered according to the first and second eigenvectors. With regard to party associations, we observed that the first eigenvector ordering of the vertices during the period of August–November gave more accurate results than the second eigenvector for all the years except year 2004. Table 1 shows a smaller version of the lists obtained for year 2000, 2004, 2008 and 2012 after removing the actors/objects in the middle of the list. The full lists obtained from 1988 to 2012 during August to November are shown in Table A1 and A2 in the Appendix. Here we could see the two main opposing candidates in the top and bottom sides of the list representing the “Democrats’ and ‘Republicans’. It is also interesting to see topics like ‘Abortion’ and ‘War’ take sides, with ‘Abortion’ being more associated with the Democrats and ‘War’ with the Republicans.
Lists of entities (actors/objects) showing party association identified in the US presidential election data according to the first/second eigenvector cuts from 2000–2012
6.2 Plotting eigenvectors and subject/object bias of entities
In order to exploit the information coming from the eigenvectors, we tried plotting the first and second eigenvectors in a two-dimensional scatter plot to see the actual positions of entities (actors/objects) in the eigenvector space. Since there are many campaigns during the primaries, we do not expect to see a clear separation of entities showing their association to a party like what we got after the conventions. But still it is interesting to visualise the entities in the eigenvector space. Figure 5 shows the plot obtained for year 2004 from January to August during primaries. Figure 6 is a zoomed-in version of the lower right-hand corner of Figure 5. The distances between entities in terms of eigenvectors explain the relationship between them. The more the distance, the more likely that they were opposing each other at some point. Figure A1 in the Appendix illustrates the plot obtained for the year 2008.
Eigenvector 1 versus eigenvector 2 of entities in 2004 (January to August).
Zoomed-in version of the lower right-hand corner of Figure 5.
We also plotted the subject/object bias of entities against their eigenvector space. We assigned a subject/object bias score for each entity in the eigenvector space according to (5). In this way a positive score indicates subject bias and negative score indicates object bias. Figure 7 shows the scatter plot obtained for the year 2004 where entities are plotted against their second largest eigenvector and subject/object bias scores. We plot the second eigenvector for 2004 since it gave much cleaner ordering of entities compared with the first eigenvector.
Eigenvector 2 versus subject/object bias of entities in 2004 (August–November).
What we observed here is that topics like ‘Vietnam War’, ‘Marriage’ and ‘Abortion’ are most often mentioned as objects, while named entities are often subjects. Figure A2 in the Appendix shows the scatter plot obtained for the year 2008.
7 Validation of the entity spectrum
In designing a statistical test, some design choices must be made arbitrarily and upfront. The most notable ones are of course the choice of null hypothesis and the choice of test statistic. Our test statistic was intended to measure the extent to which our analysis captures the division into two camps of the US political actors/objects. We were interested in making our choices as objective and as general as possible, so we did not want to arbitrarily pick and choose specific actors by hand, or assign them to a political part, for each election cycle. This would also create issues with words such as ‘President’ or ‘Senate’, which might change political leaning in different cycles. Instead, we settled on the obvious choice: the two political parties (‘Democrats’ and ‘Republicans’) are mentioned in each election cycle, and we decided to use the ‘distance’ between them as a test statistic. This initial design choice allows us to design a rigorous statistical test in a way that contains no subjective choices on our behalf.
Permutation testing (also known as randomisation test, or exact test) (William Reference William1990; Good Reference Good2005) is a central part of non-parametric statistics. It directly obtains the distribution of the test statistic under the null hypothesis by calculating all possible values of the test statistic under rearrangements of the treatments (labels) on the observed data points. This removes the need to know the analytical form of this distribution, as done in parametric testing, and hence to apply rigorous statistical testing to situations where an analytical form of the distribution is not available. The availability of high computing power is making non-parametric testing standard in many modern applications. An early example of permutation testing is Fisher’s exact test, more recent examples include bootstrapping and jackknifing.
The basic idea of all randomisation tests is to use the null hypothesis that all treatments (labels) are interchangeable, by measuring the value of the test statistic under (ideally) all possible permutations. In practice, a large sample of random permutations is used. The one-sided p-value of the test is calculated as the proportion of sampled permutations where the test statistic is greater than or equal to that in the original dataset.
We obtain the eigenvalue distance d between the ‘Republicans’ and the ‘Democrats’ in the entity list. We compare it with distance d 1 obtained by taking the distance between the same actors from one hundred randomised networks. Here we use two random network models, Erdös–Rényi and Random rewiring, to generate the random networks.
In the Erdös–Rényi (Erdös and Rényi Reference Erdös and Rényi1960) model, first all edges are removed from the network. Each pair of nodes is connected with an edge at random where the edge is chosen uniformly from the set of removed edges. Here the degrees of nodes are not preserved. In Random rewiring model we randomly reshuffle links, keeping the in-degree and out-degree of each node constant. A convenient numerical algorithm performing such randomization consists of first randomly selecting a pair of directed edges A → B and C → D. The two edges are then rewired in such a way that A is connected to D, while C connects to B (Sergei and Kim Reference Sergei and Kim2002). We do this rewiring m × 10 times for creating each random network, where m is the number of edges existing in the graph.
We check for the number of times r that d 1 ≥ d in the 100 r random networks to calculate the p-value that is given by
 \begin{equation}
p=\frac{r}{100}
\end{equation}
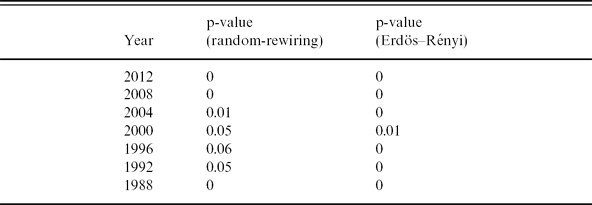
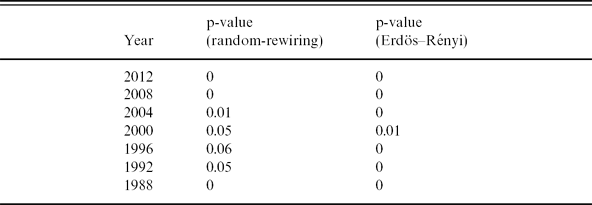
Table 2 shows the resulting p-values obtained for experiments performed on 2012 and the previous election cycles. It shows that the p-value is very low for the same signal appearing by chance.
p-values for distance d 1 ≥ d over one hundred random networks according to two different random graph models
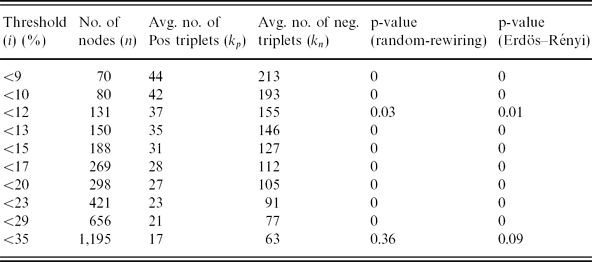
We also checked the effect on p-values when different thresholds are introduced to the percentage of interval i in our weighting equation (4), which is $\frac{2\sqrt{\frac{P\times N}{P+N}+1}}{P+N+4}$. The selection of the optimum threshold for i would be based on the following. It should produce a p-value less than 0.01, contain at least one hundred nodes in the network and the relations in the network should be supported by many number of positive/negative triplets (we report the average number of positive (kp) and negative (kn) triplets obtained per relation in the network). Table 3 shows the results obtained for different thresholds of i. According to our selection criteria, the optimum threshold for i is 13 percent. But it is interesting to see that for upto 29 percent for i the networks which are larger still produce perfect entity spectrums.
p-values for distance d 1 ≥ d over one hundred random networks according to two different random graph models
8 Experiment 2: analysis of crime stories
In this experiment we applied our pipeline to the analysis of nearly 100,000 crime-related stories that appeared in The New York Times corpus between 1987 and 2007 (Sandhaus Reference Sandhaus2008). Our pipeline identified key entities and actions by weighting the entities in crime stories against their frequency in a background corpus Top News (280K articles) according to (1). We selected the top 300 ranking candidates as ‘key entities and key actions’. This threshold was based on the number of triplets extracted which contained the key entities and actions for network analysis. The higher the threshold, the higher the number of extracted triplets. We decided on this threshold value since we wanted to have a compact network with the most important information only.
Here we present results from experiments performed on crime data in year 2002. Figure 8 shows the top twenty key subjects, objects and actions in Crime in 2002 ranked according to their weights. When examined carefully we see that the application exposes a critical crime story that occurred during that year. Sexual abuse scandal in Boston archdiocese was the major chapter in the crime news in early 2002. Actors like ‘Diocese’, ‘Detectives’, ‘Archdiocese’, ‘Cardinals’, ‘Bishops’ and actions such as ‘Molest’, ‘Plead’ and ‘Abuse’ reveal that.
The top-ranked key subjects, objects and actions in ‘crime 2002’.
In order to create networks in Crime, we filtered only the triplets that contained the ‘key entities’ and ‘key actions’. The networks created had subjects and objects as nodes, and the verbs linking them as edges. Every relation in the network had a direction from the subject to object. Figure 9 illustrates a sub-network for the year 2002 which highlights the interactions particularly between the subject ‘Priest’ and other objects in the whole network. By analysing the properties of these kind of networks we can identify the most central entities in a given corpus.
Interactions between the entity ‘priest’ and other entities in the network.
8.1 Measures of importance
In order to identify the central entities in Crime, we ranked all entities according to various network centrality measures like betweenness centrality, In-Degree, Out-Degree, HITS and PageRank.
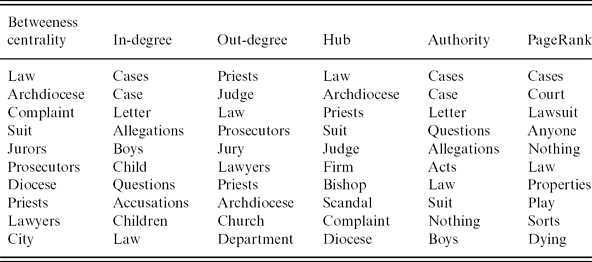
Table 4 shows the top ten ranked entities for each network measure computed in the crime data for 2002. ‘Law’, ‘Priests’, and ‘Archdiocese’ seem to have a high hub rank score. This indicates that most of the links emanate from these entities and other entities do not talk about them a lot (Agarwal et al. Reference Agarwal, Corvalan, Jensen and Rambow2012). ‘Cases’ having a high authority and PageRank scores indicate that most of the links lead to this entity and it has been of great importance. From all centrality measures we see the ‘Law’, ‘Archdiocese’, ‘Priests’ and ‘Cases’ are the most central entities that reflects the Boston sex scandal story in 2002 in the United States.
Top ten ranked entities according to network centrality measures for the crime data in 2002
8.2 Measures of importance over time
To detect changes of roles of entities and actions in crime over the twenty years, we performed an analysis for each key entity by looking at how their centrality measures vary over time. We discovered that network measures like Out-Degree and Hub picked up the most central and interesting entities out of the data. Hence, we used them and the frequency count of each entity to perform the analysis.
Figure 10 shows the time series graphs for Archdiocese plotted against its frequency, Out-Degree and Hub values and actions ‘Molest’, ‘Plead’ and ‘Abuse’ plotted against their frequencies in twenty years. It clearly demonstrates that there has been a peak in all these measures during 2002 when the news stated a lot about the involvement of the ‘Priest’ and ‘Archdiocese’ in the Boston sexual scandal.
Time series graphs for actors ‘Archdiocese’, ‘Priest’, and actions ‘molest’, ‘plead’ and ‘abuse’.
8.3 Verb types
We considered the roles that different entities play in Crime by classifying verbs into two different types, also known as action spheres, such as ‘Crime against Person’ and ‘Crime against Property’. Here are some examples of verbs in these categories.
Crime against Person: Murder, Kill, Torture, Rape, Assault
Crime against Property: Steal, Extort, Rob, Embezzle, Confiscate
For each type we filtered triplets containing actions related to the type and visualised them in a network. We then ranked the subjects and objects found in the filtered triplets according to their frequencies to find the highly ranked entities in these two types of crimes.
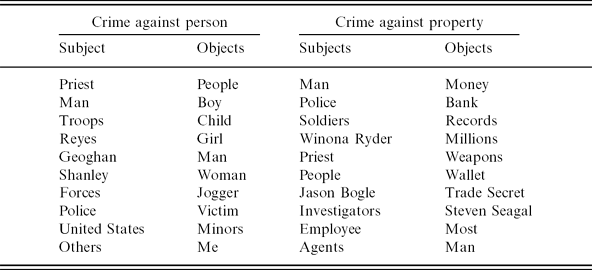
The top ten ranked (based on frequency) subjects and objects involved in crime in 2002 against person and property are shown in Table 5 . We found that ‘Men’ are most commonly responsible for crimes against person, while ‘Women’ and ‘Children’ are most often victims of those crimes.
Top ten ranked subjects and objects in crime against person and property in 2002
It is also encouraging to see that all key objects of crime against person are indeed persons, and similarly the most key objects of crimes against property are indeed non-persons. The subjects are nearly all persons, with the exceptions of a few organisations. All this provides an extra reliability check.
8.4 Subject/object bias of entities in crime
For crime stories we again compute the subject/object bias using (5). Figure 11 illustrates the subject/object bias of entities in crime for the year 2002 against their subject frequencies in a two-dimensional scatter plot.
Scatter plot showing the subject, object bias in data for the year 2002. For ease of visualisation, we removed NY Governor Pataki from the set, as it had a very high subject bias.
We find that ‘Archdiocese’ and ‘Bishops’ are very subjective with a very high frequency and ‘World trade center’, ‘Priesthood’ and ‘Abusers’ were very objective in that year. Generally, we see all the named entities on the subjective side.
9 Conclusions
The task of extracting narrative information from a corpus has applications in many domains. This information includes the identification of the key entites in a narration, the key actions that are narrated and the overall relational structure among them. It can be applied to the analysis of political relations among political actors, as we saw in our study of the US elections, or in the extraction of information from historical text, or from literary text, among other things.
We have presented a method to automate the creation of large networks of entities, testing their validity and analysing properties of the underlying text. We can, for example, identify the most central entities, those who tend to be subjects or objects and the relations among them.
We have also presented a method to map actions to action-types by making use of verb lists. This greatly simplifies the networks by only allowing for few types of edges, as was the case for the network of political support or the network of crime in our experiments. Future work will focus on distinguishing actors from objects and also automating the part of verb classification using OpinionFinder (Wilson et al. Reference Wilson, Hoffmann, Somasundaran, Kessler, Wiebe, Choi, Cardie, Riloff and Patwardhan2005).
The contribution of this study is in the developement of a new methodology for the extraction of knowledge from a large corpus and not in the improvement of tools for the processing of language. Among various sanity checks that we have performed, we have seen that our method always correctly separates the two candidates and the two parties in the US election data, and correctly identifies people as objects of crimes against person (as opposed to crimes against property, for example). Among potentially interesting findings for social investigation, we have seen that this network identified men as frequent perpetrators, and women and children as victims, of violent crime, a finding that might have relevance for social sciences.
More generally, we believe that this method can automate the labour-intensive ‘coding’ part of the task of QNA and Distant Reading among other tasks, and therefore have relevance in social sciences and humanities.
Appendix
Eigenvector 1 versus eigenvector 2 of entities in 2008 (January–August).
Eigenvector 2 versus subject/object bias of entities in 2008 (August–November)
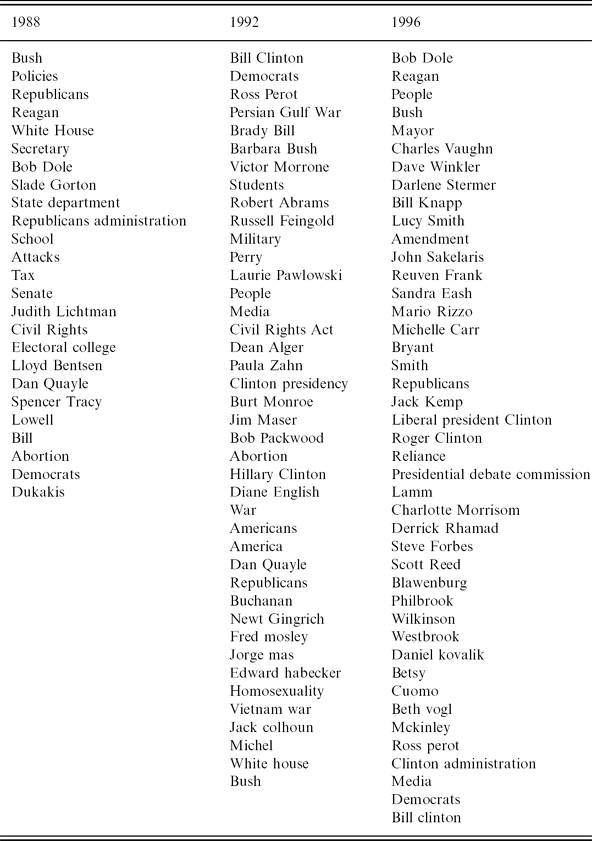
Lists of entities (actors/objects) showing party association identified in the US presidential election data according to the first/second eigenvector cuts from 1988–1996
Lists of entities(actors/objects) showing party association identified in the US presidential election data according to the first/second eigenvector cuts from 2000–2012