The literature on the Agricultural Revolution is vast, and yet fundamental questions remain. This article is concerned with two of these: Why did grain yields rise between the Middle Ages and the nineteenth century, and why was the agricultural revolution so slow?
We have considerable information about grain yields both at the beginning and end of the period. Between 1300 and 1800, the yield of wheat rose from about 12 bushels per acre to about 20 bushels.Footnote 1 The yield of peas and beans grew similarly, while barley and oats realized even greater increases. Regional variation was important, of course, and, in particular, some parts of eastern England had already achieved 1800 yields by 1300.
Explaining the secular rise is a long-standing problem that has been tackled in many ways. A recent approach has been the statistical analysis of microdata drawn variously from probate inventories, Arthur Young's tours of the 1760s, and similar survey material.Footnote 2 Although much has been learned from these investigations, they have not established the causes of rising yields since the Middle Ages. For instance, when the technology variables in Liam Brunt's regression analysis of Young's farm sample are set to their most “backward” values, the equation predicts a wheat yield of 16.45 bushels per acre.Footnote 3 This is halfway between the medieval and the nineteenth-century yields. What else was going on?
For a long time, historians have tried to pinpoint a particular half century or century between 1300 and 1800 to call the “agricultural revolution.” This looks increasingly fruitless because most productivity indicators—output, crop yields (inferred in various ways), labor productivity, real rents—advanced at slow rates over very long periods.Footnote 4 The pertinent question is not when did the agricultural revolution happen, but why was it so slow?
The scientific analysis of agriculture goes a long way towards answering both questions. Since the days of Justus von Liebig, Sir John Bennet Lawes, and Sir J. Henry Gilbert, agronomists have studied the growth of plants to improve their yields. Nitrogen plays a pivotal role in this research. Economic historians have appreciated the importance of the knowledge acquired, and some historical work has utilized formal, scientific models of nitrogen. P. Chorley, for instance, used a nitrogen-based analysis to explain the rise in continental cereal yields between 1770 and 1880, Robert Shiel discussed the nitrogen cycle and applied it to some aspects of English agriculture, and Gregory Clark analyzed convertible husbandry in terms of soil nitrogen as a kind of capital.Footnote 5 I will extend this analysis by working out the dynamics of nitrogen adjustment and use a model to explain the slow pace of the agricultural revolution and gauge the impact of nitrogen enhancing practices on yields in premodern English agriculture.
Plant growth requires water and nutrients—notably, nitrogen, potassium, and phosphorous. Plants use them in roughly fixed proportions, which means that there is usually a shortfall of one, which then limits production. In early modern agriculture, nitrogen was the limiting nutrient: More nitrogen meant more plant growth, whereas increased provision of potassium and phosphorous had little effect.Footnote 6 Only in modern times, when the heavy application of artificial fertilizers has remedied the nitrogen deficit, has it become important to provide grains with other nutrients as well. Nitrogen does not explain all of the growth in early modern yield, but it explains a great deal, and, at the same time, bounds the possible contribution of other improvements in farming.
The analysis of nitrogen is particularly helpful in understanding the importance of livestock and land management. Many historians have emphasized the role of animals in explaining both the low yields of the Middle Ages and the increases between 1300 and 1800. Indeed, the most common explanation of rising yields is “mixed husbandry,” that is, the combination of grain and livestock into a unified system. “The spread of integrated mixed husbandry has now been marked out as the core element of Europe's agrarian transformation since the middle ages.”Footnote 7 Usually, the emphasis in this explanation is on dung. More animals meant more manure, and more manure meant higher grain yields. The high productivity of the nineteenth century is explained in this way—“agricultural development depended upon the accumulation of ever increasing numbers of animals per unit of cultivated land”—as is the low productivity of the Middle Ages.Footnote 8 “Dung was the only real fertilizer . . . The main restriction on the use of manure depended on the sufficiency of animals.” Before the Black Death, population growth meant a continual conversion of pasture to arable, and less grass threatened “the viability of arable cultivation itself.”Footnote 9 In this view, arable and pasture formed a positive feed-back system with nitrogen at its center: Manure contains nitrogen, so more animals meant more nitrogen and higher yields. But was medieval agriculture really held back by an insufficiency of animals and did more animals cause the agricultural revolution?
A second explanation of rising productivity is convertible (or up-and-down) husbandry. In this system, land was alternated between grass and arable at regular intervals. Because cattle were pastured on the grass, this sounds like a special case of the manure argument, but, in fact, the logic is different because natural deposition (rather than grazing) accounts for the increase in nitrogen in the grass. E. Kerridge has emphasized the importance of up-and-down husbandry particularly in the period 1560–1660.Footnote 10 J. F. P. Broad, however, has noted that by 1800 the system had fallen out of favor in the midlands, although it remained important in pastoral parts of England.Footnote 11 Are there reasons why convertible husbandry might have made an important contribution to productivity growth in the sixteenth century, but a lesser contribution in 1800? The analysis of nitrogen provides some insight.
Legume cultivation is a third technique that may have raised yields. It is also one where nitrogen played a leading role. Peas and beans replaced barley and oats as the spring crop in many open fields villages in the early modern period. Clover was introduced as a field crop in the seventeenth century and by the eighteenth it was integrated into the famous Norfolk rotation (turnips-barley-clover-wheat). The barley and wheat produced beer and bread for people, while the turnips and clover fed sheep and cattle. On soils like the Cottswolds, sainfoin meadows were sown.Footnote 12 A common feature of all these crops was that they fixed nitrogen and, thereby, increased soil fertility. Chorley has emphasized their importance for the rise in yields in continental Europe between 1770 and 1880, but the case has not been investigated for early modern England.Footnote 13 That is an objective of this essay.
These issues are addressed by applying a dynamic model of nitrogen to medieval and early modern English farming. The dynamic framework is more complicated than the comparative static approach of Chorley, Shiel, and Clark, but brings with it advantages. Most notably, dynamic analysis emphasizes that the chemical reactions involving soil nitrogen occurred so slowly that the English agricultural revolution was bound to be a slow affair no matter how efficient (or inefficient) were the country's economic institutions. Dynamic analysis also highlights the way new techniques interacted with each other, sometimes to the detriment of productivity growth. On the technical level, a dynamic model requires a more comprehensive specification of nitrogen flows than the comparative static approach. The need to specify fully makes it hard to overlook nitrogen flows, as some investigators have done.Footnote 14 The dynamic model also generates values for more endogenous variables than the comparative static approach. These include the response of yield to free nitrogen in the soil under pre-industrial conditions. This is a key variable that cannot be directly observed. Previous investigators have assumed nineteenth-century values, which are too high. Other variables include the nitrogen fixed by legumes and clover. These can be compared to experimental data to check the validity of the model. These checks lend credence to the approach.
SCIENTIFIC ANALYSIS OF NITROGENFootnote 15
Soil scientists draw a sharp distinction between two forms in which nitrogen is present in soils—organic (also known as immobilized) nitrogen and mineralized (or free) nitrogen. The former includes undecomposed organic matter. One of its distinguishing features is that the nitrogen is combined in chemicals that are not water soluble, so it cannot be absorbed by the roots of plants. Mineralized nitrogen, on the other hand, is in the form of either ammonium or nitrate ions and is water soluble. Plants can absorb nitrogen in its mineralized form, and one path to higher crop yields is to increase the supply of mineralized nitrogen.
Experimental data indicate that the yield of grain (Y) was directly proportional to the level of free nitrogen (F) in the soil so long as nitrogen was the limiting nutrient:Footnote 16

Both Y and F have been measured with late-nineteenth- and early-twentieth-century data, and their ratio implies that m was about 16 kg of grain per kg of nitrogen (in the top 23 centimeters of soil) with a range of about 14 to 18.Footnote 17 This ratio is not constant and rises as cultivation is improved.Footnote 18 Values of 35–40 have been assumed for recent years.Footnote 19 We have no direct measurement of m for the eighteenth century—let alone the Middle Ages—and previous writers have assumed late-nineteenth- or twentieth-century values. The model developed here provides an estimate of equation 1 for medieval and eighteenth-century agriculture. We can use it to partition the rise in yields into two parts—those that increased free nitrogen and those that raised the efficiency with which nitrogen was used.
In equation 1, m is the product of three fractions: the ratio of grain to dry matter (steams, leaves, and grain) in the plant; the ratio of dry matter to nitrogen assimilated by the plant (i.e. the reciprocal of the nitrogen content of the dry matter); and the take-up ratio, which is the fraction of the free nitrogen in the soil absorbed by the plant. The first two ratios do not vary greatly because the morphology and chemistry of grain is fairly stable. Most of the action has been in the take-up ratio, which has increased considerably since the Middle Ages as cultivation has improved.
There were two sources of free nitrogen in premodern agriculture—the mineralization of organic nitrogen and the dung applied to the fields. “The term ‘nitrogen mineralization’ is commonly used to describe the conversion of organically bound nitrogen, mainly as amine groups but not exclusively so, into inorganic forms such as ammonium or nitrate.”Footnote 20 This was a natural process in which 1–3 percent of the stock of organic nitrogen in the soil was converted each year to free nitrogen. The second source of nitrogen was manure as well as the straw, soaked in urine, that was used as litter for animals. How these nitrogen supplies are modeled can be seen by listing the sources of free nitrogen on a field of wheat cultivated in the three field system.Footnote 21 Roughly half of the free nitrogen came from the mineralization of the stock of fixed nitrogen on the wheat field at the start of the year. The dynamics of adjustment are summarized by a difference equation, which will be explained shortly.
The other half consisted of several sources including: first, the residual free nitrogen from mineralization when the land was fallow the year before it was planted with wheat. If winter rains were heavy, most of this was washed away; otherwise, it persisted. This was the dividend from ‘resting’ the land. In the model, residual nitrogen is tracked from one year to the next with more difference equations.
Second, a proportion of the spring grain and beans were fed to sheep, cattle, and horses on the farm, and half of the nitrogen in that feed was returned to the land (the rest was lost).Footnote 22 Equations track these flows.
Third, the stems and leaves of the crops were also collected and fed to animals or used for litter in the barn. Half of the nitrogen in these materials was assumed to be returned to the arable, and these flows are also tracked.
Fourth, meadows produce hay. Half of its nitrogen ended up on the arable. Pasture also contributed nitrogen to the arable, but the quantity was small because most manure resulting from grazing was left on the pasture.
The generation of free nitrogen through mineralization presents greater theoretical problems because it is necessary to model the accumulation and decomposition of the stock of fixed nitrogen. That stock increases if additions exceed reductions from one year to the next. Because the reductions are mineralization and are a constant fraction of the stock, its evolution is governed by a difference equation:

where Nt is the stock of organic nitrogen at time t, At represents additions to the stock, and the mineralized nitrogen (at rate r) is rNt − 1.
At has several sources including: “natural deposition” (to be explained shortly), the nitrogen in the manure that was combined in non-water-soluble organic compounds, the nitrogen in sown seeds, and the nitrogen fixed by beans or clover.
If the additions to the stock A increase and remain constant at the higher rate indefinitely, the stock of nitrogen will rise. As it rises, the amount that is lost through mineralization each year also increases because that loss is a constant fraction of the stock. Once these losses have increased to equal the annual additions, the stock has reached an equilibrium (Net) and will remain indefinitely at that level. Consequently, Net = Net − 1 and substitution in equation 1 implies:

Equations 1–3 comprise the standard model of nitrogen in agriculture. “In general, these simple exponential models give reasonably satisfactory representations of reality over the 10 to 100 year period,” which is the relevant time frame for understanding the agricultural revolution.Footnote 23
Equation 3 is the basis of Chorley's, Shiel's, and Clark's investigations of nitrogen. The impact of a farming practice (such as growing beans or convertible husbandry) on At is ascertained, the implication for Net is calculated, and then an equation along the lines of equation 1 is used to work out the yield change. These calculations compare equilibrium levels but do not indicate how long it took to move from one equilibrium to another. I explore that question by simulating equation 2, and the equations describing nitrogen flows on the farm. It turns out that adjustment was very slow with important historical implications.
To apply the model, N, r, and A must be ascertained. The long-term experiments at Rothamsted provide indispensable data. The Broadbalk wheat and Hoosfield barley experiments are two of the most famous. Plots in these fields have been planted every year since 1852 with wheat and barley.Footnote 24 On unfertilized plots, yields declined slowly and stabilized after about a half century indicating that they had reached a nitrogen equilibrium.
Soil scientists measure the nitrogen in the soil (N) as the quantity in a one hectare plot that is 23 centimeters (nine inches) deep. That depth was chosen by Lawes and Gilbert in the nineteenth century because the roots of grain plants do not penetrate any deeper. One hectare of soil that is 23 centimeters deep contains about 2.91 million kilograms of earth.Footnote 25 Lawes and Gilbert found that the nitrogen contained in this stratum dropped from 0.12 percent to 0.10 percent in the unfertilized plots in the second half of the nineteenth century.Footnote 26 If the nitrogen content is 0.10 percent, the stock of nitrogen is then 2,910 kilograms per hectare and so forth for other percentages. These values are measures of Nt in the nitrogen model. Stability of both the nitrogen content and the grain yields suggests that the Broadbalk and Hoosfield plots had reached a long-run nitrogen equilibrium by the early twentieth century.
The second parameter to determine is the mineralization rate (r). Nitrogen is combined in a variety of organic compounds with a broad range of release rates: D. S. Jenkinson and J. H. Rayner distinguish five classes of compounds with half lives ranging from a few months to 1,980 years.Footnote 27 The mineralization rate required for this model is an average of these reflecting the composition of early modern soils. Because most nitrogen entered the soil as plant residues or by nitrogen fixation (rather than as manure) and because this nitrogen was locked up in the most long-lived compounds, a low value of r is appropriate. Most commentators cite a range of 1–3 percent per year.Footnote 28 In particular, Jenkinson and Jenkinson and A. E. Johnston integrated the differential equation corresponding to equation 2 and fit the resulting equation to time series data for experimental plots at Rothamsted.Footnote 29 They reached a similar result.
The final parameter to calibrate is A, the additions to the stock of soil nitrogen. Soil scientists have attempted to measure all of its components including “natural deposition.”Footnote 30 One exercise put natural deposition at 34 kg/ha including “2 kg in seed, 5 kg in rain, plus a hypothetical value for dry fixation of atmospheric ammonia, set at 10 kg.” The remaining 17 kg. came from biological fixation by blue-green algae as well as by bacteria such as Azobacter and Clostridium.Footnote 31 As the word “hypothetical” suggests, many components of the calculation are speculative, so there remains suspicion that some of the material has been missed, but these analyses remain the best attempts to measure the nitrogen balance in wheat and barley production. A equal to 34 kg/ha implies a mineralization rate of 1.14 percent, which is at the low end of the commonly cited range.
After considerable experimentation with the model, I use a mineralization rate of 1.5 percent, which implies that natural deposition increased the stock of nitrogen by 45 kg/ha each year. This figure slightly exceeds the nitrogen balance figures of 34–36 kg/ha thus allowing for some missed nitrogen. The model was simulated with mineralization rates spanning the whole range of 1–3 percent, and the results were similar to those reported here.
A virtue of the modeling of this article is that all endogenous variables are simulated. Their values provide independent checks on the validity of the model. In particular, the production of clover and bean residues are simulated. Their values concur with the expectations of agronomists, as will be discussed. These results provide confirmation of the model that is independent of the science used in its construction.
CALIBRATING THE YIELD EQUATION FOR MEDIEVAL AND EIGHTEENTH CENTURY AGRICULTURE
The nitrogen accumulation model can be used to calibrate the yield equation for pre-industrial conditions. Consider the Middle Ages first. Bruce Campbell has emphasized the variety of rotations followed by demesnes before the Black Death, but the three field system of fallow-wheat-spring grain was the most common, and I have used it as the baseline case for the Middle Ages.Footnote 32 Most of the other rotations that Campbell reports were equivalent to the classic three field system in their nitrogen economy. The main exceptions were rotations such as fallow-wheat-barley-barley-beans used in some parts of eastern England. The nitrogen economy of these rotations was similar to the early modern rotation fallow-wheat-beans, which I will consider later. Both of these rotations resulted in higher wheat yields than the medieval three field system, although the correlation between legume cultivation and high yields was imperfect in Campbell's sample.Footnote 33
The medieval yield equation and the corresponding equilibrium stock of fixed nitrogen were determined jointly. Not only did yield depend on the stock of nitrogen, but there was also feedback from yield to the nitrogen stock because the manure returned to the arable depended on the spring grain fed to the animals and straw and chaff from all crops used to bed them. With the nitrogen stock affecting the yield and the yield affecting the nitrogen stock, their joint simulation allows the response of yield to free nitrogen (m = Y / F) under medieval conditions to be identified.
Simulations were done over 400 years with a starting value of the nitrogen stock of 3,000 kg/ha. Trial and improvement was used to find the value of m = Y / F that produced a long run wheat yield of 11.6 bushels per acre, the value implied by Campbell's pre-1350 data.Footnote 34 As a check, the model was then resimulated using the equilibrium nitrogen stock from the first simulation as the starting value. This second simulation showed stability in all values over the 400 year simulation period, thus confirming that an equilibrium had been found.
This simulation of the medieval economy showed that the equilibrium stock of nitrogen was 3,272 kg/ha and the yields of wheat and spring grain were 11.6 bu/acre and 13.0 bu/acre, respectively. The spring grain yield is close to Campbell's average oat yield, which is reassuring because parameters were not chosen to ensure that value. The medieval yield equation was:

Had farming improved by 1800? Similar exercises were undertaken for that date using the fallow-wheat-bean and clover-barley-turnips-wheat rotations. These simulations indicate that the productivity of free nitrogen (Y / F in equation 4) had increased to about 12, the exact value depending on the specific rotation assumed. The increase from about eight to about 12 was the pay-off to the eighteenth-century innovations such as seed drills, better ploughs, improved seed varieties, and subsurface drainage emphasized by recent historians.Footnote 35
These results should be contrasted with investigations using late-nineteenth- and twentieth-century data, which indicate that Y / F was about 16. Values on this order or greater were assumed by Chorley, Shiel, and Clark.Footnote 36 Not surprisingly, late-nineteenth- and twentieth-century agriculture was more efficient in the conversion of nitrogen to grain than was earlier farming and so is a poor model, in this regard, for premodern agriculture.
MEDIEVAL PRODUCTIVITY: TOO FEW ANIMALS?
In the introduction, I identified three hypotheses about yields that involved arguments about nitrogen. The first was that medieval agriculture suffered from a deficiency of animals with the result that inadequate manure was applied to the arable.Footnote 37 Campbell's estimates of grain production and distribution indicate that only 15 percent of the spring grain was fed to livestock.Footnote 38 This result is consistent with M. M. Postan's view. But is the rest of the argument true? Would more animals have led to higher yields?
Scientifically based models of nitrogen in agriculture such as the one developed here focus on the degree of nitrogen recycling rather than on the number of animals for a simple reason: Unless the animals are associated with some process that brings additional nitrogen onto the farm, there was an upper limit to what they could have done and that was to recycle all of the nitrogen in the cereals grown on the farm. This would have been achieved if they had eaten all of the grain, and the manure was returned to the fields. The feasible change was an increase from 15 percent (the share of spring grain fed to animals c. 1300) to 100 percent. The impact of this change can be simulated, and it turns out to be small—the equilibrium stock of organic nitrogen rises from 3,272 kg/ha to only 3,322 kg/ha. In consequence, the mean yield of grain would have risen by only 0.4 bushels per acre. This was negligible. Insufficient livestock was not the cause of low medieval yields.
THE NITROGEN REVOLUTION IN EARLY MODERN AGRICULTURE
So what caused yields to rise in early modern England? More animals, on their own, would not have done the trick. Animals did play a role, however, but their impact was indirect. The important changes were new ways of feeding animals, including the cultivation of peas and beans, clover and the Norfolk four course rotation, and convertible husbandry. These new feed systems increased nitrogen levels in the arable, which, in turn, pushed up grain yields. The increases took a long time to materialize, however, which is an important reason that the agricultural revolution was so gradual.
By the end of the eighteenth century, farming in all parts of England was conducted with systems that raised the stock of soil nitrogen. Different systems were used in different regions depending on the objectives of farming and the character of the soil. Agricultural historians have traditionally distinguished the north and west of the country from the center, south, and east.Footnote 39 In the northwest, most of the land was under grass, and meat and wool were the main products. With grain a minor product, convertible husbandry was practiced simply by shifting the cultivation of grain among the many fields of pasture. Arable formed a much bigger fraction of the land in the midlands and eastern England. Convertible husbandry had been important at the end of the fifteenth century in fields enclosed in this region as a response to the decline in population and grain production following the Black Death. However, the development of nitrogen-fixing arable systems allowed much of this land to be shifted back to grain without yields falling back to their medieval levels. In open field villages in the midlands where convertible husbandry was not practiced, soil nitrogen and yields were raised by planting legumes as field crops. By 1800, peas, beans, and clover played a major role in achieving high yields in the midlands and East Anglia, while convertible systems played the corresponding role in northern and western England.
I will investigate peas and beans, the Norfolk rotation, and convertible husbandry by modeling them as though they were adopted by farmers who were previously following a medieval three field system. This highlights the biological implications of the new land management systems but is not descriptive of what happened in many regions. In Norfolk, for instance, the predecessor of the famous four course rotation of the eighteenth century was a rotation involving beans in the fourteenth. Parts of the English midlands went from a rotation such as wheat-oats-fallow before the Black Death, to permanent pasture in the fifteenth century, to convertible husbandry in the seventeenth, and then to arable rotations involving beans in the eighteenth. Different regions followed different trajectories, and the predominant agricultural system varied from region to region during the industrial revolution. These systems had in common the more extensive use of natural processes to raise soil nitrogen, and new techniques to use it more effectively.
EARLY MODERN REVOLUTION: PEAS AND BEANS
I begin with peas and beans. Their cultivation was limited in most of England during the Middle Ages. According to Campbell, only 7 percent of England's demesne land was planted with legumes in 1250–1325 (the exception was Norfolk where legumes amounted to 14 percent of the cropped land).Footnote 40 This changed in the fifteenth century. By 1400–1449, almost 20 percent of the demesne in England was planted with legumes. The new pattern was first glimpsed by W. G. Hoskins in his study of Leicestershire inventories.Footnote 41 Open field farmers in that county were growing a whole field of peas in the sixteenth and seventeenth century, and the practice had begun in the fifteenth. Parkinson's survey data for Huntingdon and Rutland c. 1800 show bean or pea growing to have been well nigh universal in villages where the soil was heavy and unsuited for turnips and clover.Footnote 42
The cultivation of peas and beans are strong candidates for raising yields because they fix atmospheric nitrogen through infection of their roots by Rhizobium bacteria. The benefits are controversial, however. Henry Foth, for instance, contends that the nitrogen in the roots and stubble equals the free nitrogen absorbed from the soil, while the nitrogen fixed from the atmosphere equals the nitrogen in the stems, leaves, and seeds.Footnote 43 The fixed nitrogen, therefore, benefits the soil only if the legumes are eaten by animals and their manure returned to the land.Footnote 44
The success of legume cultivation in raising the stock of organic nitrogen may have depended on a second feature of their growth: They were sponges for free nitrogen in the soil, absorbing it and converting it to organic nitrogen, which was left in the land.Footnote 45 This is born out be experiments on crop rotations at Rothamsted where it was found that “bare fallow proves a better preparation for wheat than does the bean crop, after which in all cases the wheat crop is somewhat diminished.” Particularly large bean harvests had a particularly large adverse effects on the succeeding wheat. “These results can only be interpreted by supposing that the large bean crop, so far from obtaining all the nitrogen it required from the atmosphere, drew extensively upon the resources in the soil, consequently, instead of enriching the land like the clover crop it actually left it poorer than it was before.”Footnote 46
To explore the impact of beans on yields, I have replaced spring grain with beans in the model of medieval agriculture and then simulated yields. Adding beans requires that their nitrogen economy be modeled, and I have taken a conservative course in this regard. I have followed Foth and allowed no role for atmospheric fixation beyond the nitrogen recycled to the arable by feeding beans to livestock. However, I have allowed beans to raise the stock of organic nitrogen by assimilating all free nitrogen in the soil. Assimilation was estimated as the difference between available free nitrogen and the nitrogen removed in seeds, stems, and leaves. The resulting bean residues contained about 47 kg/ha of organic nitrogen in equilibrium, which is consistent with Shiel's judgment that 50 kg/ha was probable for premodern farming.Footnote 47
The introduction of this much additional nitrogen into the agricultural system had a profound impact on the stock of organic nitrogen and on cereal yields. Once beans replaced barley or oats as the spring crop, nitrogen stocks rose steadily from 3,272 kg/ha to about 5,500 kg/ha several hundred years later. The simulation highlights the great length of time required for legume cultivation to raise soil stocks to their new equilibrium. This is a fundamental reason that the agricultural revolution took several centuries to accomplish.
SIMULATED WHEAT YIELDS: PRINCIPLE ARABLE ROTATIONS

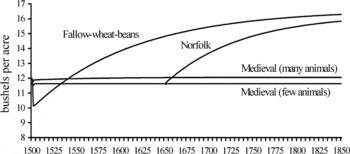
Figure 1 contrasts simulated wheat yields in the various arable rotations. Two flat lines show medieval yields continuing steadily at their equilibrium levels. One line is at 11.6 bushels per acre corresponding to the medieval three field system with only 15 percent of the spring grain fed to the animals; the other at 12 bushels per acre is the yield for the same arable system but with 100 percent of the spring grain fed to stock. In addition, there is a line corresponding to the wheat yield trajectory when beans replace spring grain in the medieval three field system. Years in the simulation are set on the assumption that the shift in cropping occurred in 1500.
The introduction of beans as a field crop had two effects on yields. The immediate impact was a drop in the wheat yield of by about 1.5 bushels per acre. The reason for this fall is that beans absorbed residual nitrates in the soil and converted them into organic nitrogen. These nitrates would have otherwise been available to the wheat, so wheat yields dropped initially.Footnote 48 The economic incentive to introduce peas and beans as field crops was not their immediate impact on the other cereals, but rather in their value as animal fodder.Footnote 49
In the long term, however, the cultivation of beans benefited the wheat. As the stock of organic nitrogen in the soil rose, so did the flow of mineralized nitrogen. After 250 years with beans as the spring crop, the stock of fixed nitrogen would have risen to almost 5,300 kg/ha. As a result, wheat yields would have risen to about 16 bushels per acre. In actual fact, the yield of wheat increased from 11.6 bushels per acre to 20 between 1300 and 1800. In other words, bean cultivation explains about half of the growth in wheat yields in the early modern period. The remainder was due to other farming improvements that increased the efficiency of nitrogen use.
The simulations make a further important point about the agricultural revolution—it was slow. As with the stock of soil nitrogen, the transition to the new equilibrium level of yields took centuries—indeed, it was still going on in 1850! The agricultural revolution was bound to be a drawn out business given the low mineralization rate of organic nitrogen. Singling out any half century as the “agricultural revolution” must be misleading.
EARLY MODERN REVOLUTION: CLOVER AND TURNIPS
The Norfolk rotation (turnips-barley-clover-wheat) is perhaps the most famous innovation of the Agricultural Revolution. Clover and turnips were introduced into England from the Netherlands in the late sixteenth century.Footnote 50 Probate inventories show that the fraction of farmers in East Anglia growing clover increased from 10 percent to 17 percent between 1680 and 1710, while the proportion growing turnips rose from 10 percent to over 50 percent during the same period.Footnote 51 It was only in the eighteenth century that clover and turnips were routinely combined with wheat and barley to form the classic four course rotation. The diffusion of these changes occurred later than peas and beans, and this implies a later rise in yields.
To assess the impact of the Norfolk rotation on grain yields, the nitrogen flows must be established, so that clover and turnips can be added to the medieval model. Turnips raise few issues because the plant absorbed little nitrogen, and much of that was returned to the soil in organic form.Footnote 52 Clover, on the other hand, was highly nitrogenous. It fixed nitrogen from the air and absorbed free nitrogen from the earth. Following Chorley, the former was estimated as 2.5 percent of the roots and stubble, which were taken to equal three-quarters of the weight of clover.Footnote 53 This is a conventional but arbitrary assumption, as Chorley has noted, that underestimates the organic nitrogen amassed by the clover. In particular, the assimilation of nitrates from the soil must also be included, and that component equaled the available mineralized nitrogen not required for hay production. This represented an addition to roots and stubble that increased organic nitrogen. The implied equilibrium rate of nitrogen residue formation is 54 kg/ha, which is slightly over half of Chorley's estimate of 100 kg/ha. The difference arises because I assume that clover yields circa 1800 were only two tons per acre, whereas he makes them four.Footnote 54
An important way in which clover differs from beans is in the timing of the availability of nitrogen for plant growth. Experiments at Rothamsted showed that beans absorbed all of the free nitrogen in the soil with the result that wheat following beans yielded less than wheat following fallow. In contrast, wheat following clover yielded more than wheat following fallow. In the case of clover, two opposing effects were at work. On the one hand, clover, like beans, assimilated free nitrogen from the soil. “Although undoubtedly the clover takes up a good deal of its nitrogen as nitrate, this would seem to be derived from accumulations within the soil” rather than fixation from the atmosphere.Footnote 55 On the other hand, white clover “tissues, which have high N content, rapidly break down on death to release N into the soil.”Footnote 56 The second effect dominates the first. In the modeling here, this outcome is represented by assuming that 40 percent of the nitrogen in clover was available to the wheat in the following year. (The implied increase in yields is consistent with the Rothamsted experiments on clover.) The remaining 60 percent increased the stock of organic nitrogen and contributed to the long-run rise in yields.
To investigate the historical impact of the Norfolk rotation on soil nitrogen and crop yields, the model can be simulated with an initial stock of organic nitrogen of 3,272 kg/ha—the equilibrium stock in the medieval three field system. On the assumption that the Norfolk rotation was introduced in 1650 (perhaps too early a date), Figure 1 shows how the wheat yield would have evolved: it would have reached almost 16 bushels per acre by 1800.Footnote 57 This would have been accomplished without the initial dip in yield, but, as with beans, centuries would have been needed for the full benefits of nitrogen fixation to be realized.
EARLY MODERN REVOLUTION: CONVERTIBLE HUSBANDRY
Convertible husbandry was a third innovation of the early modern period. In this system, land was alternated between arable and pasture. Only a portion of a farm's land was arable at one time. It was used to grow grain for a few decades after which it was put down to grass for more decades before being ploughed up again. The pasture ley raised grain yields by increasing the stock of organic nitrogen in the soil.
The success of convertible husbandry is based on a biological fact—the equilibrium stock of nitrogen in grassland is about 7,275 kg/ha. As a result, if land that has been “worn out” by growing grain (and hence has a low stock of nitrogen) is put down to grass for several centuries, its nitrogen stock will rise to 7,275 kg/ha.Footnote 58
Kerridge's agricultural revolution is an example of this scenario. The population fall after the Black Death led farmers to shift millions of acres from grain to pasture. By the mid-sixteenth century, the stock of fixed nitrogen on this land jumped from about 3,272 kg/ha to about 7,275 kg/ha. Plowing up this pasture would have given initial wheat yields of 20 bushels per acre or a bit more depending on the rotation followed. Alternating the land between arable and grass would have maintained the yield at this level indefinitely. The yield increase from Kerridge's revolution were impressive, indeed.
The gains to convertible husbandry in the sixteenth century were far greater than the gains that lords or peasants could have realized if they had adopted the practice before the Black Death. If we imagine that “worn out” medieval arable with (a nitrogen level 3,272 kg/ha) was put down to grass for 25 years and then ploughed up, the yield gain would have been much reduced. If the arable was cultivated with the three field system, the stock of fixed nitrogen would have risen to 4,100 kg/ha and the wheat yield by three bushels per acre—much less than the gain if the land were rested for two centuries. If beans were planted instead of spring grain, the increase in the yield of wheat would have been cut even further—to barely one bushel per acre—because the free nitrogen in the soil would have been comprehensively absorbed by the beans. Neither course of action would have been costless to a medieval peasant because putting land down to grass would have reduced the number of days he could have worked on his farm and the income imputable to his labor at a time when nonfarm employment opportunities were limited. A profitability calculation in which the value of the larger wheat harvest is balanced against the loss of labor income implies that the rate of return to adopting convertible husbandry was 5 percent, which was less than the interest rate.Footnote 59 The incentive to take up convertible husbandry before the Black Death was minimal.
Although the benefits to adopting convertible husbandry in the late sixteenth century were much greater, the system was gradually abandoned in central England. Broad for instance, pointed out that many of the parishes in the midlands that Kerridge had cited as examples of convertible husbandry in the seventeenth century had given the practice up and were following a purely pastoral husbandry by 1800.Footnote 60 Why would farmers stop using such a highly productive technique? The answer is that its productivity advantage had been seriously eroded as legume cultivation spread in arable districts boosting their grain yields. Consequently, convertible land that was best suited for pasture was shifted back to that use as yields rose on land whose comparative advantage lay in crops. By 1800, convertible husbandry was of reduced importance in the midlands although it remained important elsewhere. Most land was either permanent grass or permanent arable.
NON-NITROGEN CAUSES OF THE RISE IN YIELDS
Increases in soil nitrogen explain about half of the rise in grain yield between 1500 and 1800. Most grain was grown in arable districts without convertible husbandry. The cultivation of peas, beans, and clover was almost universal in these districts, and simulations show that the increased nitrogen stocks would have raised yields from 12 to 16 bushels per acre without any improvement in the efficiency with which medieval agriculture assimilated soil nitrogen.
Models of soil nitrogen cannot explain everything, however. All they can say about the other half of the rise in yields is that it was due to improvements in the efficiency with which plants used nitrogen, as indicated by the rise of the yield equation from about Y = 8F to about Y = 12F. Regression analyses of eighteenth-century survey data come into their own by explaining how this came about. Results so far are as follows.
First, nitrogen take-up can be increased by eliminating competing plants, and that can be done by more extensive weeding, folding animals on fallows, and more extensive or better executed plowing. These techniques can also increase nitrogen take-up by improving soil structure to allow fuller root development and penetration. Greater labor intensity, seed drills, and horse hoeing raised yields, according to the data collected by Arthur Young.Footnote 61 Ploughs and other farm implements were also improved in this period. Their impact on yields has not yet been measured.
Second, in discussing the limits to the application of manure to wheat in the eighteenth century, Young remarked that it was “so apt to lodge if the land is very rich,” that is, if the level of free nitrogen was high.Footnote 62 This is a common problem, and the solution is plant varieties that convert nitrogen into seeds rather than long stems and leaves. There were two sources of better plant varieties in early modern England. One was increased interregional trade in seed, which made good seed available to more farmers and allowed them to discover which varieties worked best in their area. In addition, Robert Plott described how seventeenth-century farmers carefully selected seed from high yielding plants.Footnote 63 This seed was propagated and then sold. In this way, higher yielding varieties were brought into general cultivation.Footnote 64
Third, improved water supply is often required to get the greatest benefit from improved seed and higher nitrogen inputs. In the English case, improvements in water supply meant better drainage rather than irrigation, and better drainage is a third candidate for raising yields. Subsurface, hollow drainage was introduced onto heavy clays in the midlands and east Anglia in the eighteenth century. Statistical studies indicate that it was responsible for a considerable rise in yields, especially for barley and oats, whose yields did rise substantially in this period.Footnote 65
Applying lime to farm land was a fourth technique that increased yields. Lime increases the mineralization rate and, thereby, increases the release of free nitrogen from the stock.Footnote 66 More free nitrogen pushes up the yield. The gain is transitory, however. The equilibrium stock of nitrogen drops as the mineralization rate increases (equation 3), and the yield boost from liming persists only until the new equilibrium is reached. During the transition, the yield gain falls as the new equilibrium is approached. After it is reached, the annual release of free nitrogen is limited to the annual additions, which are unchanged by liming. Lime was not a source of yield gain that would last.
NITROGEN AND THE AGRICULTURAL REVOLUTION
In this article, I have argued that the grain yield increase in England between the Middle Ages and the industrial revolution had two causes of roughly equal importance: increases in soil nitrogen levels due to convertible husbandry and the cultivation of legumes; and increases in the efficiency with which that nitrogen was converted into grain. The first reason leads us to see the role of livestock in a new light. The traditional stress on the importance of animals in explaining English yields is right although the reasons usually given are off target: The dung they produced was less important than the food they ate because the dung merely recycled nitrogen in the system (losing much in the process), whereas the cultivation of peas, beans, and clover for fodder raised the stock of soil nitrogen to the benefit of grain production.
Because the agricultural revolution relied on natural processes to enrich the soil, the evolution of farming technique was closely related to the physical environment. As a result, some regions in the eighteenth century relied on peas and beans to increase soil nitrogen, others relied on clover, and yet others relied on convertible husbandry. In addition, crops such as sainfoin, which have not been modeled here, played a role. What all of these methods had in common was increasing the stock of soil nitrogen.
But the analysis of nitrogen also shows that more soil nitrogen would not have been sufficient to raise yields to nineteenth-century levels had farmers continued to till the land in the typical medieval manner. New tools, new seeds, and a better working of the earth increased the take-up of nitrogen. Less free nitrogen was washed away and more was converted to grain in 1800 than had been the case in the Middle Ages. Northeastern Norfolk is the medieval exception that proves the rule, for it did achieve high grain yields by introducing beans into the arable rotation and by increasing seed rates and intensively weeding and working the land. These changes increased nitrogen take-up by the grain plants. Medieval cultivators had some high-yielding techniques at their command, but they were different from the techniques that propelled English agriculture as a whole to the high productivity of the industrial revolution.
The transition to high yield farming was a long, drawn out affair for a simple reason highlighted by the dynamic model of this article; namely, the slow speed at which the stock of fixed nitrogen in farm land can increase. The main sources of increase were natural deposition and nitrogen fixation by legumes. The annual increments to the stock in any year were very small. Mineralization rates were also low, so the accumulation of fixed nitrogen must have gone on for many years before the stock equilibrated and before enough free nitrogen was created to push up grain yields. The slow pace of the agricultural revolution was rooted, as it were, in the slow pace of the biological processes underlying plant productivity.
It is difficult today to think about the English “agricultural revolution” without contrasting it with the Green Revolution that boosted rice and wheat yields in developing countries in the 1960s and 1970s. The Green Revolution was much faster. A nitrogen framework helps explain why. In both cases, yields were raised by increasing free nitrogen in the soil and by increasing the efficiency with which plants absorbed that nitrogen. In the Green Revolution, the application of artificial fertilizer raised free nitrogen; in the English agricultural revolution, free nitrogen was pushed up by increasing the stock of fixed nitrogen through organic processes: The latter were much slower. Moreover, better plant varieties that were more efficient in converting nitrogen to seed (our food) certainly played an important role in the Green Revolution, and probably played a role in the English. Green Revolution seed was the product of organized research and development, which was a faster innovation system (once it was started) than the interregional trade in seed varieties and the selection of seed from the most productive plants that were the sources of better seed in England. In both revolutions, new models of farm machinery and agricultural inputs were produced by the private sector and contributed to increased nitrogen productivity by improving the conditions for plant growth. England's primitive R&D system slowed the invention of machinery and seed varieties and meant that farmers had to rely on slow biological processes of nitrogen accumulation rather than dousing the soil with factory produced ammonium sulphate or potassium nitrate. That is why the agricultural revolution was so slow.
Appendix 1
THE NITROGEN STOCK MODEL
The following equations describe the nitrogen accumulation process for a notional farm of one hectare of arable. The three field system is practiced, so one third of a hectare is fallow, one third is planted with wheat, and one third with spring grain or beans. Meadow and pasture are also presumed to belong to the farm. This model is used to simulate medieval agriculture, the cultivation of beans and peas, and convertible husbandry.
To model the Norfolk rotation, this model was altered, so that the arable was divided into four courses including turnips and clover. Equations describing the production of manure from feeding clover and turnips, free nitrogen on the clover and turnip fields, and residual nitrogen from the cultivation of clover and turnips were included. These equations were pattern on those shown here. Clover (like beans here) was assumed to absorb all free nitrogen in the soil, but (unlike beans) it was assumed that 40 percent of that nitrogen was released in the following year. The remaining 60 percent increased the stock of fixed nitrogen as in this model.
Variables
Bt = stock of nitrogen (kg/ha) in year t
Ct = nitrogen mineralized per hectare per year in year t
Dt = yield of wheat (kg/ha)
Et = yield of spring grain (kg/ha)
Ft = yield of beans (kg/ha)
Gt = addition to nitrogen on the one ha farm from wheat chaff (kg)
Ht = addition to nitrogen on the one ha farm from manure from feeding spring grain (kg)
It = addition to nitrogen on the one ha farm from manure from feeding beans (kg)
Jt = addition to the nitrogen stock on the one hectare farm from seed sown (kg)
Kt = addition to the nitrogen stock on the one hectare farm from manure (kg)
Lt = addition to the nitrogen stock on the one hectare farm from legume residues (kg)
Mt = free nitrogen on the fallow at year's end (kg)
Nt = free nitrogen on the wheat field at year's end(kg)
Ot = free nitrogen on the spring grain field at year's end(kg)
Pt = nitrogen brought to the one ha arable farm from meadow and pasture (kg)
Qt = wheat yield (bushels per acre)
Rt = spring grain yield (bushels per acre)
St = bean yield (bushels per acre)
EQUATIONS
Nitrogen Stock Evolution

The stock in one year equals its value in the previous year minus mineralization plus additions from seed, manure, and legume residues, plus natural deposition estimated at 45 kg/ha = 0.015 * 3,000 (the mineralization rate multiplied by the equilibrium stock in continuous cultivation)
Mineralization

Mineralization each year equals the mineralization rate multiplied by the stock of nitrogen.
Wheat Yield Equation

Wheat yield equals the yield response coefficient (here 8.349, the medieval value) multiplied by the free nitrogen on one hectare of planted land. Free nitrogen includes mineralization (Ct), free nitrogen from the previous year's fallow (0.5 * Mt − 1 / (1 / 3)), and free nitrogen from manure and chaff, (2 / 3) * (Gt − 1 + Ht − 1 + It − 1 + Pt) / (1 / 3). In the calculation of free nitrogen from the previous year's fallow, 0.5 is the probability that the nitrogen will not be washed away by winter rain and division by one-third, which is the share of the fallow as well as wheat, expresses the nitrogen per hectare of land planted with wheat. In the calculation of nitrogen from manure and chaff, multiplication by 2 / 3 means that two-thirds of the nitrogen is free and immediately available and division by 1 / 3 expresses the nitrogen per hectare of planted wheat.
Spring Grain And Bean Yields

Like the wheat equation exception that free nitrogen on the wheat field replaces free nitrogen on the fallow.
Nitrogen in the Wheat Chaff

The proportion of the nitrogen that is collected and applied to the land is 0.5; Dt is the wheat produced per hectare, (0.55 / 0.45) is the ratio of stems and leaves to wheat, 0.0036 is the nitrogen content of stems and leaves, and (1 / 3) is the hectares planted with wheat.
Nitrogen in the Spring Grain Returned to the Farm

The proportion of the nitrogen that was collected and applied to the land is 0.5. There are two sources of nitrogen represented by the two terms. Nitrogen in the grain that was fed to animals and returned to the land in their manure is represented by Et * 0.02 * (1 / 3) * FEED. In this expression Et is the yield of grain, 0.02 is its nitrogen content, 1 / 3 is the hectarage planted with spring grain, and FEED is the fraction of spring grain fed to the animals. The second term Et * (0.55 / 0.45) * 0.0036 * (1 / 3) is nitrogen in stems and stalks and is interpreted as in the wheat chaff equation.
Nitrogen in the Beans Returned to the Farm

This equation parallels that for spring grain except that it is assumed that all beans are fed to animals on the farm and the ratio of steams and leaves to grain was two rather than 0.55 / 0.45.
Nitrogen in the Seed

The nitrogen content of seed is 0.02; 169.875 kg/ha (2.5 bushels per acre) is the seed rate, 1 / 3 ha is the area planted with wheat or spring grain. When beans were grown as the spring crop, the seed of 203.85 (three bushels per acre) was used for that course.
Increase in Nitrogen Stock from Manure

One-third of the nitrogen in manure and barnyard litter (from wheat chaff, spring grain, beans) and from pastures and meadow hay increases the stock of soil nitrogen. The remaining two-thirds provide an immediate increase in free nitrogen, subject to losses (equations 4 and 5).
Increases in the Stock of Nitrogen from Legume Residues

Legumes are assumed to absorb all free nitrogen, so their residues equal that total less the nitrogen in their grain, stems, and leaves of the beans. 0.5 * Nt − 1 is the free nitrogen on the wheat field at the end of the previous year multiplied by 0.5, which is the probability that that nitrogen will not be leached away by heavy rain. Ct is the free nitrogen produced by mineralization on a hectare, and 0.0225 * Ft is the nitrogen taken up in the grain, and 0.0036 * Ft * 2 is the nitrogen in the seeds and stems on the assumption that their mass was twice that of the grain. The coefficient (1 / 3) is the hectares of beans on the farm.
Free Nitrogen on the Fallow at Year's End

Free nitrogen on the fallow equals the hectares of fallow (1 / 3) multiplied by the nitrogen mineralized per hectare plus the probability that residual nitrogen will not be leached away multiplied by free nitrogen on the spring grain fallow in the previous year. In this case, spring grain definitely does not include beans because their free nitrogen is converted into legume residues that increase the stock of fixed nitrogen (equation A11).
Free Nitrogen on the Wheat Field at Year's End

The term 0.5 * Mt − 1 represents the expected carry-over of nitrogen from the fallow. The remaining term equals naturally deposited nitrogen minus nitrogen taken up in the grain, leaves, and stems of the wheat.
Free Nitrogen on the Spring Grain Field (Not Including Beans) at Year's End

The term 0.5 * Nt − 1 represents the expected carry-over of nitrogen from the wheat. The remaining term equals naturally deposited nitrogen minus nitrogen taken up in the grain, leaves, and stems of the wheat.
Nitrogen in Manure from Meadow Hay and Pasture

The first term is manure derived from feeding hay to the animals. 0.25 equals the hectares of meadow attached to the one hectare of arable. The yield of hay is calculated as 2,000 * (Qt − 1 / 20). This expression means that the yield of hay increased in line with other yields: The hay yield equaled 2,000 kg/ha when the yield of wheat was 20 bushels per acre, and the hay yield varied in proportion to the wheat yield. 0.0133 is the nitrogen content of hay, and 0.5 is the fraction of nitrogen in the manure that was applied to the arable. The second term, 2, is Chorley's estimate of nitrogen in manure that was collected from the gazing of animals on pasture and applied to the arable.
Yields of Grain in Bushels Per Acre
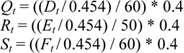
These are the yields per acre of wheat, spring grain, and beans. Kilograms per pound is 0.454, and acres per hectare is 0.4. Wheat and beans are presumed to weight 60 pounds per bushel, whereas spring grain, here modeled on barley, is presumed to weight 50 pounds per bushel.