Introduction
Variation in the performance of ruminant animals is more closely related to feed intake than to diet digestibility or efficiency of converting digestible energy to metabolizable or net energy (Mertens, Reference Mertens1994). Therefore accurate and precise prediction of feed intake is a fundamental prerequisite for successful ration formulation for lactating dairy cows. Regulation of feed intake in ruminants involves multiple mechanisms related to dietary and animal factors that are poorly understood. Despite extensive research efforts over the past 30 to 40 years, no generally accepted intake model has been developed. Limited success in this field is, at least partly, due to complicated interactions between the animal and feed characteristics, and difficulties in distinguishing and quantifying these factors. Animal and management factors influencing intake have been discussed in detail by Ingvartsen (Reference Ingvartsen1994) and Mertens (Reference Mertens1994).
To overcome the problems resulting from variation in animal and environmental factors in estimating the effects of feed factors on intake, we presented a relative silage dry matter (DM) intake (SDMI) index using treatment mean data from milk production studies and mixed-model regression analysis (Huhtanen et al., Reference Huhtanen, Khalili, Nousiainen, Rinne, Jaakkola, Heikkilä and Nousiainen2002). This model estimates the effects of silage characteristics (D-value, fermentation parameters) on SDMI potential when the animal and other dietary factors (e.g. concentrate supplementation and feeding management) are constant. The model was recently updated and extended to include additional silage variables, such as grass harvest (primary growth v. regrowth), herbage species and silage DM and NDF concentration (Huhtanen et al., Reference Huhtanen, Rinne and Nousiainen2007).
In addition to forage characteristics, total DM intake (TDMI) is greatly influenced by the amount and composition of concentrate supplements, and possible interactions between concentrate supplementation and forage intake potential (Dulphy et al., Reference Dulphy, Faverdin and Jarrige1989; Keady et al., Reference Keady, Mayne, Offer and Thomas2004a). The objective of the present study was to extend the relative SDMI index to incorporate the effects of concentrate supplementation on SDMI and TDMI. Thus the aim was to develop an index describing the relative intake of the total diet and hence the ability to predict intake responses to changes in both forage and concentrate variables. The indices are intended to be very simple; they describe the relative intake potential of either silage (SDMI) or total diet (TDMI). One index point represents a 0.1 kg DM/day change in potential intake. In addition, the possible mechanisms influencing the intake responses to different dietary factors are discussed.
Material and methods
Mean treatment values were collected from dairy cow studies using ad libitum feeding of grass silage or grass silage partly replaced with legume or whole-crop cereal silages and supplemented with concentrates differing in the amount and composition. Within each study, the concentrates were fed with the same silage, which was offered ad libitum. When several silage treatments were used within an experiment, they were considered as separate experiments in the statistical analysis. Approximately half of the experiments were conducted in the UK, half in Finland and a few in Ireland and Scandinavia. For the Finnish experiments, unpublished data also were used. Variation in the design of experiments, milk yield, stage and number of lactation, feeding routines, etc. between the experiments was substantial, i.e. it covered most practical on-farm feeding situations.
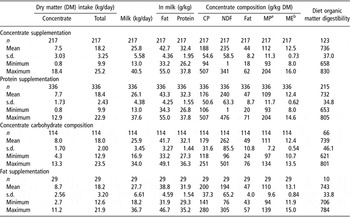
The data were divided into four subsets based on the concentrate treatments. The topics of the subsets were level of concentrate supplementation (87 studies, 217 diets), protein supplementation (128 studies, 336 diets), replacement of starchy supplements with fibrous by-products (45 studies, 114 diets) and fat supplementation (10 studies, 29 diets). Within each comparison, the same silage was given ad libitum and the other concentrate factors except the subject of investigation were constant. For example, in concentrate-level studies only the amount but not the composition of concentrate varied between the treatments within a study. In protein supplementation studies, the CP concentration of concentrates was influenced by replacing energy ingredients, typically cereal grains, with protein supplements such as soybean meal or rapeseed feeds.
Overall, the data set for estimating concentrate effects on intake comprised 616 diets in 177 comparisons. Characterization of the subsets is shown in Table 1 and the list of references used to collect the data is provided in Appendix 1, available at http://www.animal-journal.eu/. The model predicting the TDMI by combining the effects of silage and concentrate parameters included 943 diets in 202 studies. The additional data have been described in conjunction with the SDMI index development by Huhtanen et al. (Reference Huhtanen, Rinne and Nousiainen2007).
Description of the sub-datasets derived from treatment means of previously conducted milk production experiments

The references used to create the data set are presented in Appendix 1, available at: http://www.animal-journal.eu/
aMP = metabolizable protein.
bME = metabolizable energy (MJ/kg DM).
The minimum prerequisite for an experiment to be included in the data set was that adequate silage (plant species, DM concentration, in vivo or in vitro digestibility and fermentation quality) and concentrate (proportion of ingredients, DM, ash and CP concentration) characterization were reported in addition to feed intake and milk production data. Fat (analysed as ether extract), starch and NDF concentrations of the concentrates were entered when reported; otherwise tabulated values (MTT, 2006) for each ingredient separately were used. Metabolizable energy (ME; MJ/kg DM) concentration of silages was calculated as 0.016 × digestible organic matter (g/kg DM) and that of concentrates from chemical composition using tabulated digestibility coefficients (MTT, 2006) for each ingredient separately. Metabolizable protein (MP) concentration was calculated as amino acids absorbed from the small intestine using the Finnish version (Tuori et al., Reference Tuori, Kaustell and Huhtanen1998; MTT, 2006) of the Scandinavian AAT/PBV system (Madsen et al., Reference Madsen, Hvelplund, Weisbjerg, Bertilsson, Olsson, Spörndly, Harstad, Volden, Tuori, Varvikko, Huhtanen and Olafsson1995). The effective protein degradability (EPD) in the rumen and concentrations and intakes of rumen-degradable protein (RDP) and rumen-undegraded protein (RUP) were derived from these calculations. Relative intake potential of SDMI (SDMI index) was estimated as described by Huhtanen et al. (Reference Huhtanen, Rinne and Nousiainen2007). Energy-corrected milk yield was calculated according to Sjaunja et al. (1991).
Calculations and statistical analysis
The data were analysed using the mixed model procedure of SAS (Littell et al., Reference Littell, Milliken, Stroup and Wolfinger1996). The model was Y = B 0 + B 1Xij+ b 0 + biXij + B 2Xij + B 3Xij + eij, where B 0 + B 1Xij +…+ B 3Xij are the overall fixed effects, b 0, b 1 (intercept and slope) and eij are the random part of the model, i = 1…n studies and j = 1…k values within the study. In multivariate models only the first independent variable was a random factor. Variation in experimental protocols, animal types and laboratory assays would contribute to study effects in these regressions. The best-fit model was chosen based on the lowest residual mean-square error (RMSE) and Akaike’s information criterion. In the tables the values for RMSE and R 2 after adjusting for the random effect of study are presented. Rationale and further details of using mixed-model analysis to integrate quantitative findings from multiple studies have been described by St-Pierre (Reference St-Pierre2001).
The relationships between the concentrate DM intake (CDMI) and TDMI were analysed separately for studies with different mean milk production levels (<25.0 and >25.0 kg/day), different relative silage intake potentials (SDMI index <100 and >100) and average days in milk (<100 and >100). The relationships between some animal and dietary parameters v. substitution rate (SR; decrease in SDMI per increase in CDMI, kg/kg) were analysed by a single regression analysis using the slope for the mean SR (linear slope between the concentrate and forage intake within a study as a dependent variable (n = 87)). Animal parameters (e.g. milk yield and TDMI) observed at the lowest level of concentrate supplementation in each study were used as independent variables.
The results from analysis of all four subsets (CDMI, protein, NDF and fat) were combined to create a relative CDMI index assuming additivity of the components as described in our previous paper for silage intake potential (Huhtanen et al., Reference Huhtanen, Rinne and Nousiainen2007). In the CDMI index, an intake difference of 0.100 kg/day equals to one index unit. The standard concentrate supplementation (100 units) was defined as follows: 8 kg DM/day of concentrate containing 170 g CP, 250 g NDF and 40 g fat per kg DM. The intake potential of the total diet was calculated as TDMI index = SDMI index + CDMI index − 100. The standard diet is defined as a standard silage (intake potential = 100 units) and standard concentrate (100 units). The residuals of the mixed-model regression between TDMI and the TDMI index were plotted against all silage parameters using a simple regression of Y on X.
To validate the robustness of the CDMI index model, the data were randomly split experimentwise into six subsets of 95 to 114 observations. Each subset was in turn left out and the CDMI index model was calculated using the remaining five subsets. The resultant model parameters were used to compute CDMI index for the observations in the excluded subset, and the procedure was repeated for all subsets (cross-validation). The cross-validation RMSE was obtained by regressing the estimated CDMI index against the observed TDMI for all cross-validation observations using a mixed-model regression analysis with a random study effect as described above. A similar procedure was repeated for the whole data set to validate the TDMI index. Because the SDMI index does not predict accurately the intake of legume and whole-crop silages when fed at high proportions (Huhtanen et al., Reference Huhtanen, Rinne and Nousiainen2007), diets containing proportionally more than 0.50 of these silages of forage DM were excluded from the validation as well as diets containing proportionally less than 0.10 of concentrates on DM basis.
Results
Effects of the amount of concentrate on silage DM intake
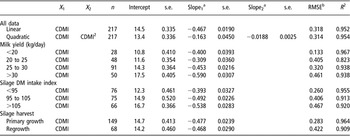
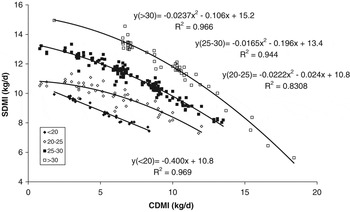
SDMI decreased on average by 0.47 kg/day per 1 kg increase in concentrate DM allowance (Table 2). The effect of concentrate supplementation on SDMI was strongly curvilinear, as indicated by the P value of the quadratic trend (P < 0.001), i.e. SR increased with the level of concentrate supplementation from 0.35 to 0.54 and 0.73 with concentrate intakes of 5, 10 or 15 kg DM/day, respectively. The linear SR increased with milk yield being 0.40, 0.31, 0.45 and 0.59 when the average milk yield in the study was < 20, 20 to 25, 25 to 30 or > 30 kg/day, respectively. The quadratic relationships between the concentrate and SDMIs were rather similar in different mean milk yield groups (Figure 1). The effect of increasing the level of concentrate supplementation on SDMI became stronger as the relative SDMI potential improved (Table 2). Increased concentrate supplementation affected similarly the intake of silages prepared from primary growth and regrowth grass.
Effect of concentrate dry matter (DM) intake (CDMI, kg/day) on silage DM intake (kg/day)

Slope1 for linear models represents the substitution rate. Data from level of concentrate supplementation studies (n = 217).
aAll slopes significant (P < 0.001).
bRMSE = residual mean-square error.
Relationship between concentrate DM intake (CDMI) and silage DM intake (SDMI) in studies with different mean milk yield. Data from level of concentrate supplementation studies (n = 217).

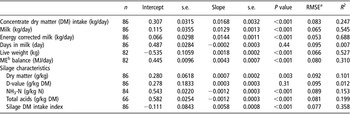
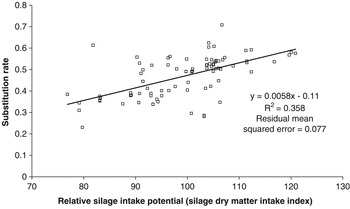
Single fixed regression equations between some animal and silage parameters on SR are shown in Table 3. Consistently with the quadratic effect of the concentrate level, SR was negatively (P < 0.001) associated with the initial level of concentrate within each study. The SR increased (P < 0.001) with higher milk production and live weight of the cows, but it was not associated with the stage of lactation. The depressive effect of increased concentrate supplementation on SDMI increased (P < 0.001) as the calculated ME balance of the cows increased. The SR was positively related to silage total acid and ammonia N concentrations and negatively related to silage DM concentration, but silage D-value had no effect on SR. Interestingly, the intake potential of silages (SDMI index) explained the variation in SR much better than any single silage parameter. The mean change in SR was −0.0058 (P < 0.001) per unit of change in SDMI index and it was linear (P < 0.001) over the whole range of data (Figure 2).
Effects of some animal and silage factors on substitution rate

Data from level of concentrate supplementation studies.
aRMSE = residual mean-square error.
bME = metabolizable energy.
Relationship between the relative silage intake potential and the substitution rate (decrease in silage DM intake/increase in concentrate DM intake, kg/kg). Data from level of concentrate supplementation studies (n = 86).

Effects of protein supplementation on silage DM intake
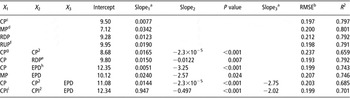
The effects of protein supplementation on SDMI are shown in Table 4. Increasing the CP concentration by replacing concentrate energy supplements with protein feeds increased SDMI significantly (P < 0.001). The quadratic effect was also significant, indicating diminishing responses to protein at higher supplementation levels. The effects of RDP concentration and EPD were significantly negative when used as independent variables in bivariate models in addition to CP concentration. The effect of EPD also remained significant when it was used as a third variable with linear and quadratic effects of CP concentration or supplementary concentrate CP intake.
Effects of protein supplementation on silage dry matter (DM) intake (kg/day; n = 336)

aAll slopes significant (P < 0.001).
bRMSE = residual mean-square error.
cCP = crude protein concentration of the concentrate (g/kg DM).
dMP = metabolizable protein concentration of the concentrate (g/kg DM).
eRDP = rumen degradable protein concentration of the concentrate (g/kg DM).
fRUP = rumen undegraded protein concentration of the concentrate (g/kg DM).
gOnly intercept of the model random.
hEPD = effective protein degradability (g/g).
iCPI = Supplementary CP intake (kg/day; CP concentration 170 g/kg DM as a base line).
CDMI or proportion of concentrate in the diet had no effect on the intake response to supplementary protein. As expected, the intake responses decreased when the concentration of CP or MP in the concentrate increased. The SDMI response was not significantly related to silage CP concentration or SDMI index (data not shown).
Effects of concentrate carbohydrate composition and fat supplementation on silage DM intake
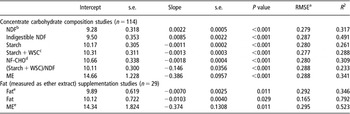
SDMI increased slightly, when cereal grains were partially or completely replaced with fibrous by-products in concentrate mixtures (Table 5). These increases were significantly (P < 0.001) related to concentrations of NDF, starch, starch + sugar and non-fibre carbohydrates (total carbohydrates − NDF) in the concentrate. The differences in the precision of SDMI prediction between carbohydrate components were small, probably reflecting their strong correlations with each other. Based on Akaike’s information criterion, the ratio of (starch + sugar)/NDF and calculated ME concentration was slightly better than concentrations of single carbohydrate components. Total NDF intake increased (P < 0.001) with increased concentrate NDF concentration as follows: NDF intake (kg/day)=4.96 ± 0.173 + 0.0091 ± (0.00043) × concentrate NDF concentration (g/kg DM; RMSE = 0.093 kg/day).
Effects of concentrate carbohydrate and fat concentrations (g/kg dry matter (DM)) and estimated metabolizable energy (ME) concentration (MJ ME/kg DM) of concentrate on silage DM intake (kg/day)

aRMSE = residual mean-square error.
bNDF = neutral detergent fibre.
cWSC = water soluble carbohydrates.
dNF-CHO = non-fibre carbohydrates (total carbohydrates – NDF).
eRandom intercept (in other models, both intercept and slope are random).
Fat supplementation decreased SDMI linearly, when expressed as either per change in concentrate fat concentration or intake (Table 5). The decrease in silage ME intake was 0.37 kg per MJ ME increase in concentrate energy concentration.
Relative concentrate DM intake index
The effects of CDMI, and concentrate CP, NDF and fat concentrations on TDMI were manually integrated into a relative CDMI index using the following equation: CDMI index = 100 + 10 × [(CDMI − 0.1629 × CDMI − 0.01882 × CDMI2 − 5.49) + ((0.9474 × CCPI − 0.4965 × CCPI2) − 2.017 × (CEPD − 0.74)) + 0.00225 × (CNDF − 250) − 0.0103 × (40 − Cfat) − 0.00058 × (CDMI − 8.0) × (SDMI index − 100)], where CDMI = concentrate DM intake (kg/day), CCPI = supplementary concentrate CP intake (kg/day; CP170 g/kg DM as a base line), CEPD = concentrate EPD (g/g), CNDF = concentrate NDF concentration (g/kg DM) and Cfat = concentrate fat concentration (g/kg DM). The constant 5.49 adjusts the index to a basal level of CDMI (8.00 kg DM/day). The coefficient 10 converts the predicted TDMI response (kg DM/day) compared with the default concentrate supplementation (see description in section ‘Calculations and statistical analysis’) to index units; one index unit is equal to a change of 0.100 kg/day in TDMI.
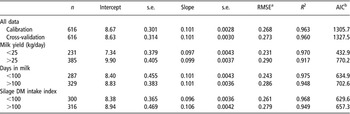
The CDMI index predicted the TDMI responses within a study precisely as indicated by small RMSE of the values adjusted for the random study effect (Table 6). The slope of CDMI index on TDMI was the same as the default value, indicating that there were no strong interactions between the components of the CDMI index. The slopes were similar in studies in which the mean milk yield in the study was below or above 25 kg/day or when the average days in milk was below or above 100 days. However, when tested by t-test the slope was significantly higher for diets with the relative SDMI index above rather than below 100 units.
Relationships between concentrate dry matter (DM) intake index and total DM intake (kg/day)

aRMSE = Residual mean-square error.
bAIC = Akaike’s information criterion.
The cross-validation RMSE was only marginally higher than RMSE, indicating a robustness of the model (Table 6). The good model performance is consistent with the small variation in regression coefficients of the two major components of the CDMI index (concentrate DMI and supplementary protein) between the six cross-validation subsets. Also the coefficient for the interaction term (CDMI × SDMI index) had a small variation (CV = 8.8%).
None of the concentrate or forage parameters were significantly related to the residual of the model (data not shown). The relationships between the animal parameters and the intake responses to the CDMI index were small and practically unimportant. The strongest relationship was the negative effect (P = 0.001) of ECM yield on intake response, but although statistically significant, quantitatively the effect was small. For example, a 10 kg difference in ECM yield and a 20 unit difference in CDMI index would result in a bias less than 0.10 kg DM/day.
Total diet DM intake index
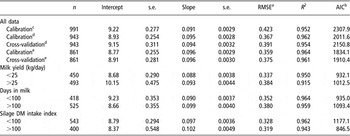
Predictions of TDMI from the relative TDMI index are shown in Table 7. The relative intake potential of the total diet (TDMI index) calculated as a sum of the silage and CDMI indexes minus 100, i.e. an index value of 100 describes the intake potential of a diet comprising the standard silage (Huhtanen et al., Reference Huhtanen, Rinne and Nousiainen2007) fed ad libitum with 8 kg DM/day of a standard concentrate defined earlier. The RMSE was 0.367 kg/day when the diets contained proportionally less than 0.50 of the forage DM as legume or whole-crop silages and diets containing more than 0.10 of concentrate DM (n = 943). If all data were included (n = 991), the RMSE increased to 0.423 kg/day, showing that prediction of intake for the extreme diets was not very accurate.
Relationships between total dry matter (DM) intake index and total DM intake (kg/day)

aRMSE = residual mean-square error.
bAIC = Akaike’s information criterion.
cWhole data.
dDiets containing proportionally more than 0.50 legume or whole-crop silage of forage DM or less than 0.10 of concentrate DM of the total DM were excluded from the data.
eGrass silage-based diets (no diets containing legume or whole-crop silages included).
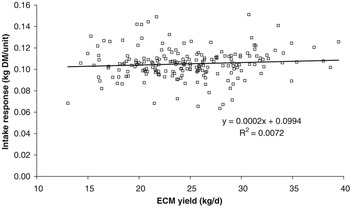
The mean response of 0.095 kg DM per one index unit was close to the default value of 0.100. The cows responded less (P = 0.02) to increased intake potential of the diet when the average days in milk was below 100 (mean 80) rather than above 100 days (mean 122). The slopes in studies with different milk yield or SDMI index were not significantly different. Figure 3 shows that the intake response to TDMI index units did not depend on the production level of the cows. Residual analysis showed that none of the forage or concentrate parameters were significantly related to the residuals of predicted TDMI (data not shown). Similarly as for the CDMI index, the ECM yield was positively (P < 0.01) related to the residual, but the magnitude of the effect is not of practical relevance.
Intake response to TDMI index units did not depend on production level (lowest ECM yield within the experiment on X-axis).

The RMSE of cross-validation were marginally higher than the calibration RMSE, especially when legume and whole-crop silages (below 0.50 of forage DM) were included in the data. Larger difference for these data is partly related to the fact that the effects of legume and whole-crop silages were not taken into account in the validation data. However, for more comparable grass silage data, the difference in RMSE was small and the slopes were similar for calibration and cross-validation equations.
Discussion
Concentrate supplementation
The mean SR in the current analysis (0.47) corresponds well to the values of 0.52 (Thomas, Reference Thomas1987) and 0.41 (Rook et al., Reference Rook, Gill, Willink and Lister1991) despite the fact that a large proportion of studies in the current data set was conducted later than these studies were published, and conducted generally using cows with a higher milk yield. When the relationships between concentrate and silage intakes were plotted for cows at different production levels (Figure 1), the shape of the curves were very similar with the major difference being that at each concentrate intake level, SDMI increased with increasing milk yield. This is in good agreement with the observations of Ferris et al. (Reference Ferris, Gordon, Patterson, Mayne and Kilpatrick1999), who fed increasing levels of concentrate to medium- and high-genetic-merit cows.
The adverse effect of concentrates on SDMI increased with increasing level of concentrate supplementation as indicated both by the strong negative quadratic effect (P < 0.001) and by the linear decrease (P < 0.001) in SR with increased concentrate intake. Curvilinear effects of increased CDMI on SDMI were also reported by Keady et al. (Reference Keady, Mayne, Offer and Thomas2004a) and McNamee et al. (Reference McNamee, Woods, Kilpatrick, Mayne, Agnew and Gordon2005).
The observed quadratic relationship between the concentrate level and TDMI does not fully support the biphasic theory of intake regulation (e.g. Mertens, Reference Mertens1994). Within physical limitation, the TDMI should increase linearly with increased concentrate allowance due to the reduced NDF content (i.e. gut fill) and increased digestibility of the diet. On the other hand, no break-point of intake was observed even with the highest levels of concentrates, which according to the biphasic theory should mean that the intake was still constrained by rumen fill.
The observed intake responses to increased concentrate allowance in the present data follow more closely the concept of Fisher et al. (Reference Fisher, Burns and Pond1987), which allows interactions between the metabolic and physical intake constraints. According to their concept, the relationship between CDMI and TDMI may be interpreted so that with high-concentrate diets the metabolic constraints limit the cows’ ability to use their full physical rumen capacity. However, when interpreting the relationships between CDMI and TDMI intake it should be noted that the filling effect of one unit of NDF depends on diet composition. Huhtanen and Jaakkola (Reference Huhtanen and Jaakkola1993) observed in cattle fed at a restricted level that rumen NDF fill increased at the highest level of concentrate supplementation (0.75 of diet DM) despite lower dietary concentration and intake of NDF compared with a medium concentrate diet (0.50) due to the reduced turnover rate of NDF.
The linear SR increased significantly with an improved intake potential of forage (Figure 2). A similar interaction was observed by Keady et al. (Reference Keady, Mayne, Offer and Thomas2004a). In their intake model, the negative interaction between forage intake potential and CDMI was stronger than estimated from the current data. However, the strongly negative quadratic coefficient of CDMI in our model will have a similar influence on intake. Rinne (2000) reported a non-significant negative interaction between silage D-value and CDMI from a smaller data set (n = 94). The present analysis showed that the decreases in SR were related much stronger to the overall intake potential of silage than to any single component of the index. The present observations agree with Thomas (Reference Thomas1987), who suggested that SR is more closely related to the intake of silage fed as a sole feed than to silage digestibility. In the French fill value system, the apparent fill value of concentrates (SR) increases with the energy density of forages (Dulphy and Demarguilly, Reference Dulphy and Demarguilly1994), whereas in the fill unit system proposed in Finland by Hyppölä and Hasunen (Reference Hyppölä and Hasunen1970) and the Danish system (Ingvartsen, Reference Ingvartsen1994), SR is considered constant.
The SR increased at higher production levels of the cows (from 0.40 to 0.59), which is unexpected in relation to their higher energy demand. This effect could, at least partly, be related to the higher initial amount (5.3 v. 9.3 kg DM/day) and proportion (0.37 v. 0.43) of concentrates in studies with higher milk yield (below 25 v. above 25 kg/day). The higher SR may also be associated with the higher (92 v. 101) relative intake potential of the silages used in studies with the higher milk yield, which tends to increase the SR (Figure 2).
Protein supplementation
Improvements in SDMI response to supplementary protein have often been suggested to be related to increases in the rate of fibre digestion in the rumen (Oldham, Reference Oldham1984). Organic matter digestibility determined for 213 diets by using either total faecal collection or internal markers increased (P < 0.01) quadratically as concentrate CP (CCP) concentration (kg/kg) increased (organic matter digestibility = 0.695 + 0.34 × CCP (kg/kg) − 0.00064 × CCP2; RMSE = 0.0042). However, the magnitude of the maximum increase was only 0.013 units compared with a CCP concentration of 120 g/kg DM.
Several mechanisms may be associated with improved organic matter digestibility in response to replacement of energy supplements with protein supplements: (1) overcoming deficiency of RDP, (2) higher intrinsic rate and potential extent of fibre digestion of protein supplements, (3) better rumen conditions for fibre digestion due to reduced dietary starch content and (4) stimulation of cellulolytic bacteria by amino acids and peptides derived from supplementary protein. Improved digestibility of potentially digestible NDF with increased protein supplementation (Shingfield et al., Reference Shingfield, Vanhatalo and Huhtanen2003) suggested that factors other than higher intrinsic extent of digestion were involved in improved digestibility.
The fact that improved digestibility can only partially explain intake responses to supplementary protein supports the concept that other factors such as improved amino acid to ME balance at the tissue level are also involved. Khalili and Huhtanen (Reference Khalili and Huhtanen2002) observed a greater increase in SDMI with duodenal rather than ruminal infusion of casein. Duodenal infusion was associated with a higher rumen NDF fill and a longer total chewing time compared with cows receiving a ruminal casein infusion. Similarly, Faverdin et al. (Reference Faverdin, M’hamed and Vérité2003) reported a higher intake response to duodenal protein infusion compared with ruminal protein or glucose infusion. These findings suggest that cows are able to adjust physical fill limit and to increase SDMI when milk yield and energy demand are increased in response to increased amino acid supply.
In protein supplementation studies of the present data, diet organic matter digestibility was not related to TDMI within a study (P = 0.20), but intake responses were significantly (P < 0.001) related to ECM yield responses. The corresponding RMSE within the study were 0.384 and 0.267 kg/day, respectively. Intake responses without concomitant changes in diet digestibility have been reported in single studies in which different protein sources were used to increase the dietary protein concentration (Shingfield et al., Reference Shingfield, Jaakkola and Huhtanen2001 and Reference Shingfield, Vanhatalo and Huhtanen2003). Also the studies in sheep (Egan, Reference Egan1977; Egan and Doyle, Reference Egan and Doyle1985) and cattle (Hannah et al., Reference Hannah, Cochran, Vanzant and Harmon1991) have demonstrated that protein-stimulated intake responses are accompanied with increases in rumen fill but without consistent increases in digestibility.
In the present data, the coefficients of RDP concentration and EPD on SDMI were negative (Table 4), which also supports the view that increased supply of absorbed amino acids rather than that of RDP mediated the intake responses. Silage CP concentration had no effect on the intake responses to supplementary protein, suggesting that increased SDMI was not due to supplying more RDP. In contrast, on a low-quality hay-based diet, ruminal casein infusion elicited greater and more immediate intake response than corresponding abomasal infusion in beef steers (Bandyk et al., Reference Bandyk, Cochran, Wickersham, Titgemeyer, Farmer and Higgins2001).
Carbohydrate composition and fat supplementation
Higher SDMI of cows fed fibrous concentrates compared with starchy concentrates may be related to improved microbial digestion of NDF in the rumen, leading to a faster turnover and subsequently allowing increased intake. However, often the higher NDF digestibility with fibrous by-products can be attributed to differences in the intrinsic characteristics of concentrate fibre fraction rather than to improved forage NDF digestibility (Mayne and Gordon, Reference Mayne and Gordon1984; Huhtanen, Reference Huhtanen1988; Sutton et al., Reference Sutton, Morant, Bines, Napper and Givens1993). In the study of Huhtanen (Reference Huhtanen1988), diet NDF digestibility was markedly higher with sugar beet pulp supplements compared with barley supplements, but there were no differences in the ruminal in situ digestion kinetic parameters of forages.
The SDMI response to replacing cereal grains with fibrous by-products in the current data was at least partly associated with the lower ME concentration of fibrous supplements, and the cows attempted to compensate for this by increasing SDMI. Within a study, the concentrate ME concentration decreased by 0.0048 MJ per 1 g/kg DM increase in concentrate NDF. Using this relationship and the mean CDMI of 8.0 kg DM/day corresponds to a 3.8 MJ decrease in ME intake per 100 g/kg DM increase in concentrate NDF concentration. The predicted increase in SDMI would be 0.23 kg/day, which provides 2.5 MJ ME/day (silage D-value 680).
Total NDF intake increased linearly with increasing concentrate NDF concentration. This suggests that either rumen NDF fill was not limiting the intake of starchy concentrate diets, or more likely that the filling effect of a unit of concentrate NDF is not the same as for long forages (Mertens, Reference Mertens1994). In line with this, the NDF intake of diets containing a fibrous by-product (maize gluten meal) was markedly higher than predicted by the NDF-energy intake model presented by Mertens (Reference Mertens1994).
Estimated indigestible NDF (iNDF) concentration in concentrate was positively related to intake, whereas increased iNDF concentration in silages harvested at later stages of maturity had a strong negative effect on intake (Huhtanen et al., Reference Huhtanen, Rinne and Nousiainen2007). This indicates that iNDF from concentrates and forage has different effects on rumen fill and intake regulation. The positive relationship between concentrate iNDF concentration and SDMI also supports the view that intake responses to fibrous concentrates were mainly mediated via increased energy demand due to lower ME concentration in fibrous supplements.
SDMI decreased with increased fat concentration in the concentrate, but quantitatively the effect was not very large. Depressed SDMI with moderate increases in dietary fat concentration are likely to be related to the increased energy content rather than adverse effects on rumen digestion. Onetti and Grummer (Reference Onetti and Grummer2004) reported decreases of 0.31 and 0.36 kg in TDMI per 1%-unit increase in dietary fat concentration with tallow or calcium soaps of palm fatty acids in cows fed lucerne or maize silage-based diets. These values are slightly higher than the corresponding value (0.25 kg) derived from our data.
Benson et al. (Reference Benson, Reynolds, Humphries, Rutter and Beever2001) summarized published studies investigating the effects of abomasal infusions of fat on DM intake. Intake decreased consistently with fat infusions, the response being more pronounced for C18:2 than for C18:1 fatty acids. Ruminal effects of feeding up to 500 g/day of plant oils have been small (e.g. Shingfield et al., 2008), but strong adverse effects of fat supplementation on NDF digestibility and rumen NDF turnover were observed at high levels (67 g/kg diet DM) of rapeseed oil supplementation in cattle fed a grass silage-based diet (Tesfa, Reference Tesfa1993). The slopes of concentrate ME concentration on SDMI were similar in studies investigating the effects of concentrate carbohydrate composition and fat supplementation (−0.386 and −0.374 kg DM/MJ ME per kg DM increase in concentrate ME).
Concentrate and total DM intake index
Our objective was to predict the effects of concentrate supplementation on SDMI, combine the different concentrate factors into a CDMI index, and finally to merge SDMI (Huhtanen et al., Reference Huhtanen, Rinne and Nousiainen2007) and CDMI indexes into a single index, predicting the relative intake potential of the total diet (TDMI index). The developed TDMI index can be used to estimate the intake responses to diet changes.
Feed intake is a complex function of animal, feed and management factors, and only part of the variation in TDMI is related to diet quality. In the present data (n = 943), the overall s.d. of TDMI was 2.75 kg/day, whereas the residual s.d. after excluding the variation between experiments was only 0.95 kg/day. This clearly illustrates that most of the variation in TDMI is related to animal and management factors. Because of the large difference between study variations, we used mixed-model regression analysis to study systematically the effects of dietary factors on TDMI. Attempts to analyse these effects with simple regression methods ignoring the study effect are likely to result in erroneous statements as demonstrated elegantly by St-Pierre (Reference St-Pierre2001).
Many intake models use milk yield as an input variable (Vadiveloo and Holmes, Reference Vadiveloo and Holmes1979; Dulphy et al., Reference Dulphy, Faverdin and Jarrige1989; NRC, 2001; Keady et al., Reference Keady, Mayne, Offer and Thomas2004a), but the usefulness of such models in ration formulation may be questioned, since the final output (milk yield) is used to predict input (feed intake). These models are primarily useful in predicting intake required to sustain a given level of milk yield as stated by Keady et al. (Reference Keady, Mayne and Kilpatrick2004b). It should also be remembered that milk yield is not known at the time of prediction (Ingvartsen, Reference Ingvartsen1994). Furthermore, milk output used as an input variable in prediction models is always a combination of animal and diet characteristics as indicated by the high correlation coefficient (0.78, n = 943) between the TDMI index and ECM yield in the present study. Diet quality affects the observed milk yield so that the effect of diet changes on feed intake will not be correctly accounted for if milk yield is also used as an input variable.
The slope of regression of TDMI on the TDMI index (0.095) was close to the default value of 0.100 for both the CMDI and TDMI index, suggesting that there were no major interactions between the index components. The regression analysis showed that the residuals of intake were not significantly related to any of the silage or concentrate parameters. When the data were classified according to ECM yield, days in milk and SDMI index, the slopes of TDMI index on intake were rather similar for all subsets, indicating that increased intake potential has a fairly uniform quantitative effect on DM intake irrespective of animal and management factors. Variability of the slope of TDMI index on TDMI between the studies (n = 202) was also relatively small (CV = 14.0%), which explains the small RMSE of the model.
The differences between calibration and cross-validation RMSE of the CDMI and TDMI indexes were marginal (Tables 6 and 7), indicating that the models were robust, i.e. the smaller the difference, the better the index performance when it is applied to a new set of data. Consistent with this, variability in the parameter values of the major components of the TDMI index (CDMI and protein supplementation, interaction between SDMI index and CDMI) was also negligible supporting the fact that the relationships between the intake and these silage parameters are rather universal. These observations concur with small variability of the forage component of the index (Huhtanen et al., Reference Huhtanen, Rinne and Nousiainen2007).
Comparison of prediction errors between the present model and other published models is difficult, because different methodologies have been used. In the study of Keady et al. (Reference Keady, Mayne and Kilpatrick2004b), the RMSE of five models ranged from 1.7 to 3.4 kg/day in predicting the DM intake of individual cows. The mean bias had a large contribution to error except for the best (Vadiveloo and Holmes, Reference Vadiveloo and Holmes1979) model. Part of the greater error of these models compared with our model is due to using individual cow data and not excluding variation between studies. On the other hand, most of the models compared included milk yield as an input variable in the model and some also stage of lactation, which should at least partly account for variation between studies. In our data, the residual variance decreased proportionally 0.20 (RMSE = 0.33 kg/day) when the ECM yield was used as a second independent variable together with the TDMI index.
In the feeding system applied in the UK (feed into milk), prediction of TDMI is based on the forage intake potential determined by near infrared spectroscopy (NIRS) (reference values from growing cattle) and multiple regression equation including additional parameters for CDMI, interaction between forage intake potential and CDMI, CCP, forage starch, milk energy output, condition score and stage of lactation (Keady et al., Reference Keady, Mayne, Offer and Thomas2004a). Basically our approach was similar, except that the relative silage intake potential (SDMI index) is derived from systematic studies with dairy cows investigating different factors affecting SDMI (Huhtanen et al., Reference Huhtanen, Rinne and Nousiainen2007).
The RMSE of the model by Keady et al. (Reference Keady, Mayne, Offer and Thomas2004a) tested using treatment means data (n = 34) was 0.81 kg/day for grass silage-based diets. Variation between studies was not excluded in their analysis, but animal factors included in their model should partly account for this variation. Although the R 2 values were good (0.69 and 0.76) when tested against two sets of independent data (Agnew et al., 2001), using SDMI determined in growing cattle as the reference method for NIRS calibration is likely to increase the overall error. For example, total prediction error using the in vitro reference method was greater than in direct calibration against in vivo data, but the errors were not completely additive (Nousiainen, 2004). The robustness of NIRS models is essentially dependent on the biological validity of the reference method.
Conclusions and implications
A relative total diet DM intake index model was developed to extend the relative SDMI index to account for the effects of concentrate supplementation on silage and TDMI of dairy cows. The concentrate part of the model included linear and quadratic effects of concentrate DM and CP intake, concentrate quality (NDF and fat concentrations, and EPD), and interaction between the amount of concentrate and silage intake potential. The concentrate model predicted the differences in SDMI within a study precisely as indicated by low RMSE. The relative TDMI index was created by combining the effects of silage intake potential and the effects of concentrate supplementation. The quantitative intake response to one unit change in the TDMI index (0.095 kg) was close to the default value (0.100 kg), indicating that the effects of index components on intake were additive and that there were no major interactions between the model factors. The calibration RMSE within the study was 0.37 kg/day and the cross-validation RMSE was only slightly greater than the calibration RMSE, indicating that the model is robust. The weakness of our model is that it does not predict actual intake, but rather responses to changes in diet variables. However, the model does allow the effect of dietary factors on intake to be predicted accurately, thereby facilitating the prediction of animal factors on intake. The model will improve current ration formulation systems by enabling the prediction of quantitative intake responses, and consequently responses to changes in the nutrient supply, which are prerequisites for any economical model in optimizing milk production in various farming systems.
Acknowledgements
We are grateful to all our colleagues, especially M.Sc. Terttu Heikkilä, who provided information of the unpublished experiments included in the data set.