The age at menarche (AM) is an important marker of human development. Improved nutrition and a lower disease burden are associated with earlier menarche in populations of women.Footnote 1 Secular trends in the mean age at menarche (MAM) of a population can therefore serve as an indication of changes in the standard of living. Various studies have analysed a downward trend in the AM and associate this with improved living standards for several countries.Footnote 2
China has experienced high rates of economic growth since it launched economic reform in 1980. Economic growth had remained low throughout the period from the 1950s through the 1970s, but then real per capita GDP increased almost eight times between 1980 and 2010.Footnote 3 Income inequality also increased significantly, indicating that the social benefits associated with economic growth were not widely shared.Footnote 4 Doubts exist about the accuracy of China's national accounts data, particularly data reported before China stopped using the Material Product System in 1992.Footnote 5 In addition, 40 to 45 per cent of China's economic growth took the form of fixed capital formation on the expenditure side,Footnote 6 rather than household and public expenditure on items associated with changes in anthropometric indicators, such as food consumption, healthcare and medical services. In other words, GDP per capita is not necessarily a broad indicator of the average living standard in China and it is therefore necessary to probe alternative indicators.
Some studies have used anthropometric data, particularly average heights of children and adults, to shed systematic light on trends in China's welfare.Footnote 7 This study uses an alternative anthropometric indicator – age of menarche – to establish whether, and to what extent, high economic growth in China since 1980 corresponds with an increase in the biological standard of living, as measured by earlier menarche, and to what degree available data on menarche allow an analysis of longer-term changes in living standards. This indicator is worth analysing because height and menarche are not necessarily determined by the same factors.
The article also explores some reasons for the long-term changes in AM, particularly changes in hygiene and healthcare during infancy, childhood and adolescence, and food consumption.Footnote 8 Several studies associate earlier AM with negative health implications, such as breast cancer, obesity and cardiovascular disease.Footnote 9 Hence, decreasing AM is not necessarily an indication of improved health. However, such maladies are generally associated with affluence. As earlier menarche has in broad terms been linked with factors such as more and better nutrition, a lower disease burden, better healthcare and a lower physical workload in childhood, it should not be controversial that these conditions are associated with higher living standards.
Next, this article discusses the MAM data from regional studies in China for girls born over the course of more than a century, and the impressions that can be gleaned from them. It then provides an explanation of the two nationwide datasets used in this article to assess MAM trends from 1925 to 2003, and compares the estimates with those of other studies which use national datasets for shorter time periods. The fourth section analyses changes in the context of changed biological living standards in China, particularly changes in education, health care and food supply.
Secular Changes in the Age at Menarche
Various studies have demonstrated that the MAM decreases in countries that experience economic growth and improved levels of nutrition and general health. In European countries, the MAM decreased by approximately four months per decade from the 1830s to the 1950s, before decelerating.Footnote 10 Studies of Asian countries have found the same, although Kitae Sohn found a much faster decrease in the MAM for South Korea.Footnote 11 The MAMs in several Asian countries with advanced levels of development are now among the lowest in the world, such as 11.5 years in Hong Kong.Footnote 12
Medical studies based on small samples of women yielded the earliest estimates of the MAM in China. These surveys were conducted in the first half of the 20th century in relatively affluent urban areas, particularly Beijing, Shanghai and Guangzhou. Appendix Table A1 in the online supplementary material to this article comprises the outcomes of almost all published studies that contain such data. These outcomes are summarized by average birth years in Figure 1.
Mean Age at Menarche from Regional Surveys in China, 1877–2002

The first MAM estimate for China (16.5 years) was made in 1899 on the basis of an occasional survey of 50 women born during the 1880s by a physician at the French embassy in Beijing.Footnote 13 The estimate is relatively high but comparable to that of 16.5 for ethnic Chinese women in the 1870s in Cholon (Ho Chi Minh City, Vietnam), 16.2–16.7 for women in Taiwan around 1905, 17.1 for Chinese women born in Tai'an 泰安 city (Shandong province) in the 1890s, and 16.5 for women born in Anhui and across China in the mid-1940s.Footnote 14
The earliest estimates of consistent changes in the MAM were based on the recollections of women from Jiangsu and Zhejiang provinces who attended hospitals in Shanghai, Ningbo and Nanjing. The result of 15.3 years for those born in 1877 was based on a sample of just eight women. The sample size was higher for later birth cohorts, and the study reveals a decrease in the MAM to 14.1 for those born in 1920.Footnote 15
Based on the results of occasional surveys conducted in 1925 in Guangdong, in 1960 in Hebei province, and the outcomes of the 1980–1981 and 1985 national surveys (see Table A1), the MAM in rural parts of China was 5–15 per cent higher than in urban Beijing. Hence, the MAM for women born during the early 1880s in China as a whole may have been 17 to 17.5 years. This is not unreasonably high. James Wood lists MAMs of 18.0–18.6 in the rural highlands of Papua New Guinea and among the high altitudes of Nepal in the 1960s–1980s.Footnote 16 Heidi Danker-Hopfe and Andreas Lehmann and Christiane Scheffler report similar numbers for less-developed parts of Europe in the early 19th century, particularly Norway, Denmark and Switzerland.Footnote 17
Several occasional studies based on small samples and with regional significance yielded MAMs for the 1930s–1960s birth years, as Figure 1 shows. Together with the 16.5 estimate for the MAM in Beijing in the 1880s, and the associated estimate of 17–17.5 for China as a whole, these MAMs suggest a decrease. This is consistent with the fact that average heights of adult men employed by government enterprises and agencies across China increased from 166.2 cm for 1880s' birth cohorts to 168.0 cm for 1920s' cohorts.Footnote 18 Another dataset saw adult heights of 164.1 cm for men born in the early 1880s increase to 170.6 cm for those born in the early 1910s; for adult women, average heights increased from 155.9 cm for those born in the early 1880s to 159.6 cm for those born in the early 1920s.Footnote 19 These results are also consistent with the fact that real wages in Beijing almost doubled from the early 1870s to the early 1900s.Footnote 20 The significant decrease in the MAM from the 1880s to the 1900s in Figure 1 points to a similar increase in the biological living standards in Beijing.
The MAMs of women born in the period between the 1900s and 1930s and surveyed in the cities of Beijing, Shanghai, Guangzhou, Wuchang 武昌, Nanjing, Suzhou 苏州 and Changsha remained broadly within a band of 14 to 15 years. The longitudinal estimates from Shanghai in Figure 1 demonstrate that the MAM decreased from 15.0 for women born in the mid-1930s to 14.5 for those born in the city in the mid-1940s. Occasional regional studies, as well as the longitudinal cases of Tai'an city, the Pudong 浦东 suburb of Shanghai, rural Anhui province, and Zhejiang and Jiangsu provinces, all suggest that the MAM decreased significantly for women born after the 1940s.
No regional studies were published during the chaotic years between 1963 and 1977. The renewed interest in menarcheal age was possibly related to concerns about overpopulation in China and preparations in 1978–1979 for a new demographic programme, the one-child policy. Preparations may have required up-to-date and more representative indications of the AM, as well as of fecundity, nuptiality and fertility. In January 1978, at a large national conference on regional obstetrics and gynaecology in Jinan, Shandong province, participants presented MAM estimates based on administrative data for different parts of China.Footnote 21
In that context, Ye Gongshao and colleagues published the results of their 1963–1964 Beijing survey, 15 years after it was conducted.Footnote 22 And, in 1984, the National Coordinating Group on Menstrual Patterns, led by Zhang Qi-ben and colleagues, published the results of the first 1978–1980 national survey involving over 130,000 girls and young women.Footnote 23 The methodology of this large survey was updated, and it became known as the National Survey on the Constitution and Health of Students (NSCHS), which has since been repeated every five years.Footnote 24
Independently, Cui Meiying and colleagues published results from their 1980–1981 occasional national survey of 11,600 girls and young women across 13 ethnic groups in different parts of the country.Footnote 25 The results revealed for the first time very significant differences in MAMs across urban and rural regions, with the MAM in Beijing being much lower than in other parts of the country. The outcomes of the larger NSCHS rounds later confirmed this. Together, they pointed to an uneven geographic distribution of AM across provinces and between rural and urban areas.
Most MAM estimates from occasional regional studies and from the NSCHS use the status quo (SQ) methodology. The NSCHS rounds now allow the analysis of trends between 1979 and 2010; however, they do not allow a retrospective reconstruction of historical trends, nor an answer to the question whether change in the MAM since 1979 was a continuation of time trends before the 1980s, or a reflection of improving conditions since 1979. This question can be addressed with surveys or administrative data that use the recollection (Rec) methodology.
The outcomes of Rec-based studies may be biased for two reasons: (a) selective memory among surveyed women, and (b) sample survival. The first issue has been researched extensively and has some ground in theory. However, empirical research suggests that both methods yield consistent results.Footnote 26 After all, menarche is a lifetime biomarker that few women fail to recall. For China, Cui et al. used both the SQ and Rec methods.Footnote 27 Appendix Table A1 shows that the results are marginally different. However, for large samples the difference is minimal and not big enough to discredit the Rec methodology. The second issue is that only physically healthy women survive in old age. Their lifetime physical health is correlated with relatively low AM among their age cohorts, and their survival rate reduces the standard deviation. This is a likely reason why Rec-based surveys find a flattening of the MAM going back in time.Footnote 28
The results of several Rec-based surveys in China have become available in recent years. These are either based on registration data from hospitals and women's health clinics, or on large surveys. The first was a 1988 national survey of 27,655 women.Footnote 29 It was followed by the 1993 survey conducted among 12,726 women in two rural counties in Anhui province, shown in Figure 1, and the 1997 National Demography and Reproductive Health Survey (NDRHS) of 14,679 women.Footnote 30 Yanyu Lyu and colleagues used the 1991–2008 collection of the health records, with retrospective menarche data, of 1.2 million women in Zhejiang and Jiangsu provinces, and Fang-Fang Chen, You-Fa Wang and Jie Mi together used the 1948–1954 hospital records of 3,608 women in Beijing.Footnote 31 Other retrospective surveys were conducted in 2000 among 31,955 women in Shanghai, and in 2004–2008 among over 300,000 women nationally; the latter now forms the China Kadoorie Biobank (CKBB) at the University of Oxford.Footnote 32
These databases yielded some studies into time trends of the MAM in China. Most established such trends for short periods of 25 to 30 years, and often for particular regions rather than China as a whole. A few examples may explain the difficulties of using the outcomes of such studies. An example of SQ-based research is the 2009 study by Hua-Mei Ma and colleagues, which employed a sample taken in 2003–2005 from kindergartens through to secondary schools in nine major cities of China.Footnote 33 The authors compared the MAM from this dataset with MAMs estimated on the basis of the NSCHS survey rounds since 1979 and found that the MAM decreased from 13.5 in 1979 to 12.3 in 2003–2005. However, their sample was collected only from major cities, while the NSCHS covered both urban and rural areas. The comparisons therefore overestimate the rate of decrease.
The 1999 work by Maureen Graham, Ulla Larsen and Xiping Xi is an example of a Rec-based study.Footnote 34 It collected information from women residing in just two rural counties in Anhui Province. The MAM was measured in a consistent manner, and revealed a downward trend, as Figure 1 shows. However, the survey region was too small to represent a national MAM trend.
Materials and Methods
The challenge for this article is to provide evidence for long-term changes in the MAM on the basis of more representative national data that have been collated in a consistent manner. The purpose is to augment the currently available estimates by confirming and extending them to earlier and later years. The article uses two datasets that cover the birth years 1925–1974 and 1975–2003: the China Health and Retirement Longitudinal Study (CHARLS) for older women born between 1925 and 1974, and the China Health and Nutrition Survey (CHNS) for younger women born between 1975 and 2003. The surveys employed different sampling schemes and did not cover the same geographical areas. Nevertheless, in combination they yield statistically accurate and nationally representative indications of trends in the MAM.
The CHARLS facilitates research into the elderly in China and contains panel data on people aged 45 and over. It aims to collect data from a nationally representative sample of Chinese residents. The first baseline survey (2011–2012) covered about 17,500 individuals from around 10,000 households in 450 villages or resident committees in 150 counties or districts. Respondents were drawn at the county, neighbourhood and household level in a way to make the sample nationally representative. Two more CHARLS rounds were conducted in 2013 and 2014. We only use the first and second waves, which contain menarche data.
The CHARLS contains data from mostly older women, born as far back as the 1920s. The survey asked the year or age when the respondents experienced menarche. In the first round, the year of menarche variable (a four-digit number) contained age at menarche (a one- or two-digit number), and the age at menarche variable contained the year of menarche. We corrected entries for these two variables. The second round did not have this problem, and we added only new respondents to those in the first wave. We restricted ages at menarche to 8–9-year-old girls and grouped birth years in five-year intervals. To improve precision in the MAM measurement, we selected birth cohorts with at least 100 observations. Birth years ranged from 1925 to 1974, and the sample size was 8,583.
The CHNS is an ongoing longitudinal survey and an international collaborative project. It aims to examine the effects of the health, nutrition and family planning policies and programmes implemented by national and local governments, and to examine how the social and economic transformation of Chinese society affects the health and nutritional status of its population. The CHNS started in 1989 with about 16,000 individuals, and it has since followed respondents irregularly. The survey covers nine provinces, which were selected so as to vary in geography, economic development, public resources and health indicators. The sampling scheme involved a multistage, random cluster process to identify respondents. Although the CHNS does not cover all provinces in China, it was designed to make the data representative of the population.
The CHNS asked girls whether they had ever menstruated; girls responded with either yes or no. Unfortunately, the survey did not collect information on AM from adult women, possibly because menarche is an indicator of child development. The question was asked of girls in the following age ranges for varying survey years: under 16 in 1991; 10–15 in 1993, 1997 and 2000; 8–17 in 2004, 2006, 2009 and 2011.
As the CHNS is a longitudinal panel survey, the same respondent was asked the same question several times, depending on their age. We used the answer to the question provided by each girl in her last follow-up, assuming it to be the most up-to-date information on her menarche. For example, if a girl answered “no” to the question in 1991 and 1993, but “yes” in 1997, but was not subsequently asked this question owing to survey attrition, we used the last answer for analysis. If we only used the answer in 1991, we would miss out on the information that she had not experienced menarche by 1993 but had by 1997. This method allows us to use information on AM for girls who were not continuously tracked. The dataset provides AM in years and months, and therefore to one decimal point. We use probit analysis to estimate the MAM. Because this model is appropriate for girls who are about to experience menarche, we restrict the ages to 8–19 years old. The sample size is 3,159. We group the sample by five birth years, except the last cohort, as no girl born in 2004 was included.
Obviously, this article derived information on AM from two methodologically different surveys. As mentioned, the respective Rec and SQ methodologies can be expected to generate consistent results.
Results
Table 1 shows that the MAM was 15.88 for women in the 1925–1929 cohort, particularly in rural areas. This is relatively high but consistent with the regional estimates of the 1930s in Figure 1. For those in the birth cohorts spanning between 1925 and 1944, the MAM increased marginally, indicative of the difficult living conditions during infancy and childhood, likely related to the civil war and war against the Japanese, as well during adolescence in the 1950s. The MAM increased particularly in rural areas, while it decreased by half a year in urban areas. The MAM of the 1945–1949 cohort spiked in both urban and rural areas, possibly owing to hardship during China's civil war, hyperinflation and the 1949 crop failure, but this spike is more likely related to the severe 1959–1962 famine. The latter affected this cohort of girls during puberty, delaying maturation. From a peak of 16.25 for the 1945–1949 cohort, the MAM decreased continuously in both urban and rural areas, to an average of 14.74 for the 1970–1974 cohort. This is an average decrease of 0.61 (= (16.25–14.74) / 2.5) year per decade, corresponding with several of the regional data in Figure 1.
Mean Age at Menarche in China, CHARLS and CHNS Datasets, 1925–2003

Sources:
Calculated from data of the China Health and Retirement Longitudinal Study (CHARLS), http://charls.pku.edu.cn/en, and the China Health and Nutrition Survey (CHNS), http://www.cpc.unc.edu/projects/china.
Notes:
MAM = mean age at menarche, CI = confidence interval. CHARLS result for 1975–1979 is not included, owing to low number of observations (26, MAM = 14.85).
The MAM decreased from 13.69 years for the 1975–1979 cohort to 12.12 years for the 2000–2003 cohort. This is a rate of 0.63 (= (13.69–12.12) / 2.5) year per decade. The trend is generally downwards, but not monotonic. Between the 1975–1979 cohort and the 1980–1984 cohort, the MAM increased, particularly in rural areas. The difference between the two values for both birth cohorts is statistically significant. Considering improvements in per capita food consumption from 1978 onwards (see below), we would expect a downward MAM trend, which is not the case. We hypothesize that this reflects a survival bias concerning girls born between 1975 and 1979 in rural areas for two reasons.
First, average living standards were still low, especially in rural areas. Only healthy children tended to survive in those conditions. Second, the son preference among families in China implies that family resources may have been distributed against girls, particularly in areas where improvements in living standards were slow to take hold.Footnote 35 It seems likely that these two forces affected particularly the older cohorts in both surveys, and left only healthy girls to live long enough to participate in the surveys. As healthy girls generally experience menarche early, the MAM of the 1975–1979 CHNS cohort may probably be biased downwards. If relatively unhealthy girls had survived to a greater degree and had participated in the survey, the MAM would have been higher, because they would have experienced menarche later. Notably, the average decrease in the MAM was the same from 1944–1949 to 2000–2003. This indicates that the decrease was not necessarily related to the acceleration of economic growth since 1980, but rather that it started well before this time. It also indicates that GDP per capita is an imperfect indicator of changes in living standards, at least in post-war China.
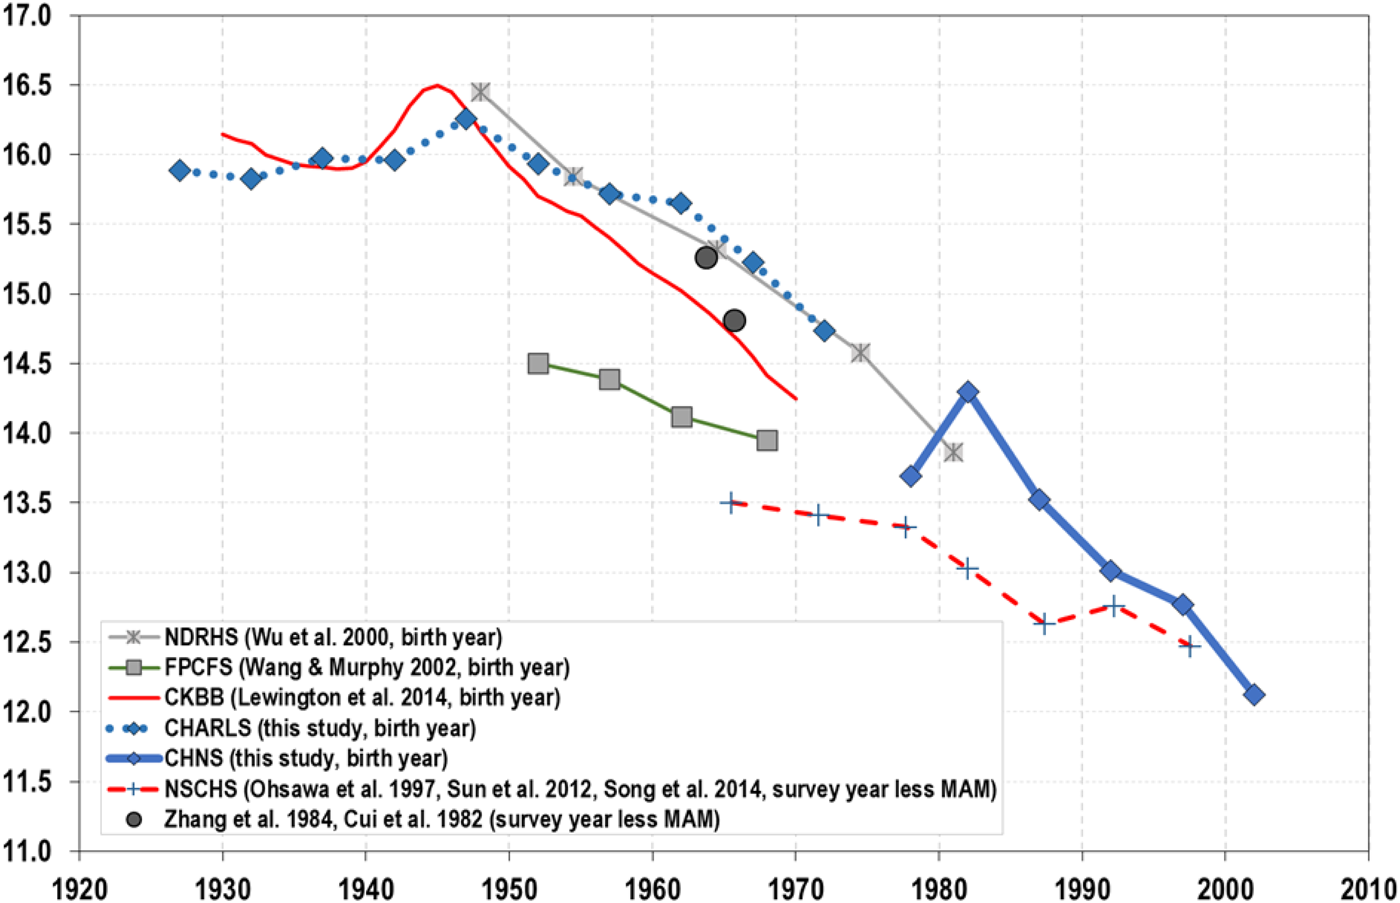
Figure 2 shows all the MAM time series from national surveys conducted in China and compares them with our estimates. In broad terms, the series reveal similar trends since the mid-1920s: stagnation until a peak in the late-1940s, followed by a continuous decrease to the early 2000s. There are a few notable differences.
Mean Age at Menarche from National Surveys in China, 1925–2003

First, the levels (not the trend) of the Family Planning Commission Fertility Survey (FPCFS) are much lower. This is because Duolao Wang and Michael Murphy's study estimated the MAM after controlling for education, occupation and region of residence of women in the sample in order to standardize the sample across birth years.Footnote 36 While this helps to narrow down explanatory factors, this adjustment complicates level comparisons with other surveys.
Second, Figure 2 includes SQ-based estimates of the MAM from the quinquennial NSCHS for approximated average birth years (survey year less MAM). The results for 1979, 1985, 1991 and 1995 are significantly lower than ours. The reason is that the NSCHS is based on surveys conducted at schools in China. Between 1978 and 1990, a significant but decreasing proportion of children enrolled at primary schools did not complete their education. On average, 65 per cent of primary school students continued to complete junior high school, and only 14 per cent of them completed senior high school.Footnote 37 Consequently, the NSCHS surveyed girls at junior and senior high schools, but did not capture the 35 per cent of girls who did not continue to junior high school and the 86 per cent who did not reach senior high school. In 1986, China promulgated the Law on Nine-Year Compulsory Education. However, no strict penalties on non-compliance were imposed on parents and it took until 2011 for nine-year universal education to be achieved.Footnote 38 As there is generally a negative correlation between educational attainment and AM, the NSCHS results have long been biased against girls with higher AM, and the MAM is therefore too low.
Third, the differences between the CKBB results and ours are most likely caused by the fact that the CKBB uses annual averages, while our estimates are quinquennial averages, represented in Figure 2 by the mid-year. Other differences are relatively minor and most likely owing to differences in sample sizes, as well as sample biases in terms of urban/rural balance, regions and socio-economic groups represented in each sample.
The spikes in the MAM for women born during the late 1940s in the CKBB and CHARLS shown in Figure 2 confirm the results for Shanghai and Beijing in Figure 1. As mentioned, this is possibly related to the hardship during the late 1940s and during the 1959–1962 famine period. This famine came at a time when the 1945–1949 birth cohort was due to experience menarche. Nutritional deficits in adolescence delayed the release of relevant hormones and the onset of menarche. The subsequent recovery and further decrease of the MAM for women born since 1950 is reflected in all series in Figure 2, and also in Figure 1. The start and pace of the decreases in Figure 1 may have differed, reflecting regional variation in the moments when living standards started to improve, whether the MAMs reflected urban or rural trends, and possibly sample bias in the surveys. Nevertheless, the decrease in the MAM clearly preceded the decreases recorded by the CKBB.
The NDRHS outcomes in Figure 2 overlap significantly with our estimates based on the CHARLS and CHNS, and the three outcomes combined suggest a continuous decrease from a peak of 16.3 (1947) and 16.5 (1948), to a low of 12.1 (2002) in the early 2000s, despite the setback experienced in the late 1970s. Altogether, this is a decrease of, on average, 0.78 years, or just over nine months per decade. This is almost as fast as in South Korea.Footnote 39
Other studies have, on the basis of the 1985 and 1991 NHCHS rounds, claimed that the MAM trend in China was downward, but at a decreasing rate.Footnote 40 Our results show no sign of deceleration of the MAM. Rather, it accelerates over time if we include the 1975–1979 birth cohort. Alternatively, it decreases linearly if we exclude this birth cohort. It is significant to observe no sign of a slowdown in the trend, despite the MAM in China dropping to 12.1 for the 2001–2003 birth cohort, which is comparable to 12.3 and 12.1 years for birth cohorts of the early 1990s in Hong Kong and Taiwan,Footnote 41 and similar to the lowest MAM in Western countries, where the decreasing trend in the MAM has levelled off.Footnote 42 The wide confidence interval in Table 1 for the 2001–2003 cohort warns against hasty conclusions, but it seems that the MAM in China may decrease further.
Improvements in Living Standards and MAM
There is no agreement in the relevant literature as to exactly what factors influence AM, and in what order of significance. Strands of research have pointed to genetics, prenatal conditions in the mother's uterus, nutritional habits and requirements, nutrition (quantity and quality), reduced disease environment during infancy, childhood and adolescence owing to improvements in hygiene and healthcare, physical exercise, and even climate.Footnote 43 With applications to China, recent studies have established that physical fitness is associated with a lower MAM; birth weight and obesity during childhood and adolescence are negatively correlated with the MAM; and good father–daughter relations and/or stress in the household are negatively correlated with the MAM.Footnote 44 These studies are generally based on small samples. They are difficult to replicate or to confirm for larger populations, as the available large datasets generally do not contain the relevant variables.
Studies seeking to explain longitudinal changes in the MAM cover similar terrain to studies into long-term changes in infant mortality rates (IMR) or child mortality rates (CMR). Ta Chen found that the pre-war IMR in China was a high 275 in 1934.Footnote 45 This implies a very high CMR of around 350 to 400. Figure 3 confirms that in the 1950s, the IMR and CMR had both decreased but were still very high in China, and that they decreased further from the 1950s to the 1980s. Kimberly Babiarz and colleagues studied this decrease and the associated rapid increase in life expectancy at birth from about 35–40 years in 1949 to an average of 65.5 years in 1980.Footnote 46 They also analysed explanations for this decline in mortality, such as the expansion of primary healthcare services. Figure 3 shows the availability of hospital beds and medical personnel per person. These crude indicators confirm that China as a whole made significant progress in providing healthcare, despite a setback in the supply of medical personnel between 1966 and 1970. Other explanations refer to widespread public health campaigns, improvements in water, sanitation, nutrition and gains in educational attainment.
Indicators of Changes in Healthcare in China, 1949–2015

Babiarz and her colleagues tested these explanations statistically to conclude that the expansion of education during the 1950s, together with large-scale public health campaigns, explains roughly 50 to 70 per cent of the reduction in China's IMR and CMR.Footnote 47 They associate this decrease with the “lagged, lifelong effects of gains in educational attainment” in the context of studies that identify higher infant and child survival among more educated mothers, and note that public health interventions complemented gains in general education.Footnote 48 Consequently, daughters may not only have benefited from the improved education and increased public health campaigns directed at their mothers since the 1950s during infancy and childhood in the form of the lower IMR and CMR, but possibly also during adolescence, as reflected by the decreasing MAM. Other studies have indicated that access to education and healthcare continued to improve for later generations of Chinese girls and future mothers.Footnote 49
Babiarz and colleagues may have identified only a partial explanation for the decreasing MAM, as their study used regional school enrolment data which were not corrected for actual school attendance. Even after the introduction of the compulsory education law in 1986, partial attendance was common and many failed to complete nine years of education. This is likely to have been a bigger issue during the 1950s and 1960s. Consequently, an explanatory factor that Babiarz and colleagues did not account for may be relevant: food supply. This is not directly relevant to the mortality of infants and children, as shortfalls in food supply will first of all manifest themselves in stunted growth and reduced resistance to childhood diseases, rather than mortality. However, shortfalls in food supply would have had a negative impact on growth during infancy and childhood, and the AM of girls.
Figure 4 shows per capita availability of calories per day in China. This indicator takes no account of uneven distributions of food across regions and socio-economic groups. Nevertheless, it has relevance to the nationwide estimates of the MAM in Figure 2. Depending on average body size, physical activity, ambient temperature, and the age-sex distribution of the population, average nutritional requirements may have varied over time, but would have been around 1,900 Kcal per day per person.Footnote 50 Except for 1955–1958, average food supplies in China were well below that level until 1973, particularly during the late 1940s and the 1959–1962 famine.Footnote 51 In light of the preference for sons in Chinese families, it seems likely that the biological maturation of girls would have suffered to a greater degree than for boys during those years of limited food supplies. This is confirmed by the differentials in average heights of birth cohorts for these years.Footnote 52
Per Capita Food Supply in China, 1946–2013 (Kcal per day)

We use the CHARLS data to test health and nutritional factors that may help to explain trends in the MAM in China. The CHARLS Wave 3 of 2014 contains information on socio-economic status during childhood. We used this to determine whether older Chinese women experienced earlier menarche if they benefited from better nutrition, health and healthcare during childhood. This relationship is well known across space and time.Footnote 53 But, it is rare to find a study that estimates this relationship for a nationally representative sample of older women on the basis of childhood information, especially for China. For example, Graham, Larsen and Xi regressed AM on individual characteristics, but their survey covered just two rural counties in Anhui and relied on current, rather than childhood, information.Footnote 54
The dependent variable in the CHARLS is the answer to the question, “How old were you when you first had a menstrual period?” The respondent selected one of the following: less than 11 years old; between 11 and 12; between 13 and 15; between 16 and 18; and older than 18. We transformed the discrete variable into a continuous one by assigning 10, 11.5, 14, 17 and 19, respectively, to these categories. We regressed this variable on selected independent variables that reflect socio-economic status during childhood. Education is a typical variable because a high level of education indicates that a family could survive without the additional income from a daughter during childhood and adolescence. We used self-reported health status before the age of 15 compared to other children of the same age. The respondent chose one of the following categories: much healthier; somewhat healthier; about average; somewhat less healthy; and much less healthy. Since the proportions of the two extreme categories were small, we combined the first two and the last two categories, and we did the same with similarly phrased answers to other questions. We included two proxies for healthcare. One was whether the respondent received any vaccinations before 15 years of age (yes or no); the other was whether the respondent had always had a usual source of medical care such as a doctor, nurse or healthcare centre (yes or no). Since AM decreased over time, we controlled for birth decades.
In addition to education and health, we considered variables directly related to the family's socio-economic status. We included a variable that asked whether there was a time when the family did not have enough food to eat before the girl was 17 years old (yes or no). Besides poverty, we assessed the family's overall wealth by considering the family's financial situation before the girl turned 17 when compared to the average family in the same community or village. The respondents had a choice of five answers, which we aggregated into three: worse off than them; same as them; and better off than them.
The neighbourhood environment may have affected AM. We therefore used the variable that asked whether the neighbourhood where the respondent lived as a child was clean and attractive. Respondents chose one of the following four categories: very clean and attractive; somewhat clean and attractive; not very clean and attractive; and not clean and attractive at all. We dichotomized this variable by aggregating the first two and the last two. Although these variables provided information on the environment during childhood, the details were recalled after several decades. Measurement error may therefore be substantial.
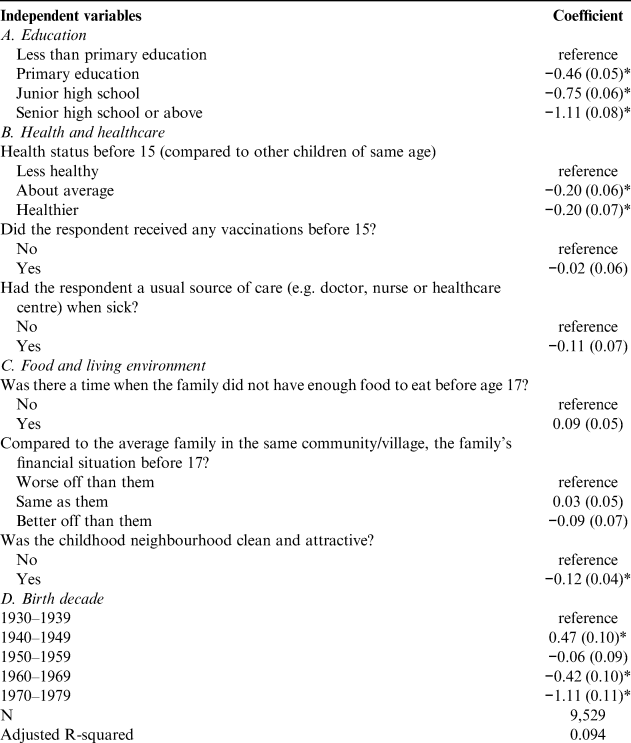
The results in Table 2 confirm our expectations, although some coefficients are not statistically significant. Section A confirms the implication of the findings of Babiarz and her colleagues of a statistically significant negative correlation between the MAM and educational attainment. Each additional year of education reduced the MAM by about one month, so that completion of senior high school reduced the MAM by 1.1 year. As the MAM decreased from 16.3 for the 1945–1949 cohort to 14.7 for the 1970–1974 cohort, improved education explains about 70 per cent (1.1 / (16.3–14.7)) of the decrease in the MAM.
Analysis of Age at Menarche and Childhood Background, 1930–1979

Source:
Calculated from China Health and Retirement Longitudinal Study (CHARLS).
Notes:
* = p-value < 0.05. OLS Dependent variable: recalled age at menarche. Continuous age at menarche was created from five categories as follows: if less than 11 years old, 10 years; if between 11 and 12 years old, 11.5 years; if between 13 and 15 years old, 14 years; if between 16 and 18 years old, 17 years; and if older than 18, 19 years. Birth years restricted to 1930–1979.
Good health during childhood and adolescence made a small but statistically significant contribution to lowering the MAM. Both vaccinations and access to healthcare lowered the MAM by a small amount, but the coefficients were not statistically significant. Selective memory and/or the unavailability of details on the frequency and nature of health interventions during childhood may have limited statistical significance. Likewise, food shortages during childhood and adolescence increased the MAM somewhat, but the coefficient is not statistically significant. Here, too, selective memory of the details and/or frequency and nature of episodes of inadequate nutrition may have impacted the results. In addition, the rate at which girls matured may have recovered somewhat after episodes of illness or food shortages owing to possible catch-up growth under conditions of improved health and nutrition at a later stage. The memory of growing up in a clean and attractive childhood neighbourhood contributed to lowering the MAM, but to a small degree only.
Conclusion
This article provides an overview of the available evidence on long-term changes in the mean age at menarche of women in China. The evidence covers a period of more than a hundred years and comprises studies of both locally accumulated and occasional surveys, as well as analyses of nationwide and repeated surveys. The broad impression is that the MAM was quite high in China until the 1950s: it was lower in urban areas, at about 16 years, than in rural areas, where it stood at around 17 years, possibly higher. The MAM is likely to have decreased in the main urban areas of China before the Second World War, particularly in Beijing. But that impression may be affected by the likely fact that surveys at that time interviewed girls and women whose families could afford to attend medical facilities in urban areas, when most girls grew up in rural households. More representative national data confirm that the MAM for most women born in China in the 1920s and 1930s remained at 16 to 17 years of age. Women born in the 1940s experienced an increased MAM of 16.5 years. This was partially owing to the difficult conditions during their infancy, caused by the war against Japan and the civil war of the 1940s, but more likely was owing to the food shortages associated with the 1959–1962 famine that affected these women during adolescence and delayed their AM. For women born after the 1940s, the MAM decreased at a consistent and relatively high rate, from 16.5 for women born in the 1940s to 12.1 for those born in 2000–2003.
The decrease in the MAM started well before the acceleration of economic growth after 1980. Further analysis suggests that the improvement in educational opportunities for girls explains most of the decrease in the MAM, at least until the early 1970s. It is possible that the expansion and improvement of education facilities during the 1950s and 1960s, in combination with large-scale public health campaigns, increased awareness of ways to avoid infant and childhood illnesses that would otherwise have caused death and stunting; these factors would have contributed to a decrease in the MAM. Macro data suggest that improved medical facilities and increased food supply must have also been a contributing factor, but selective memory among survey participants of the significance of these factors makes it difficult to be conclusive. Since the 1970s, general improvements in living standards in addition to further improvements in education, health and nutrition may have sustained the further decrease of the MAM in China.
Supplementary material
Supplementary material is available online at https://doi.org/10.1017/S0305741019000432.
Acknowledgements
This research uses data from China Health and Nutrition Survey (CHNS). The authors thank the organizations that provided financial support for the CHNS data collection. They also thank Dr Lyu Yanyu (Capital Institute of Pediatrics, Beijing) for making results of her 2014 study available. Pierre van der Eng acknowledges support provided by the Visiting Scholars Program of the Data Center of Management Science at the Institute of Social Science Survey of Peking University (China).
Biographical notes
Pierre VAN DER ENG is associate professor in international business at the Australian National University. His published research ranges across economic history business history, international business and development economics, and includes historical anthropometrics, particularly in relation to Indonesia.
Kitae SOHN is assistant professor in economics at Konkuk University. He is a labour economist with special interests in health, education, family and economic history, including historical anthropometrics. His published research has analysed micro data of several countries, particularly Indonesia, the US and South Korea.