Introduction
Among the different bones that compose the vertebrate skeleton, the osteoderms (when present) are set up through an integumentary ossification of the dermis (Gilbert et al. Reference Gilbert, Loredo, Brukman and Burke2001; Vickaryous and Hall Reference Vickaryous and Hall2008; Vickaryous and Sire Reference Vickaryous and Sire2009). This mechanism may be initiated in part by endothelial cell precursors that undergo endothelial-to-mesenchymal transition and further acquire an osteoblast phenotype (Dubansky and Dubansky Reference Dubansky and Dubansky2018). As the osteoderms occupy an outer position along the postcranial region, the functional role of these bony elements is often claimed to be involved in defense against impinged loads (Sun and Chen Reference Sun and Chen2013; Chen et al. Reference Chen, Yang and Meyers2014; Broeckhoven et al. Reference Broeckhoven, Diedericks and Mouton2015; Du Plessis et al. Reference Du Plessis, Broeckhoven, Yadroitsev, Yadroitsava and le Roux2018). Even though this implication seems obvious when the osteoderms form a continuous shield, as in the turtles (Acrai and Wagner Reference Acrai and Wagner2013; Chen et al. Reference Chen, Yang and Meyers2015), xenarthrans (Vickaryous and Hall Reference Vickaryous and Hall2006; Chen et al. Reference Chen, Kiang, Correa, Lopeza, Chen, McKittrick and Meyers2011; Wolf et al. Reference Wolf, Kalthof and Sander2012), ankylosaurs (Scheyer and Sander Reference Scheyer and Sander2004), aetosaurs (Cerda and Desojo Reference Cerda and Desojo2011), squamates (Anguidae; Zylberberg and Castanet Reference Zylberberg and Castanet1985; Anjan and Bhullar Reference Anjan and Bhullar2008; Bochaton et al. Reference Bochaton, de Buffrénil, Lemoine, Bailon and Ineich2013), “armored fishes” (Yang et al. Reference Yang, Chen, Gludovatz, Zimmermann, Ritchie and Meyers2013a, Reference Yang, Gludovatz, Zimmermann, Bale, Ritchie and Meyers2013b), and crocodilians (Trutnau and Sommerlad Reference Trutnau and Sommerlad2006), it is more controversial in some other taxa in which the osteoderms consist of a few anterior–posterior rows: chondrosteans (Burdak Reference Burdak, Meunier and Sire1986), the early crocodylomorphs (Nesbitt Reference Nesbitt2011; Irmis et al. Reference Irmis, Nesbitt and Sues2013), and thyreophoran dinosaurs (Main et al. Reference Main, Ricqlès, Horner and Padian2005). In this regard, because the osteoderms provide a vascular proliferation in the dermis (Clarac et al. Reference Clarac, de Buffrénil, Cubo and Quilhac2018), it has been assumed that these bones may also be involved in different physiological functions, such as the acidosis buffering during apnea in semiaquatic taxa (turtles and crocodilians; Jackson and Heisler Reference Jackson and Heisler1982; Jackson Reference Jackson2000; Jackson et al. Reference Jackson, Goldberger, Visuri and Armstrong1999, Reference Jackson, Crocker and Ultsch2000a, Reference Jackson, Ramsey, Paulson, Crocker and Ultsch2000b, Reference Jackson, Andrade and Abe2003) and heat exchanges in both large ectothermic vertebrates (crocodilians) and ornithischian dinosaurs (Seidel Reference Seidel1979; Farlow et al. Reference Farlow, Hayashi and Tattersall2010). Nonetheless, because the dermal bones (both the dermatocranium—i.e., the part of the skull composed of dermal bones—and the osteoderms) usually show a pronounced superficial ornamentation (a repetitive pattern often made of pits separated by ridges; Bystrow Reference Bystrow1935; Iordansky Reference Iordansky and Gans1973; Scheyer et al. Reference Scheyer, Sander, Joyce, Böhme and Witzel2007, Reference Scheyer, Mörs and Einarsson.2012; Burns et al. Reference Burns, Vickaryous and Currie2013) within most taxa that present a well-developed integumentary shield (mentioned earlier), it has been proposed that this feature may play a role in dermal bone mechanical resistance by modifying the stress distribution, as its presence changes the surface, the volume, and, consequently, the mass of the bone (Coldiron Reference Coldiron1974; Rinehart and Lucas Reference Rinehart, Lucas, Tanner, Spielmann and Lucas2013). Therefore, because the crocodilian osteoderms show a well-developed bone ornamentation (made of resorbed pits and grooves; Buffrénil Reference Buffrénil1982; Buffrénil et al. Reference Buffrénil, Clarac, Fau, Martin, Martin, Pellé and Laurin2015), they consequently present a good model to test whether the presence of bone ornamentation modifies the dermal bone strengthening. Moreover, among Pseudosuchia (crocodylomorphs and their close relatives) there exist a wide diversity of osteoderm morphological patterns, as these bony plates may be isolated as well as either juxtaposed or articulated in longitudinal rows (Ross and Mayer Reference Ross, Mayer and Rhodin1983; Burns et al. Reference Burns, Vickaryous and Currie2013). Each individual osteoderm happens to present a dorsal keel or a spike and a variable degree of ornamental pit excavation (Clarac et al. Reference Clarac, Souter, Cornette, Cubo and de Buffrénil2015). For instance, there are two dorsal columns of paramedian osteoderms running from the back of the head along the midline of the body, showing either a radiating or vertical pitted shallow sculpture pattern in the protosuchids and erpetosuchids (Kälin Reference Kälin and Piveteau1955; Benton and Walker Reference Benton and Walker2002), whereas there are more than two dorsal columns of paramedian and lateral articulating osteoderms that form a dorsal (sometimes also ventral) carapace in Aetosauria (Long and Ballew Reference Long, Ballew, Colbert and Johnson1985; Heckert et al. Reference Heckert, Fraser and Schneider2017; Desojo et al. Reference Desojo, Heckert, Martz, Parker, Schoch, Small, Sulej, Nesbitt, Desojo and Irmis2013; Schoch and Desojo Reference Schoch and Desojo2016). In phytosaurs, which are either considered as pseudosuchians or as the archosaurs’ sister taxon (Nesbitt Reference Nesbitt2011), the dorsal surface is covered with multiple diamond-shaped or roughly triangular osteoderms arranged in two paramedian rows. Those osteoderms often have a dorsal surface that is covered with patterns of ridges and grooves surrounding a central keel. Additional osteoderms loosely cover the appendicular skeleton, as in some extant crocodilians (Ross and Mayer Reference Ross, Mayer and Rhodin1983), while the phytosaurs present a unique structure among archosauriforms: multiple osteoderms overlapping and interlocking under the throat, the so-called gular shield (Stocker and Butler 2013; Scheyer et al. Reference Scheyer, Desojo and Cerda2014).
The main purpose of this paper is therefore to test whether the apical ornamentation may play a role in terms of load-bearing capacity and mechanical strength of the osteoderm. To this end, we used numerical modeling and simulation to investigate the stress distribution induced in the osteoderm by a predator attack. The effect of the ornamentation was thus assessed by comparing the results obtained on three-dimensional (3D) models of actual (ornamented) and smoothed (nonornamented) osteoderms.
In the following section we will describe the samples considered in this study and the numerical models developed. Then we will present qualitative and quantitative results obtained through our numerical simulations for both actual and smoothed osteoderms. The last section will be devoted to discussing and comparing these results and to drawing some conclusions on the mechanical effects of the ornamentation in order to decipher its functional implication(s) (at least in Crocodylomorpha).
Material and Methods
Biological Sampling
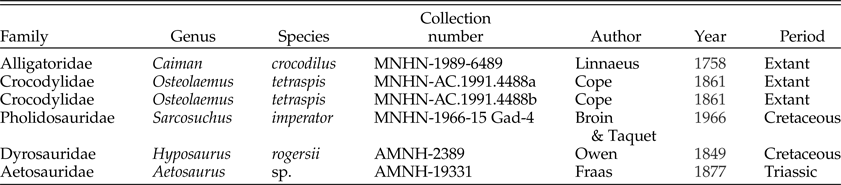
The sample includes five crocodylomorph osteoderms and one aetosaur osteoderm (Table 1). They include either dry bones from extant species (i.e., Osteolaemus tetraspis, Caiman crocodilus) or well-preserved fossils that trace back to the Triassic or later periods (i.e., Aetosaurus sp., Sarcosuchus imperator, Hyposaurus rogersii). We included two osteoderms from O. tetraspis in order to consider the intraspecific variability within this interspecific sample. The full set of osteoderms thus represents five different taxa showing both various global morphologies and a well-developed bone ornamentation, so the resulting analysis consists of a model that can be generalized to Crocodylomorpha. The O. tetraspis and C. crocodilus osteoderms possess a central longitudinal keel and come from the nuchal region, whereas the three other specimens are flatter and come from the dorsal shield, as they possess an articular shelf. Unlike the H.rogersii osteoderm, which is fully flat, the S.imperator osteoderm shows a keel that does not modify the osteoderm global flat shape, as its position is lateral (Sereno et al. Reference Sereno, Larsson, Sidor and Gado2001). The Aetosaurus sp. osteoderm also is unique in presenting an apical spike consisting of a local protuberance that is medial to the osteoderm midpoint and close to the posterior margin, thus also not modifying the osteoderm global flat morphology (Cerda and Desojo Reference Cerda and Desojo2011). Although we did not perform histological cross sections on our sample, we assume that all the collected osteoderm specimens possess a diploe structure (i.e., they are made up of an outer shell of compact bone embedding a core of trabecular bone), because several authors reported such a histological structure in both the neosuchian (Buffrénil et al. Reference Buffrénil, Clarac, Fau, Martin, Martin, Pellé and Laurin2015) and the aetosaur osteoderms (Cerda and Desojo Reference Cerda and Desojo2011; Desojo et al. Reference Desojo, Heckert, Martz, Parker, Schoch, Small, Sulej, Nesbitt, Desojo and Irmis2013; Scheyer et al. Reference Scheyer, Desojo and Cerda2014). Indeed, these bones consist of the superposition of three layers: a basal layer that is usually lamellar or parallel fibered, a midlayer that is cancellous and includes both primary and secondary osteons, and an apical layer made of lamellar or parallel-fibered bone that is remodeled by pit resorption and secondary bone deposit.
Sampled specimens with taxonomic references.

All the specimens were directly sampled in museum collections: the MNHN comparative anatomy and paleontology collections (Muséum National d'Histoire Naturelle, Paris, France) and the AMNH paleontology collections (American Museum of Natural History, New York, USA) (see Table 1).
Three-Dimensional Modeling
The 3D models of the osteoderms were created using the procedure described in Clarac et al. (Reference Clarac, de Buffrénil, Brochu and Cubo2017a) and outlined here. The four osteoderms from the MNHN collections were scanned with a Breuckmann StereoScan 3D-surface scanner, a device that reconstructs 3D objects using phase contrast. The bone surface is virtually reconstructed as a mesh of adjacent polygons, folded according to bone reliefs inside a 3D space. We used two scope ranges, depending on sample size, to obtain adequate mesh resolutions: a small scope range (60 mm) with a resolution of 12 μm and a medium scope range (250 mm) with a resolution of 18 μm. The four 3D objects thus obtained were exported into Polygon File Format (PLY format). Imperfections of the mesh (noise, artifacts, self-interactions, etc.), when present, were corrected using Geomagic Studio 2012 cleaning tools (Geomagic Worldwide Headquarters, 430 Davis Drive, Marisville, N.C. 27560, USA). The two osteoderms from the AMNH paleontology collection were reconstructed in three dimensions using photogrammetry. Therefore, we used a portable camera for taking a series of photographs of the two osteoderms under various angles under controlled and repeatable conditions. For this purpose, the camera was fixed on a stage and pointed toward the osteoderm (target), which was left rotated to mimic the process used with the StereoScan 3D-surface scanner. We used a Canon 60D camera equipped with a Canon 60 mm/2 macro objective and a Canon Speedlite 320EX flash. Camera parameters were set to get clear photographs (sensitivity: 100 ISO, objective aperture: 16, exposure time: automatic). Each osteoderm was laid on one edge on a rotating pad that was centered on a fixed 360° graduated plastic sheet. Each specimen was then photographed every 10° while rotating along a 36-photograph series. The distance between the camera and the osteoderm was set so that the osteoderm completely filled the camera field of view. The 3D model was generated automatically for each specimen after uploading the 36 pictures in JPEG format (Agisoft Photoscan Professional v. 1.1.4). This process involves four consecutive stages: aligning pictures, creating a dense cloud, meshworking, and building a surface texture. Pictures partially blurred by short field depth were manually deleted as all pictures were previously checked during an individual review of each picture before the automatic alignment. Finally, 3D models were exported in PLY format. It is worth noting that all the 3D models obtained using either Breuckmann surface scanner or photogrammetry have similar accuracy (Clarac et al. Reference Clarac, de Buffrénil, Brochu and Cubo2017a).
As our aim was to assess the effect of ornamentation on the mechanical response of the osteoderms, we duplicated each 3D-reconstructed osteoderm to create a copy without ornamentation. Because the ornamentation in our samples is known to result from osteoclastic bone resorption on the apical surface (Buffrénil Reference Buffrénil1982; Buffrénil et al. Reference Buffrénil, Clarac, Fau, Martin, Martin, Pellé and Laurin2015), this comparative model was set up by suppressing all the pits and replacing the ornamented apical surface with a smooth envelope (using Geomagic Studio 12; for more details, see Clarac et al. Reference Clarac, Goussard, Teresi, de Buffrénil and Sansalone2017b).
Moreover, to remove the size differential of the osteoderms (which ranged in size from a few centimeters to a few tens of centimeters), in our comparative analysis, we rescaled all the samples so that they have the same ornamented surface area (OSA). We first measured the area of the apical, ornamented surface of all the osteoderms using the Compute Selected Area tool in Geomagic Studio 12. Then, after selecting a reference sample (C. crocodilus, MNHN-1989-6489), for each osteoderm, we computed a linear scale factor as the square root of the ratio between the reference OSA and its own OSA (the square root is needed, because this linear scale factor is based on measures of area).
Each linear scale factor was used to rescale the corresponding specimen with respect to its centroid (by means of the function model change in Geomagic Studio 12). The result of this operation was the acquisition of a set of six osteoderms having their original shape but the same OSA value. The same scale factors were used on the corresponding smoothed osteoderms. It should be noted that the surface scanner preserves the actual dimensions when generating the PLY files, whereas photogrammetry does not. This is not a limitation; the actual size of the osteoderms does not matter with respect to this study, because all the osteoderms, whatever their actual size, are rescaled to have the same OSA value. Therefore, the scaling factors used to rescale the 3D models in Geomagic refer to the actual size of the osteoderms of the MNHN collection and to a fictitious size arbitrarily set by Geomagic Studio 12 while importing the PLY files for those coming from the AMNH collection. The actual scaling factors of these latter specimens can be only estimated. The actual scale factors of the MNHN samples and the estimated scale factors of the AMNH samples are reported in Table 2.
Sampled osteoderms with morphometric data. The ΔMass is calculated assuming a bone density of 2g/cm3. *Estimated scale factor based on the osteoderm real size (different from the value used for scaling the 3D model in Geomagic Studio). Osteolaemus tetraspis (a),MNHN-AC.1991.4488a; (b), MNHN-AC.1991.4488b.

Eventually, for sake of limiting the computational time needed for the subsequent finite element analysis (FEA), we simplified the surface representation of our 3D models and reduced the number of surface triangles to between 20,000 and 30,000 using the remeshing tools of Geomagic Studio 12 (detailed in Supplementary Fig. 1). These surface meshes are adequate with respect to the studied specimens (size and morphology).
Finite Element Analysis
The 3D models of osteoderms were uploaded into Comsol software (COMSOL Multiphysics v. 5.2, COMSOL AB, Stockholm, Sweden) to perform an FEA simulating the attack of a predator. The element size of the finite element (FE) mesh was fixed to ensure convergence of the relevant mechanical parameters (average von Mises stress and high-stress regions—see below; Supplementary Fig. 2).
A comparative analysis was performed on ornamented and smoothed models of osteoderms, looking at the distribution of the von Mises stress—a scalar measure encompassing the whole 3D stress state, which is commonly used to define a strength criterion in terms of the maximum distortion of a ductile material (yield strength; von Mises Reference Mises1913). Moreover, a sensitivity analysis was also performed with respect to several modeling parameters.
The osteoderms were assumed to be made of a homogeneous, isotropic, linearly elastic material characterized by Young's modulus (E o) and the Poisson ratio (ν o). Young's modulus (E o) characterizes the stiffness (i.e., the resistance to deformation of the osteoderm), and its value was arbitrarily set to 10 GPa, which is on the order of the elastic modulus of alligator osteoderms obtained through nanoindentation tests (Sun and Chen Reference Sun and Chen2013). Indeed, this value depends on the specific microstructural features of the osteoderm, namely, bone porosity and collagen fiber orientation (Sun and Chen Reference Sun and Chen2013). As outlined by previous authors (Scheyer and Desojo Reference Scheyer and Desojo2011; Burns et al. Reference Burns, Vickaryous and Currie2013; Cerda et al. Reference Cerda, Desojo, Scheyer and Schultz2013; Buffrénil et al. Reference Buffrénil, Clarac, Fau, Martin, Martin, Pellé and Laurin2015), the crocodylomorph osteoderms show a variable porosity and are composed not only of compact bone but also show a diploe structure (at least in the modern forms). Moreover, microcrack orientation can introduce some anisotropy in the elastic moduli of the osteoderm (Chen et al. Reference Chen, Yang and Meyers2014). In view of the uncertainty affecting the actual value of E o, we performed a parametric analysis in C. crocodilus to estimate the effects of the variation of the Young's modulus of the osteoderm. As no experimental measures exist for the value of the Poisson ratio of the osteoderms, we set ν o = 0.18, which is typical of compact bovine femoral bone (Pithioux et al. Reference Pithioux, Lasaygues and Chabrand2002).
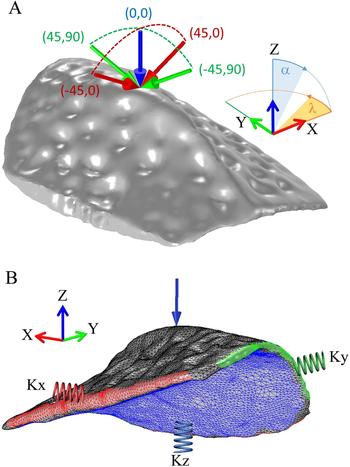
The attack of a predator was modeled by applying a force, F = 1000 N, orthogonal to the apical surface of each specimen (above the centroid). This value is an approximation of a C. crocodilus molariform bite force (F tot; following Erickson et al. Reference Erickson, Gignac, Steppan, Lappin, Vliet, Brueggen, Inouye, Kledzik and Webb2012), which simulates an external attack in an intraspecific fight or in a predator ambush, such as might be produced by a jaguar claw (Panthera onca; Da Silveira et al. Reference Da Silveira, Ramalho, Thorbjarnarson and Magnusson2010; Azevedo and Verdade Reference Azevedo and Verdade2011). Different angles of attack were considered, parameterized by the pair of angular coordinates (α, λ) depicted in Figure 1A. The orientation of the force was initially set in the vertical direction (z-axis, α = 0°), then the force direction was tilted at an angle α = ±45° toward either the transversal axis x (λ = 0°) or the longitudinal axis y (λ = 90°), as an attack (whether a bite or a claw) may come from different directions (see Fig. 1A). Thus, components of the force read: F x = F sin(α) cos(λ), F y = F sin(α) sin(λ), and F z = F cos(α). Overall, five loading conditions were considered whose angular coordinates are depicted in Figure 1A.
A, Geometry and forces applied on a typical osteoderm (Caiman crocodilus) to simulate a bite coming from different directions. The force direction is parameterized by the pair of angles (α, λ). The five loading conditions considered in this study are depicted, and their angular coordinates are expressed in degrees. B, Finite element mesh and boundary conditions of a typical osteoderm (C. crocodilus). Elastic springs are applied on the lateral (red and green) and basal (blue) sides of the osteoderm (see text for details). X, transversal axis; Y, longitudinal axis; Z, vertical axis.

The FE mesh and the other boundary conditions (BCs) are shown in Figure 1B. The geometry was meshed using the built-in meshing tools of COMSOL software, resulting in about 105 tetrahedral elements. Quadratic polynomial shape functions were used in each element to locally interpolate the displacement field. Besides the bite force, we applied BCs on the osteoderm that simulated its actual configuration in vivo. Because each osteoderm is connected to its neighbors along its four lateral edges within the dorsal shield (Sun and Chen Reference Sun and Chen2013), we applied distributed springs on its lateral boundaries. Spring stiffness was estimated as K x = E o/(N x · L x) for the springs acting along the transversal axis (x direction; red spring in Fig. 1B), where N x is the number of neighboring osteoderms and L x is the typical dimension of the osteoderm in the x direction. K x has the physical dimensions of [N/L 2 · L] and represents the force per unit area needed to produce a unit displacement. Similarly, the stiffness of the springs acting along the longitudinal axis (y direction; green spring in Fig. 1B) was estimated as K y = E o/(N y · L y). The values of L x and L y of all the osteoderms can be found in Table 2. N x and N y are free parameters of the model. Numerical results for all osteoderms were computed by setting N x = N y = 1. However, we performed a parametric study in C. crocodilus by considering up to five neighboring osteoderms in each direction to assess the influence of the osteoderm locality on the experimental stress (Supplementary Fig. 3). Because the dorsal shield is carried by the axial musculature (Gasc Reference Gasc, Gans and Parsons1981), we applied distributed elastic springs on the basal side of the osteoderm, whose stiffness was estimated as K z = E b/L z, where E b and L z are the Young's modulus and thickness of the basal soft tissue, respectively. These two parameters are quite hard to identify. We arbitrarily set E b = 100 MPa (slightly smaller than the Young's modulus of the muscles measured in tensile conditions; McKee et al. Reference McKee, Last, Russell and Murphy2011) and L z = 1 cm (typical distance between the osteoderm and the underlying skeletal structure) in our simulations. As the value of E b can span several orders of magnitude according to the specific tissue (Akhtar et al. Reference Akhtar, Sherratt, Kennedy Cruickshank and Derby2011; McKee et al. Reference McKee, Last, Russell and Murphy2011; Kot Reference Kot, Zhang, Lee, Leung and Fu2012), we performed a parametric study in C. crocodilus by varying E b from 0.1 to 1000 MPa.
Quantitative Assessment of the Bone Ornamentation
In this study, our aim is to investigate the mechanical effects of the loss of bony mass due to the ornamentation of the osteoderms. First, from a mechanical point of view, comparison between ornamented and smoothed osteoderms is made in both qualitative and quantitative terms with respect to the von Mises stress. Qualitative comparison is made looking at the distribution of von Mises stress in the osteoderm. Quantitative comparison is made by means of suitable stress-related indexes, namely: (1) the average von Mises stress  ${\bar \sigma} _{VM}$ in the osteoderm:
 $${{\bar {\rm \sigma}}} _{{\rm VM}} = \displaystyle{1 \over {{\rm V}_{\rm o}}} \int \limits_{{\rm V}_{\rm o}}^{} {\rm \sigma} _{{\rm VM}}dV,$$
where σ VM is the von Mises stress, and V o is the volume of the osteoderm; and (2) the high-stress volume fraction VF i, that is, the ratio between the volume V i of the osteoderm where the von Mises stress exceeds a fixed threshold σi and the whole volume of the osteoderm:
 $$V_i = \int \limits_{V_o}^{} 1_{\sigma _{VM} \gt \sigma _i}dV, \;VF_i = V_i/V_o$$
where  $1_{\sigma _{VM} \gt \sigma _i}$ is the characteristic function taking value 1 in the regions where σVM exceeds σi and 0 elsewhere. Two thresholds were fixed in this study, namely, σ 1 = 100 MPa (which roughly corresponds to the strength of compact bone) and σ 2 = σ 1/2; the corresponding high-stress volume fractions are thus denoted VF 1 and VF 2, respectively.
Second, from a morphological point of view, comparison between ornamented and smoothed osteoderms is made by looking at the mass loss due to ornamentation, which is excavated by pit resorption in the apical cortex of the osteoderms. This mass quantification is followed by the loss of volume, as the bone density in the peripheral cortex (compact bone) may be considered constant (2 g/cm3; after Blanton and Biggs Reference Blanton and Biggs1968). Herein, quantifying the loss of volume due to ornamentation entails first measuring the volume within the ornamented osteoderm before repeating the operation on a smoothed copy. This process results in the acquisition of a variable that defines the loss of bone volume of the smoothed osteoderm due to the excavation of the pits on its apical surface (expressed as a percentage; Clarac et al. Reference Clarac, Goussard, Teresi, de Buffrénil and Sansalone2017b):
 $$LV = 100 \left(\displaystyle{{{SoV} - {RoV}} \over {{SoV}}}\right),$$
where SoV and RoV are the “smoothed osteoderm volume” and “real osteoderm volume,” respectively. Table 2 presents all the relevant morphometric data of ornamented and smoothed osteoderms.
Results
Parametric Analysis in Caiman crocodilus
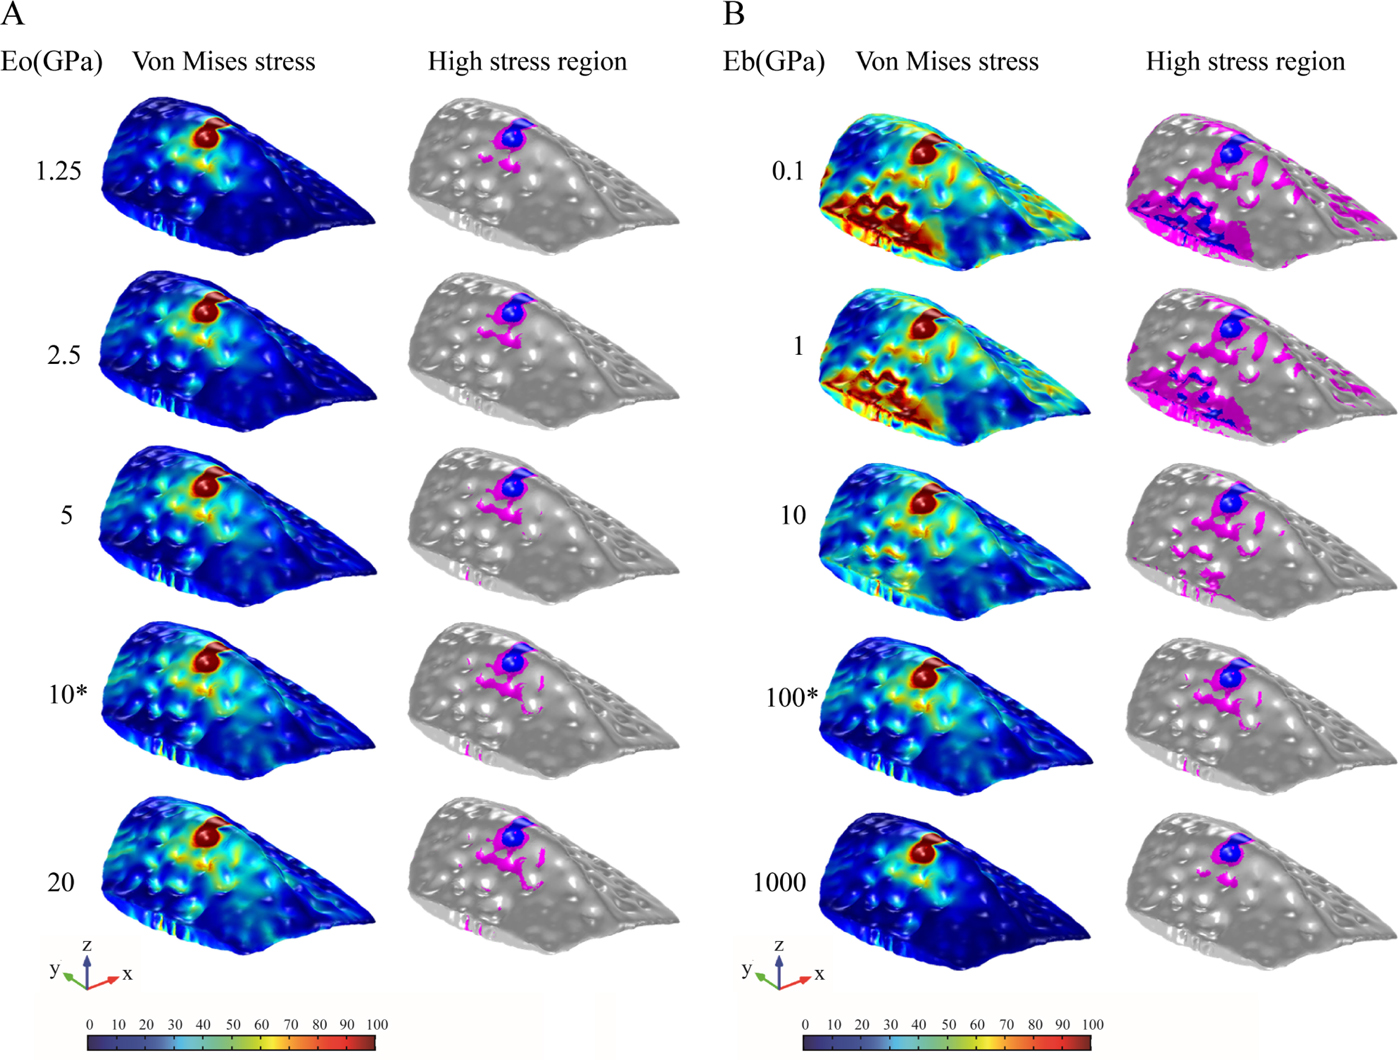
Figure 2A shows the von Mises stress in the C. crocodilus osteoderm (on the left) and the high-stress regions (on the right) where the von Mises stress exceeds the stress thresholds σ 1 in dark gray (blue online) and σ2 in light gray (purple online), as a function of the Young's modulus of the osteoderm (E o). The same results are shown in Figure 2B as a function of the Young's modulus of the basal tissue (E b). Qualitatively, the stress distribution in the osteoderm is not affected noticeably by the value of E o. By contrast, E b does affect the stress distribution in the osteoderm, smaller values of E b being associated with higher stress.
A, Parametric analysis with respect to the Young's modulus of the osteoderm (E o). Left: von Mises stress; color scale: 0 (blue; light gray) to 100 MPa (red; dark gray). Right: High-stress volume fractions VF 1 (blue; dark gray) and VF 2 (purple; light gray) as a function of the Young's modulus of the osteoderm (E o). Relevant reference parameters are: E b = 0.1 GPa (Young's modulus of the basal tissue); N = 1 (number of lateral osteoderms); and α, λ = 0° (force orientation). An asterisk (*) denotes the reference value of E o. B, Parametric analysis with respect to the Young's modulus of the basal tissue (E b). Left: von Mises stress; color scale: 0 (blue; light gray) to 100 MPa (red; dark gray). Right: High-stress volume fractions: VF 1 (blue; dark gray) and VF 2 (purple; light gray) as a function of the Young's modulus of the basal tissue (Eb). Relevant reference parameters are: E o = 10 GPa (Young's modulus of the osteoderm); N = 1 (number of lateral osteoderms); and α, λ = 0° (force orientation). An asterisk (*) denotes the reference value of Eb, which was used for the simulation on the full sample (presented in Table 1).

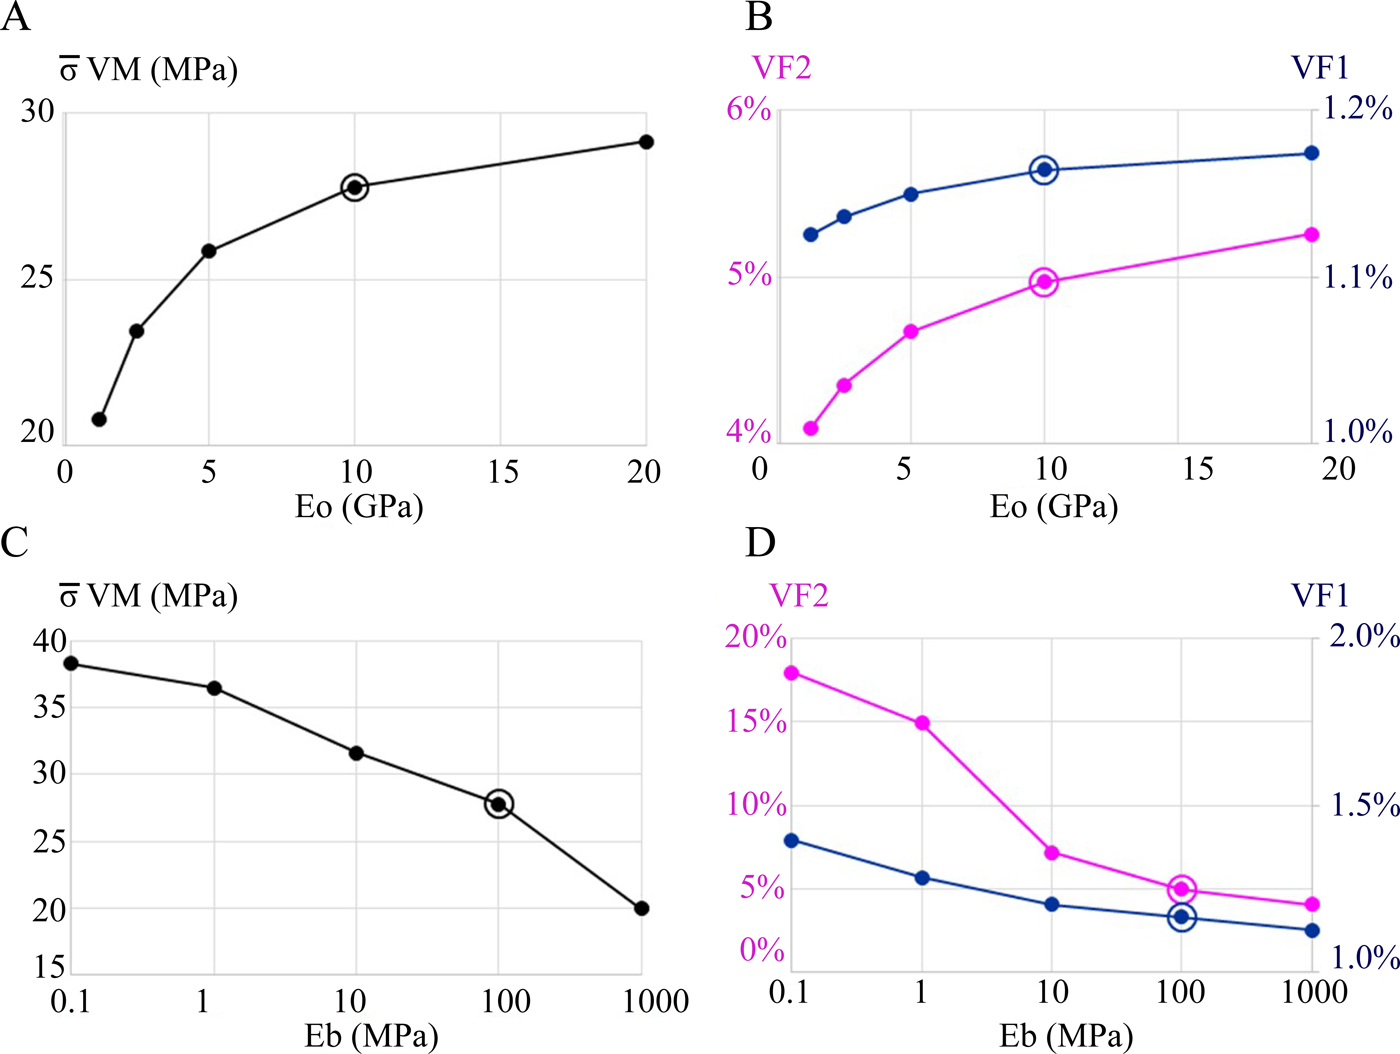
The parametric analysis shows that both the average von Mises stress ( ${\bar \sigma} _{VM}$) and the high-stress volume fractions (VF 1 and VF 2) increase as the Young's modulus E o of the osteoderm increases (Fig. 3A,B). Conversely, both the average von Mises stress and the high-stress volumes of the osteoderm decrease as the Young's modulus E b of the basal tissue increases (Fig. 3C,D). Both E o and E b strongly affect the average von Mises stress (Fig. 3A,C). Moreover, whereas E o has a small or negligible effect on the volume fractions VF 1 (blue/dark gray lines in Fig. 3B) and VF 2 (purple/light gray lines in Fig. 3B), E b does affect the values of VF 1 and VF 2 (blue/dark gray and purple/light gray lines in Fig. 3D, respectively).
Parametric analysis in Caiman crocodilus with respect to the Young's modulus of the osteoderm (E o; A, B) and of its basal tissue (E b; C, D). A, Average von Mises stress in the osteoderm as a function of the Young's modulus of the osteoderm (E o). B, High-stress volume fractions VF 1 (blue/dark gray line; right-side scale) and VF 2 (purple/light gray line; left-side scale) as a function of the Young's modulus of the osteoderm (E o). Relevant reference parameters are: E b = 0.1 GPa (Young's modulus of the basal tissue); N = 1 (number of lateral osteoderms); and α, λ = 0° (force orientation). C, Average von Mises stress in the osteoderm as a function of the Young's modulus of the basal tissue (E b). D, High-stress volume fractions VF 1 (blue/dark gray line; right-side scale) and VF 2 (purple/light gray line; left-side scale) as a function of the Young's modulus of the basal tissue (E b). Relevant reference parameters are: E o = 10 GPa (Young's modulus of the osteoderm); N = 1 (number of lateral osteoderms); and α, λ = 0° (force orientation). See text for details.

The parametric analysis with respect to the number of lateral osteoderms (N = N x = N y) has shown that this parameter has a negligible effect (differences of a few percent) on both the average von Mises stress  ${{\bar {\rm \sigma}}} _{{\rm VM}}$ and the high-stress volume fractions VF 1 and VF 2 as N increases from 1 to 5 (Supplementary Fig. 3).
The Influence of the Osteoderm Global Morphology on the Mechanical Resistance
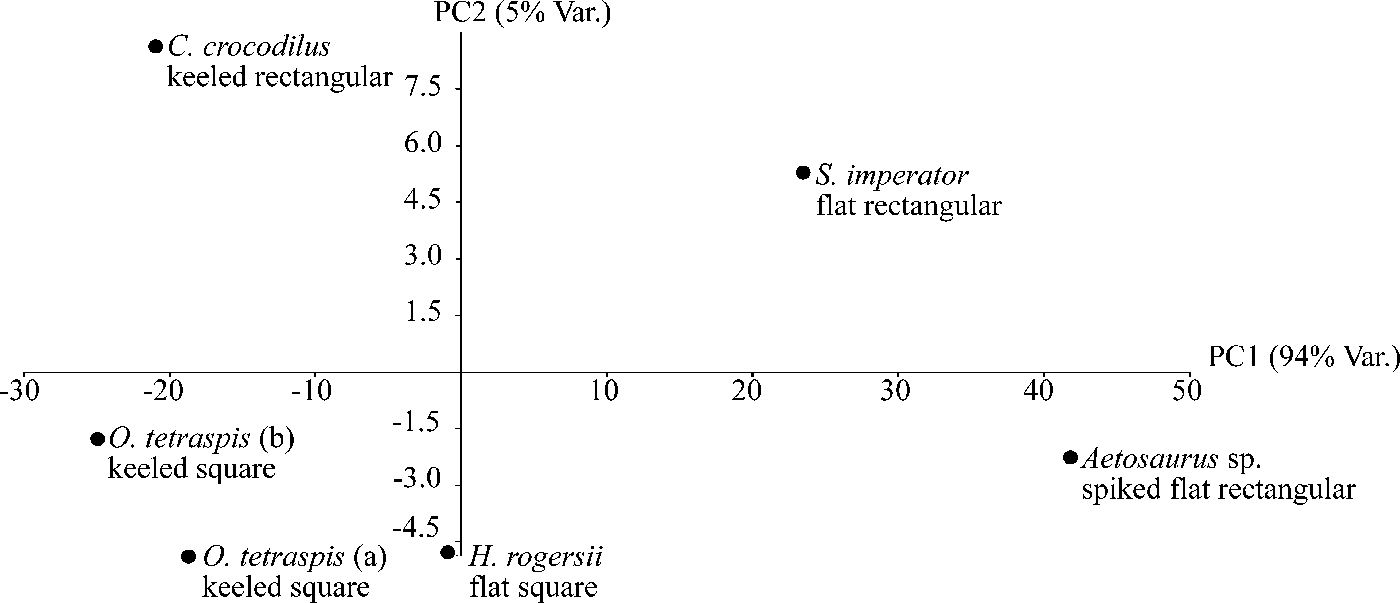
We performed a principal component analysis (PCA; Fig. 4) using  ${{\bar {\rm \sigma}}} _{{\rm VM}}$ and VF 1 and VF 2 scores on the full set of the ornamented osteoderms (Table 3). The main component (PC 1) explains 94% of the variance and is positively correlated with
 ${\bar \sigma} _{VM}$ , VF 1, and VF 2 when the attack comes vertically on the osteoderm with no clear influence of either α or λ. The keeled osteoderms score negative PC1 values, whereas both the spiked and flat osteoderms show rather nil or positive values. Nevertheless, we do not observe any clear pattern distinguishing the square from the rectangular osteoderms along either PC1 or PC2 (explaining 5% of the variance).
Principal component analysis of the sampled osteoderm stress variables: VF 1, VF 2, σ̅ VM with variation of α (0°, 45°, −45°) and λ (0°, 90°, −90°); PC1 explains 94% of the variance, 5% of the variance is explained by PC2. Performed using PAST v. 2.17c (Hammer et al. Reference Hammer, Harper and Ryan2001).

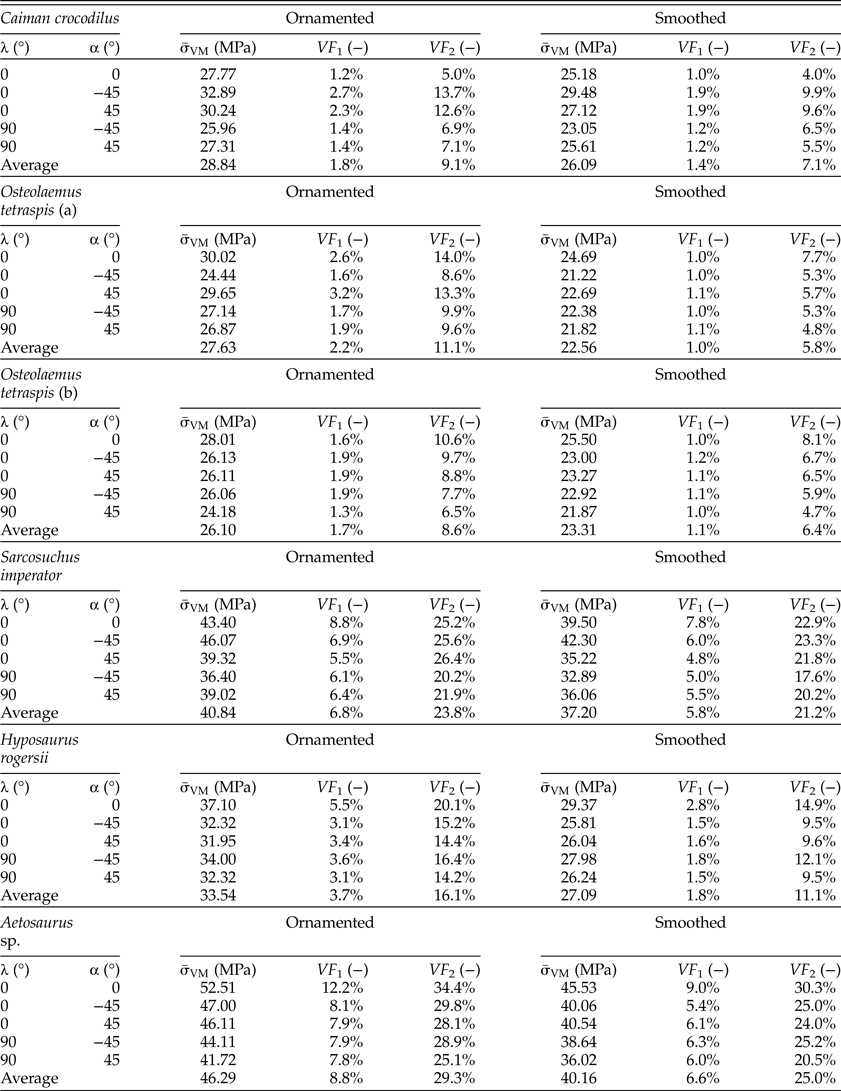
Mechanical indexes quantifying the von Mises stress distribution in the ornamented and smoothed specimens for each loading condition (α, λ) and in the average.  ${{\bar {\rm \sigma}}} _{{\rm VM}}$, average von Mises stress in the osteoderm; VF 1 and VF 2, volume fractions of the regions where the von Mises stress exceeds the stress thresholds σ1 and σ2, respectively. See text for details. Osteolaemus tetraspis (a), MNHN-AC.1991.4488a; (b), MNHN-AC.1991.4488b.

The Influence of Bone Ornamentation on the Osteoderm Mechanical Response
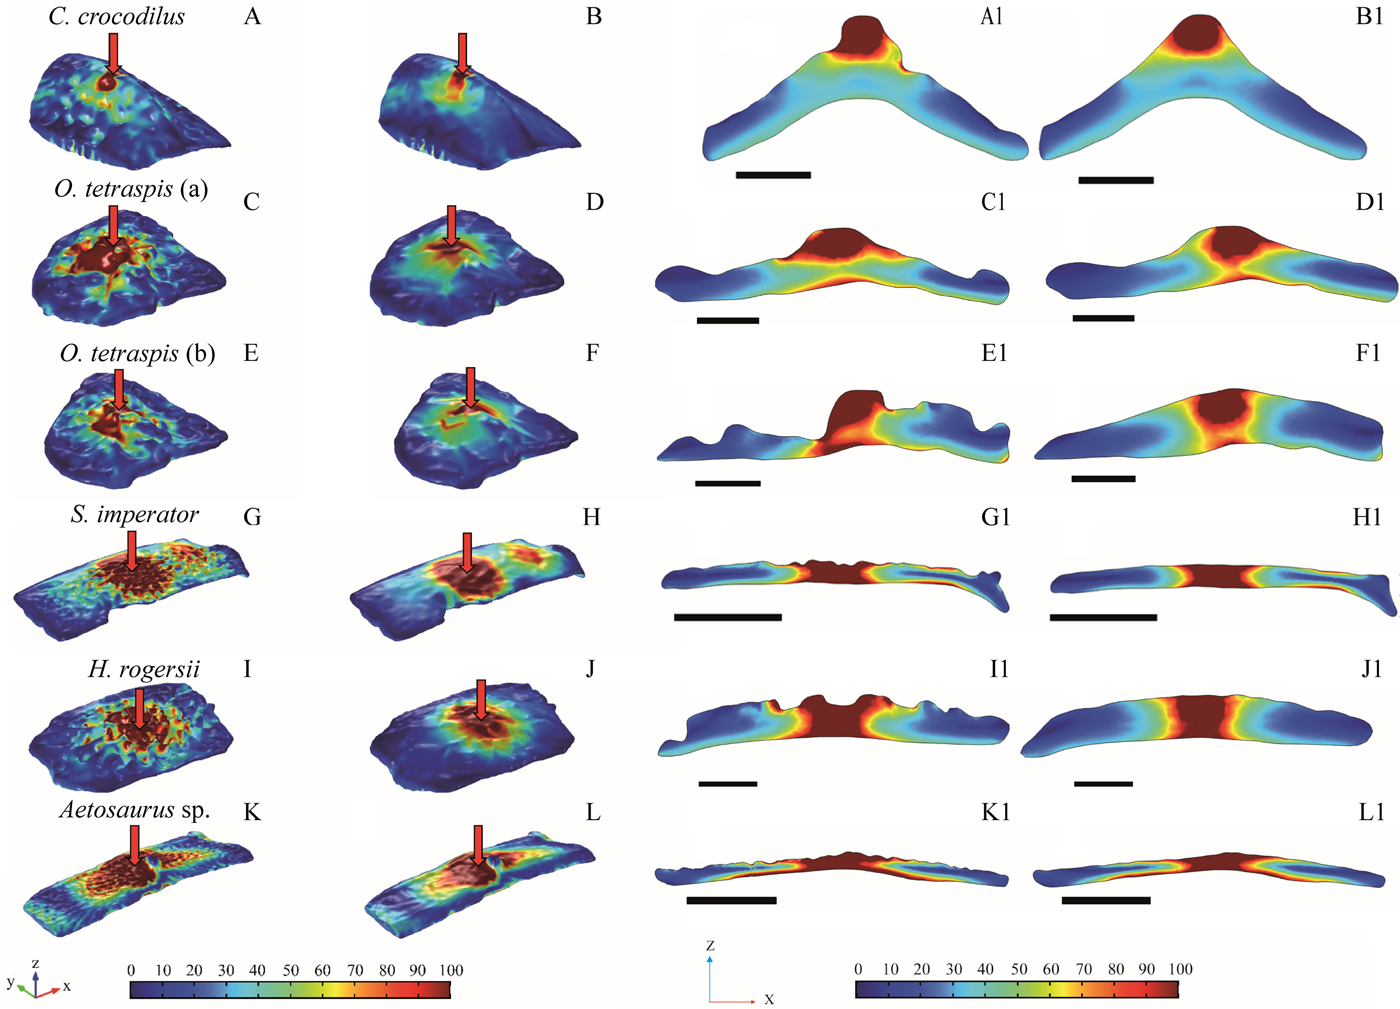
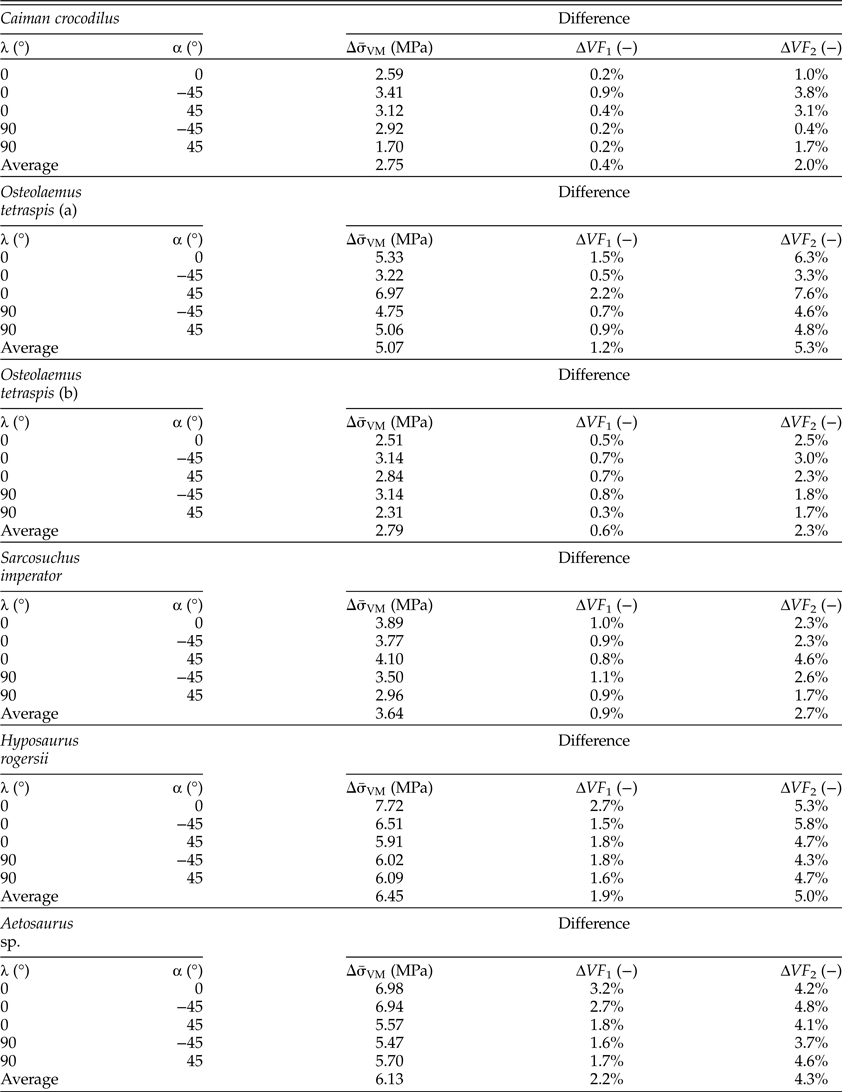
In all the osteoderms, the pattern of the von Mises stress is generally similar in either presence or absence of ornamentation (Fig. 5). We notice that both the average von Mises stress ( ${\bar \sigma} _{VM}$) and the high-stress volume fractions (VF 1 and VF 2) are higher in the presence of ornamentation. The values of these three mechanical indexes in smoothed and ornamented osteoderms are presented in Table 3, with the corresponding differences in Table 4. The orientation of the attack (parameterized by the angles α and λ) modifies the stress pattern, but only modifies the values of the average von Mises stress to a small extent (Tables 3, 4, Fig. 6).
von Mises stress in the 3D-modeled osteoderms (in MPa). A, Ornamented osteoderm of Caiman crocodilus; A1, view of the mid-osteoderm transversal cross section. Scale bar, 4mm. B, Smoothed osteoderm of C. crocodilus; B1, view of the mid-osteoderm transversal cross section. Scale bar, 4 mm. C, Ornamented osteoderm of Osteolaemus tetraspis (MNHN-AC.1991.4488a); C1, view of the mid-osteoderm transversal cross section. Scale bar, 4 mm. D, Smoothed osteoderm of O. tetraspis (MNHN-AC.1991.4488a); D1, view of the mid-osteoderm transversal cross section. Scale bar, 4 mm. E, Ornamented osteoderm of O. tetraspis (MNHN-AC.1991.4488b); E1, view of the mid-osteoderm transversal cross section. Scale bar, 4 mm. F, Smoothed osteoderm of O. tetraspis (MNHN-AC.1991.4488b); F1, view of the mid-osteoderm transversal cross section. Scale bar, 4 mm. G, Ornamented osteoderm of Sarcosuchus imperator; G1, view of the mid-osteoderm transversal cross section. Scale bar, 10 mm. H, Smoothed osteoderm of S. imperator; H1, view of the mid-osteoderm transversal cross section. Scale bar, 10 mm. I, Ornamented osteoderm of Hyposaurus rogersii; I1, view of the mid-osteoderm transversal cross section. Scale bar, 4 mm. J, Smoothed osteoderm of H. rogersii; J1, view of the mid-osteoderm transversal cross section. Scale bar, 4 mm. K, Ornamented osteoderm of Aetosaurus sp.; K1, view of the mid-osteoderm transversal cross section. Scale bar, 10 mm. L, Smoothed osteoderm of Aetosaurus sp.; L1, view of the mid-osteoderm transversal cross section. Scale bar, 10 mm. X, transversal axis; Y, longitudinal axis; Z, vertical axis. All plots refer to (α, λ) = (0°, 0°). Color scale: 0 (blue; light gray) to 100 MPa (red; dark gray).

von Mises stress in Caiman crocodilus osteoderm presented in both longitudinal and transversal cross sections for different loading conditions parameterized by the pair of angles (α, λ). Color scale: 0 (blue; light gray) to 100 MPa (red; dark gray).

Differences between the mechanical indexes of the ornamented and smoothed osteoderms (positive values indicate that the index is higher in the actual osteoderm) for each loading condition (α, λ) and on average. See text for details. Osteolaemus tetraspis (a), MNHN-AC.1991.4488a; (b), MNHN-AC.1991.4488b.

In general, the average von Mises stress as well as the high-stress volumes (VF 1 and VF 2) are rather higher when the force is applied vertically (α = 0° and λ = 0°) in both ornamented and smoothed osteoderms. However, the opposite trend is observed in C. crocodilus (the osteoderm showing the most pronounced keel in the sample).
The loss of volume due to ornamentation falls between 5% and 15%, which corresponds to a weight loss ranging between 82 and 228 mg per osteoderm (Table 2), assuming a density of 2g/cm3 (compact bone; after Blanton and Biggs Reference Blanton and Biggs1968). This weight loss depends directly on the degree of ornamentation and is relative to an osteoderm whose size is equivalent to the C. crocodilus specimen (scale reference; 27.8 mm [L y], 18.2 mm [L x], 4.6 mm [L z]; Alligatoridae; Table 2). As an Alligator mississippiensis adult specimen (Alligatoridae) carries about 70 osteoderms on its dorsal shield (after Sun and Chen, Reference Sun and Chen2013), the corresponding estimated total weight loss due to bone ornamentation should be between 6 and 16 g for any crocodilian presenting a similar dorsal shield and a global size equal to that of C. crocodilus (between 2 and 2.5 m; after Groombridge Reference Groombridge, Webb, Manolis and Whitehead1987). This value shall be at best doubled (32 g) for an adult Osteolaemus tetraspis (Crocodylidae), which shows a similar size but possesses ventral and appendicular osteoderms (Trutnau and Sommerlad Reference Trutnau and Sommerlad2006).
Discussion
Limits of the Study
The crocodilian osteoderms are complex mechanical structures that were simplified in this preliminary study. The osteoderms were assumed to be made of a homogeneous and isotropic linearly elastic material. However, these hypotheses can be questioned and will be discussed in this section.
First, the degree of mineralization of the osteoderms is heterogeneous and is noticeably higher in the central keel (when present; Sun and Chen Reference Sun and Chen2013). Moreover, ornamented osteoderms may be composed of different types of bone with both a variable porosity and different collagen fiber orientations (i.e., woven bone, parallel fibered, and lamellar; Burns et al. Reference Burns, Vickaryous and Currie2013). Sun and Chen (Reference Sun and Chen2013) have performed an extensive experimental analysis through nanoindentation and compressive tests on alligator osteoderms. Their results show that the elastic modulus is heterogeneous (nanoindentation tests provided average elastic moduli of about 20 and 13 GPa in the dorsal and ventral regions, respectively) and anisotropic (compressive tests provided average elastic moduli on the order of 1 GPa, slightly larger in horizontal than in vertical specimens, respectively). The reference Young's modulus of 10 GPa used in this study is coherent with the nanoindentation moduli reported in Sun and Chen (Reference Sun and Chen2013: Table 2) after taking into account the porosity of the osteoderm. Indeed, we did not explicitly model the porous microstructure of the core of the osteoderm, and therefore the Young's modulus used in our study (homogeneous throughout the osteoderm) is meant to be an average value accounting for both the solid matrix and the porosity. Nevertheless, in view of the uncertainty affecting the actual value of the Young's modulus, we performed a parametric analysis suggesting that this value has no significant influence on the stress distribution or on the mechanical strength of the osteoderm (Figs. 2A and 3B). In the end, as the same simplifying hypotheses have been made for both the actual and smoothed osteoderm models, it seems reasonable to assume that they will not strongly affect our comparative study. Accounting for the porous structure (i.e., pore size and density) of the osteoderm as well as for the heterogeneity and anisotropy of its elastic properties would require a detailed description of osteoderm microstructure that was not available in this study and will be undertaken in a future work. Indeed, the average Young's modulus is a good approximation of the resulting biomechanical properties, but it cannot fully replicate the morphological differences within the osteoderm.
The attack of a predator was modeled through a force applied on a small part of the top surface of the osteoderm. While considering a variable orientation of this force (from −45° to 45° in two orthogonal planes containing the vertical axis), our study does not encompass any possible attack condition or the sliding of the force on the osteoderm surface that may occur in real situations. More realistic loading conditions would also require fine-tuning the force parameters (magnitude, orientation, contact area, etc.) to mimic the typical attack conditions of the actual predators of each species considered in the study.
The presence of the neighboring osteoderms and of the basal tissue was modeled through elastic springs. Although our parametric analysis with respect to the number of neighboring osteoderms (N) has shown a negligible effect of this parameter, our approach cannot take into account the friction possibly occurring between adjacent osteoderms. Moreover, modeling the basal tissue as vertical springs also neglects possible sliding effects in the horizontal plane. These simplifications do require further attention and will be addressed in future work.
Because the smoothed osteoderms are modeled by considering a quasi-convex fictive envelope joining the top of the ridges (SoV > RoV), this model is not suitable to assess the influence of bone ornamentation when this latter is not set up by resorption but only by a differential apposition, such as in temnospondyls, lepospondyls, and placoderms (Witzmann Reference Witzmann2009; Buffrénil et al. Reference Buffrénil, Clarac, Canoville and Laurin2016). In this case, smoothed 3D models could be built by creating the apical bone surface in a different way, for example, by averaging the position of the mesh between the bottom of the pits and the top of the crests if we consider that the differential apposition consists of consecutive local growth variations resulting in a field of pits and crests.
The Mechanical Effects of the Osteoderm Ornamentation
Comparing the results obtained for the actual and smoothed osteoderms, it is apparent that the ornamentation has a limited effect on the overall mechanical response of the osteoderm. Indeed, the global mechanical indexes considered in this study (average von Mises stress and high-stress regions) are slightly affected by the ornamentation (see Table 4). The average von Mises stress is higher in the ornamented osteoderms, resulting in an increase of the average von Mises stress of between 10% and 20%. The augmentation in average von Mises stress seems to correlate negatively with the volume difference between actual and smoothed osteoderms (quantified by the index LV). Thus, larger differences in  $\Delta {\bar \sigma} _{VM}$ (Table 4) are observed in the osteoderms with more pronounced ornamentation (Table 1), namely H. rogersii and O. tetraspis (MNHN-AC.1991.4488a). However, small differences are observed in O. tetraspis (MNHN-AC.1991.4488b), despite its high LV. This is likely due to the fact that ornamentation of this sample is mainly located in regions that are not highly stressed.
Concerning the high-stress volume fractions, a similar trend is observed. Critical regions (VF 1 and VF 2; Table 3) are larger in ornamented osteoderms than in their smoothed counterparts, the larger differences (ΔVF 1 and ΔVF 2; Table 4) being observed in osteoderms with more pronounced ornamentation. However, in all cases, the values of ΔVF 1 and ΔVF 2 are on the order of a few percent, proving that the ornamentation does not significantly modify the extent of the critical regions.
In summary, although ornamentation leads to an increased average von Mises stress in the osteoderm, it has quite limited effects on the extent of the highly stressed regions and therefore on the strength of the osteoderms. Nevertheless, this conclusion relies only on global parameters and neglects localization phenomena that are often critical in determining mechanical strength. Actually, stress concentration can be observed close to the pits and ridges of ornamented osteoderms, which may promote crack initiation and propagation and eventually threaten the structural integrity of the osteoderm. This process cannot be described by our model and would require a more detailed analysis accounting for damage and fracture mechanics.
The Influence of the Osteoderm Global Morphology on the von Mises Stress
The PCA performed using the different variables that quantify the osteoderm mechanical response to an apical external attack ( ${\bar \sigma} _{VM}$, VF 1, and VF 2; Fig. 4) reveals that the keeled osteoderms (C. crocodilus, O. tetraspis) globally have lower stress scores than both the flat and spiked osteoderms (H. rogersii, S. imperator, Aetosaurus sp.), irrespective of their square or rectangular shape. These results somewhat confirm that the presence of a central keel improves the osteoderm strengthening (Sun and Chen Reference Sun and Chen2013). Furthermore, contrary to all other sampled osteoderms, the specimen that shows the more pronounced central keel (C. crocodilus; Fig. 5) does have a lower von Mises stress score when the attack is vertical (α = 0° and λ = 0°; Table 3). The fact that the average von Mises stress in C. crocodilus is smaller in case of a vertical force suggests that the morphology of this osteoderm is optimized to withstand this type of attack. Eventually, as evidenced by the parametric analyses, the number of neighboring osteoderms has a negligible influence on the von Mises stress in the impacted osteoderm; therefore, we assume that the relative location of each osteoderm on the body should not have a significant influence on its own mechanical response.
According to previous studies (Sun and Chen Reference Sun and Chen2013; Chen et al. Reference Chen, Yang and Meyers2014), the presence of pores due to osteoclast activity in the core of the osteoderms tends to enhance the bending stiffness and energy absorption ability with reduced weight. Concerning the ornamentation of the pseudosuchian osteoderms due to superficial osteoclast activity, our results point out that this pattern of pits and grooves tends to slightly increase the local stress values when enduring an external attack but without serious consequence to the global stress pattern (Table 4).
The Role of the Crocodylomorph Ornamented Osteoderms in Adaptative Functions
The results discussed earlier emphasize that the presence of apical ornamentation on the pseudosuchian osteoderms does not strongly modify their mechanical response (contra Coldiron Reference Coldiron1974) but could rather represent a trade-off between the maintaining of bone strength and the release of mineral components through superficial bone resorption. The direct physical consequence of this mass release either on buoyancy or on any swimming or locomotion performance is of course negligible, as the estimated resulting weight loss is on the order of a few tens of grams for an animal weighting several tens of kilograms (C. crocodilus; Staton and Dixon Reference Staton and Dixon1975). Nonetheless, this recurrent mineral release (with a high proportion of calcium and phosphor) may possibly answer various physiological needs involving muscle activity (Ca2+), egg shelling (Ca2+; Dacke et al. Reference Dacke, Elsey, Trosclair, Sugiyama, Nevarez and Schweitzer2015), ATP synthesis (PO42; Mg2+). Indeed, the pit resorption followed by secondary bone deposition on the pit bottoms is a recurrent process along the crocodylomorph lifetime (Buffrénil Reference Buffrénil1982; Buffrénil et al. Reference Buffrénil, Clarac, Fau, Martin, Martin, Pellé and Laurin2015) and may therefore be involved in phosphocalcic homeostasis like any other type of bone remodeling. Moreover, with regard to the yet to be assessed correlation of the increase in the bone ornamentation excavation with the crocodylomorph transition to the ectothermic amphibious lifestyle in the Early Jurassic (Clarac et al. Reference Clarac, de Buffrénil, Brochu and Cubo2017a), it is probable that the bone ornamentation has been involved in physiological adaptations in the evolution of this taxon. In this regard, several authors assessed that the neosuchian, and by extension the teleosaurid, ornamented osteoderms (here represented by O. tetraspis, C. crocodilus, S. imperator, H. rogersii) were involved both in the heat transfers during basking (Seidel Reference Seidel1979; Farlow et al. Reference Farlow, Hayashi and Tattersall2010) and in the respiratory acidosis buffering due to lactate accumulation during prolonged apnea (Jackson et al. Reference Jackson, Andrade and Abe2003). Both of these hypotheses rely on the fact that the crocodilian osteoderms provide vascular clusters in a skin that is almost free from vascularization, as shown in Clarac et al. (Reference Clarac, de Buffrénil, Cubo and Quilhac2018). As detailed in this recent study, the superficial excavation of the bone ornamentation leads to extension of the core osteoderm vessel proliferation to the apical surface, while releasing bone calcium and carbonates that can also contribute to acidosis buffering by respectively complexing with the plasma lactate and increasing the plasma pH (Jackson et al. Reference Jackson, Andrade and Abe2003). Because only the small extant neosuchian species such as C. crocodilus still endure predation once they reach maturity (Panthera onca; Da Silveira et al. Reference Da Silveira, Ramalho, Thorbjarnarson and Magnusson2010; Azevedo et al. Reference Azevedo and Verdade2011), whereas all the larger species are apex predators once they reach adult size (Trutnau and Sommerlad Reference Trutnau and Sommerlad2006), we may thus assume that the continuing presence of the dorsal shield in neosuchians may not be due to a function for protection against predators but rather to physiological roles. Therefore, we hypothesize that the adaptative function of bone ornamentation in both the neosuchians and teleosaurids should be to grow a superficial cluster of blood vessels alternatively involved in heat transfers (when emerged or semi-emerged) and acidosis buffering (when submerged). The whole bone remodeling process that drives the genesis and the ontogenetic modifications of the bone ornamentation would thus allow the emergence of physiological functions without involving detrimental consequences to the osteoderm mechanical response.
Unlike the neosuchians, the Triassic pseudosuchians are assumed to be both terrestrial and endothermic (Irmis et al. Reference Irmis, Nesbitt and Sues2013; Nesbitt et al. Reference Nesbitt, Desojo and Irmis2013; Legendre et al. Reference Legendre, Guénard, Botha-Brink and Cubo2016). Consequently, neither of the above mentioned hypotheses concerning the adaptative physiological implications of the ornamented osteoderms (heat transfers and respiratory acidosis buffering during prolonged apnea) is suitable to explain their function in Triassic pseudosuchians such as the aetosaurs. However, depending on the phylogenetic and paleogeographic context, the aetosaurs may have adopted a vegetarian (Walker Reference Walker1961; Parrish Reference Parrish1994; Heckert and Lucas Reference Heckert and Lucas2000) and/or an insectivorous diet (Small Reference Small2002; Desojo and Vizcaíno Reference Desojo and Vizcaíno2009), and they must have experienced the predation of giant terrestrial predators such as rauisuchians (Dzik and Sulej Reference Dzik and Sulej2007; Nesbitt et al. Reference Nesbitt, Desojo and Irmis2013). In this regard, the aetosaur ornamented dermal shield would have played a role in body protection, although this assumption contradicts the fact that our sampled aetosaur osteoderm experienced more stress than the rest of the sample when enduring an external attack. Nonetheless, because our sample includes only one aetosaur osteoderm, our result cannot be taken for a general model that would be representative of the entire group. Therefore, no interpretation of the function of the aetosaur ornamented osteoderms can be considered before further investigations are made. Until then, we may simply hypothesize that the morphology and the resulting role of the aetosaur ornamented osteoderm shield may be dependent on both the phylogeny and the taxa's paleogeographic location within the Pangaea (Desojo et al. Reference Desojo, Heckert, Martz, Parker, Schoch, Small, Sulej, Nesbitt, Desojo and Irmis2013).
Acknowledgments
We would like to thank the paleontology and comparative anatomy collection managers for giving us access to the specimens: S. Bailon, R. Allain, N. Jalil, D. Germain, J. S. Steyer (Muséum National d'Histoire Naturelle); C. Mehling and M. Norell (American Museum of Natural History). We also send our respectful regards to the UMS 2700 (Muséum National d'Histoire Naturelle/Centre National de la Recherche Scientifique) for the access to the 3D scanner. Finally, we acknowledge A. Evin (Centre National de la Recherche Scientifique, Institut des Sciences de l'Evolution, Montpellier) for her advice concerning morphometrics. No special funding was obtained to perform this investigation.