1. Introduction
In some cases, it is possible for a coherent vortex to persist next to a moving body rather than convect into the wake. In insect flight, a leading-edge vortex (LEV) is formed and remains attached to the wing throughout one half wing stroke (van den Berg & Ellington Reference van den Berg and Ellington1997). Experiments and simulations on insect wing models have shown that LEV attachment can be extended beyond the 180° limit of a wing stroke, with some results showing stable LEVs up to 270° of stroke angle and beyond (Usherwood & Ellington Reference Usherwood and Ellington2002; Lentink & Dickinson Reference Lentink and Dickinson2009; Harbig, Sheridan & Thompson Reference Harbig, Sheridan and Thompson2013). LEV attachment is even seen in nature to extend indefinitely, as with the stable LEV that forms over autorotating samara seeds (Lentink et al. Reference Lentink, Dickson, van Leeuwen and Dickinson2009; Salcedo et al. Reference Salcedo, Trevino, Vargas and Martinex-Suastegui2013; Lee, Lee & Sohn Reference Lee, Lee and Sohn2014). Lentink et al. (Reference Lentink, Dickson, van Leeuwen and Dickinson2009) asserted that the presence of an LEV over a samara wing enhances force production. Force prediction for steadily rotating plates will require a model that accounts for LEVs, which in turn necessitates the prediction of when and where LEVs will persist in the steady-state sense. To this end, the circulation and flow topology over constantly rotating plates, long after the onset of rotation, will be investigated in the current study.
All of the above natural flight examples share common features: rotation as part of the wing kinematics and low wing aspect ratios. These are conditions that have been shown to favour stable LEV attachment (Lentink & Dickinson Reference Lentink and Dickinson2009). Much of the research on rotating flat plates has been done in quiescent fluid (Jones & Babinsky Reference Jones and Babinsky2011; Ozen & Rockwell Reference Ozen and Rockwell2012; Garmann, Visbal & Orkwis Reference Garmann, Visbal and Orkwis2013; Harbig et al.
Reference Harbig, Sheridan and Thompson2013). By contrast, the stable LEVs over natural samaras exist in a free-stream flow parallel to the axis of rotation, due, for instance, to its descent. The introduction of this free stream,
 $V_{\infty }$
, provides a continuum along which to study steady-state LEVs. Tip speed ratio,
 ${\it\lambda}$
, emerges as an important dimensionless measure of rotation, defined as
 $$\begin{eqnarray}{\it\lambda}=\frac{{\it\Omega}R}{V_{\infty }},\end{eqnarray}$$
where
 $R$
is the span of the plate and
 ${\it\Omega}$
is the rotational speed.
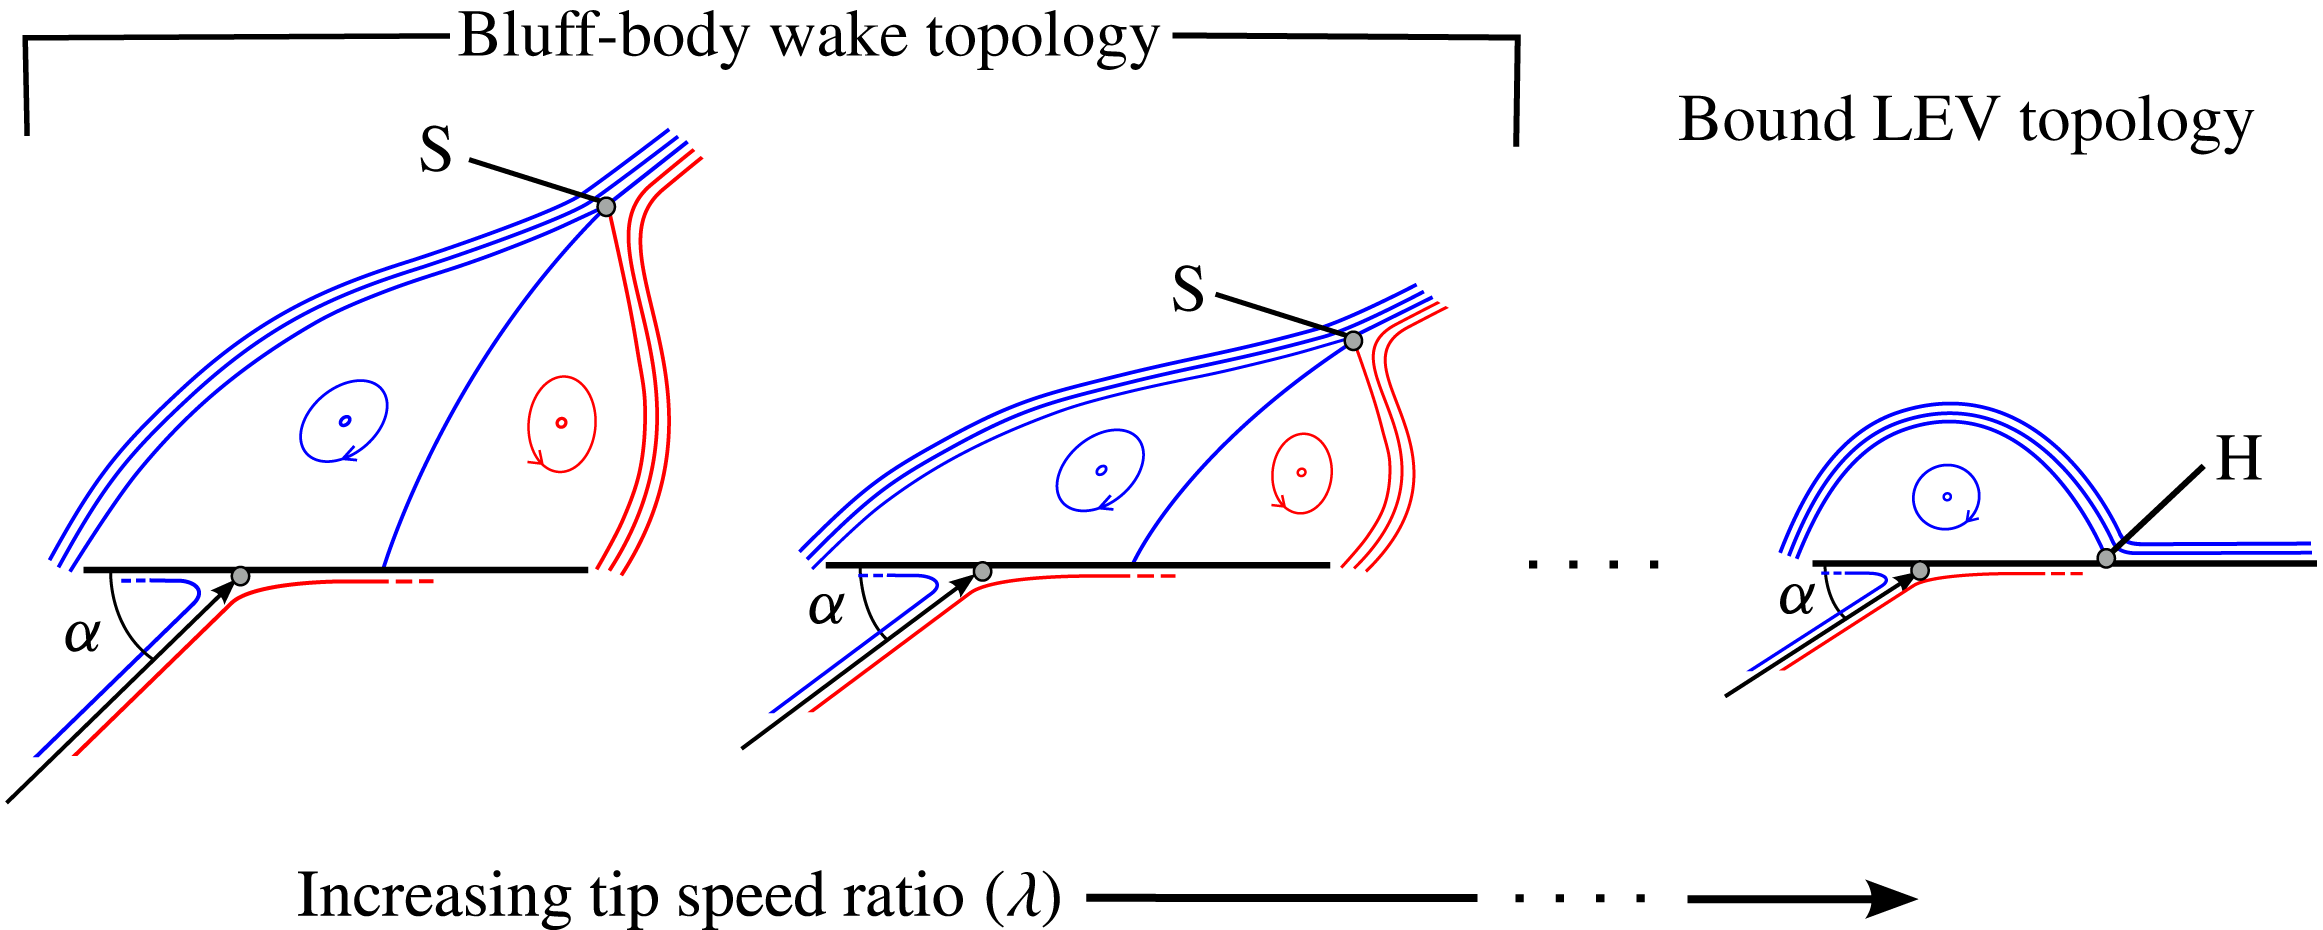
Mean flow topology over a rotating flat plate at a given spanwise position. For a non-zero
 $V_{\infty }$
, the mean wake must transition from a bluff-body wake to a bound LEV topology as the tip speed ratio increases, such that the full-saddle point, S, is replaced by a half-saddle, H. Note that the effective angle of attack,
 ${\it\alpha}$
, decreases with increasing tip speed ratio. A twisted plate will be compared to a flat plate in the experimental investigation in order to decouple the effects of tip speed ratio and angle of attack.

Consider a stationary plate in a non-zero free stream, such that the tip speed ratio is zero. Rotational fluid passes through the leading- and trailing-edge shear layers and rolls up into vortices that convect into the wake. A bluff-body wake of this type is characterized in the mean sense by a full-saddle point in the wake (see figure 1). As tip speed ratio is increased from zero, centrifugal force acts on the stagnant fluid in the recirculation zone, driving it in an outwards spanwise direction. We expect this draining of the recirculation zone to make it more compact, drawing the saddle point towards the plate. At what point will such a flow field exhibit a recognizable LEV, as observed in natural samara flight? For a sufficiently strong LEV, it is expected that the flow that separates from the leading edge will reattach behind the LEV. At some critical tip speed ratio, a topological transition must occur whereby the full-saddle point in the wake is replaced by a half-saddle on the plate, and a near-Kutta condition at the trailing edge becomes possible, as shown on the far right of figure 1. This topology will hereafter be referred to as a bound LEV. The gradual transition of the wake from that of a bluff-body wake to a bound LEV will be investigated using dye visualizations and particle image velocimetry (PIV). The consideration of topology on span-normal planes allows for a continuously variable description of the flow along the continuum of tip speed ratio; this is achieved through the estimation of the saddle point location. The topological approach serves as a complement to direct vortex identification methods that have been applied in previous LEV studies (Jones & Babinsky Reference Jones and Babinsky2011; Garmann et al. Reference Garmann, Visbal and Orkwis2013; Harbig et al. Reference Harbig, Sheridan and Thompson2013), with which the gradual transition from bluff-body vortex shedding to a stable LEV could be difficult to describe. In the current work, only mean flow fields will be studied using PIV, noting that the conditions that are expected to generate the bound LEV topology in the mean sense are the same as those that favour a stably attached LEV, i.e. rotation and low aspect ratio.
Unfortunately, tip speed ratio is a coupled metric. It both serves as a dimensionless measure of rotation, and affects the spanwise distribution of local effective angle of attack,
 ${\it\alpha}$
, according to the relation
 $$\begin{eqnarray}{\it\alpha}=\text{arctan}\left(\frac{V_{\infty }}{{\it\Omega}z}\right)+{\it\tau}(z)=\text{arctan}\left(\frac{1}{{\it\lambda}}\frac{R}{z}\right)+{\it\tau}(z),\end{eqnarray}$$
where
 $z$
is spanwise position, defined such that
 $z=0$
is at the centre of rotation, and
 ${\it\tau}(z)$
represents the geometric angle of incidence of the plate measured relative to the swept disk (the plane normal to the rotation vector);
 ${\it\tau}(z)$
varies along the span if the plate is twisted; for flat plates,
 ${\it\tau}$
is constant for all values of
 $z$
.
Bross, Ozen & Rockwell (Reference Bross, Ozen and Rockwell2013) investigated the effects of advance ratio on the LEV, where they define advance ratio to be the reciprocal of tip speed ratio as defined in the present study. In order to maintain an effective angle of attack of 45° at the midspan for all tested values of advance ratio, they used flat plates at different angles of incidence, i.e. different values of
 ${\it\tau}$
. Shortly after the onset of rotation, they showed the leading-edge vorticity distribution to be relatively insensitive to changes in advance ratio; at large values of rotation (up to 270°), the leading-edge vorticity distribution becomes more diffuse at greater advance ratios, i.e. lower tip speed ratios.
In the PIV study presented herein, the effects of tip speed ratio and effective angle of attack are fully decoupled by comparing a flat plate (
 ${\it\tau}(z)\equiv 0$
) and a plate twisted along the spanwise axis (non-zero
 ${\it\tau}(z)$
that varies along the span). The chosen twist profile is such that the spanwise distribution of effective angle of attack (along the whole span) is the same for the twisted plate and the flat plate at different values of tip speed ratio. In this way, the changes in the flow field can be observed for different tip speed ratios at a constant distribution of effective angle of attack, and vice versa. Using PIV, the mean flow topology will be qualitatively observed on five span-normal planes; the leading-edge circulation will be also quantified on these same planes. The transient development of the LEV will not be considered herein; only the mean steady-state flow field will be considered, as taken over 100 rotations.
Dye visualizations were also conducted on two flat plates at different geometric angles of incidence:
 ${\it\tau}=0^{\circ }$
and
 $20^{\circ }$
. These visualizations provide a preliminary look at how tip speed ratio affects the flow topology, and complement the PIV study with a three-dimensional view of the flow field.
2. Experimental set-up
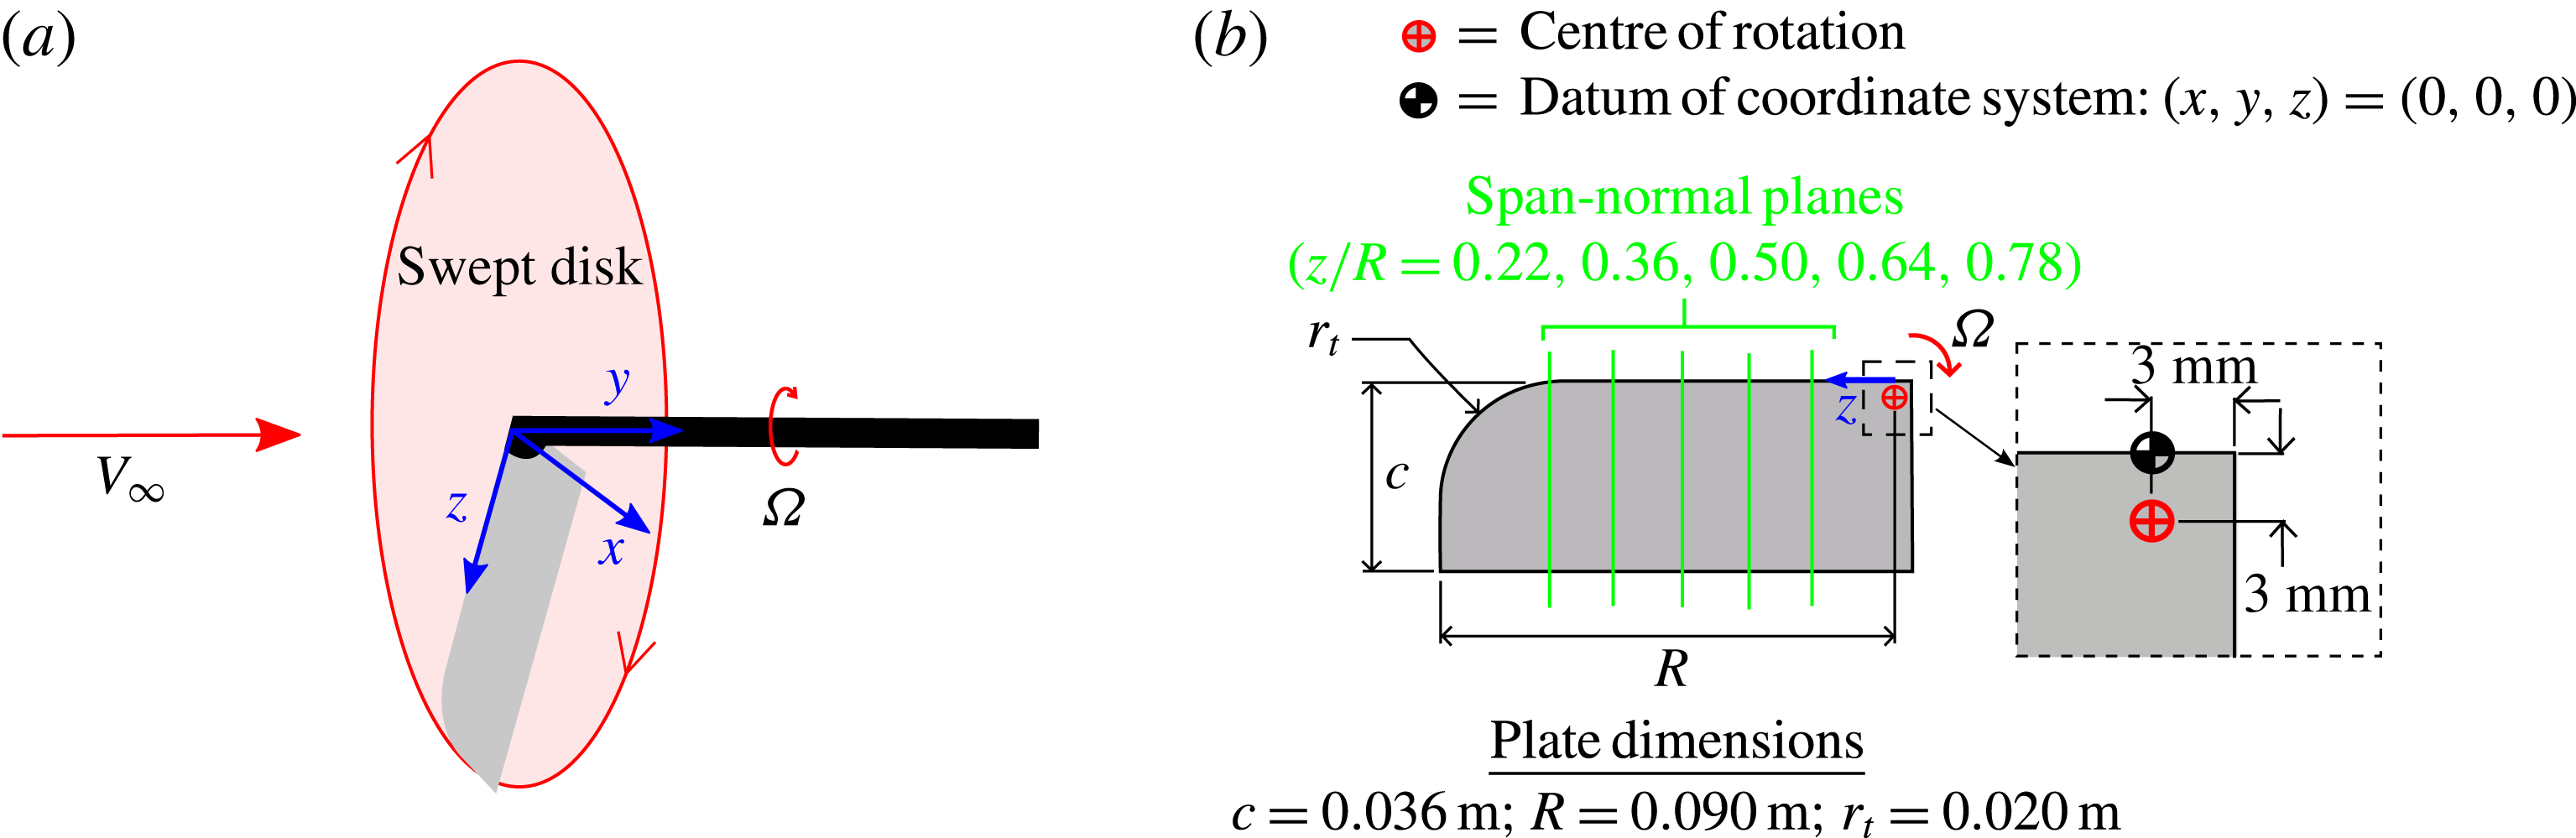
An abstraction of natural samara flight was experimentally investigated in a free-surface water tunnel at the University of Calgary, for which more details are provided in Wong, Kriegseis & Rival (Reference Wong, Kriegseis and Rival2013). A rotating plate was fixed along the axis of the tunnel, and subjected to a constant axial free-stream velocity,
 $V_{\infty }$
, as depicted in figure 2(a). In natural samara flight, coning angle is another kinematic parameter that varies across species. Coning angle was not considered in the present work in order to reduce the size of the parameter space, and to improve optical access for PIV. Coning angle was fixed at 0° for all test cases, as was also done by Lee et al. (Reference Lee, Lee and Sohn2014); in all test cases, the spanwise axis is perpendicular to the axis of rotation.
(a) Flow configuration for experiments, in which
 $V_{\infty }$
and
 ${\it\Omega}$
are varied to achieve different tip speed ratios,
 ${\it\lambda}$
. The plate-fixed coordinate system is centred at the leading edge in line with the root of rotation as shown. (b) The dimensions of the chosen planform. Velocity fields on five span-normal planes, as shown, were studied using PIV. The centre of rotation is 3 mm from the edge of the plate in both directions (
 $x$
and
 $z$
).

The chosen flow configuration can be described with four parameters: tip speed ratio, twist profile, aspect ratio (
 $AR$
) and Reynolds number (
 $\mathit{Re}$
), defined as
 $$\begin{eqnarray}\displaystyle AR & = & \displaystyle \displaystyle \frac{R}{c},\end{eqnarray}$$
 $$\begin{eqnarray}\displaystyle \mathit{Re} & = & \displaystyle \displaystyle \frac{cv_{mid}}{{\it\nu}},\end{eqnarray}$$
 $c$
is chord length,
 ${\it\nu}$
is kinematic viscosity and
 $v_{mid}$
is the local effective velocity at the midspan, defined as
 $$\begin{eqnarray}v_{mid}=(V_{\infty }^{2}+({\it\Omega}R/2)^{2})^{1/2}.\end{eqnarray}$$
In previous work, Reynolds number has been defined at the tip (e.g. Bross et al. Reference Bross, Ozen and Rockwell2013) or at the plane of interest (e.g. Jones & Babinsky Reference Jones and Babinsky2010). In the present work, Reynolds number is defined at the midspan because it is central to the five PIV test planes, as described below.
A single planform was used for all test cases, such that
 $AR$
was not varied. The chosen planform was a rectangular plate with a rounded corner at the tip of the leading edge. The chosen values of
 $R$
,
 $c$
and radius of curvature at the tip,
 $r_{t}$
, are given in figure 2(b). The low
 $AR$
and rounded tip are characteristic of insect wings and some species of samaras. Relevant studies in the literature use rectangular plates with square corners, as well as rounded, insect-inspired planforms.
Dye visualizations were completed on two flat plates with geometric angles of incidence of
 ${\it\tau}=0^{\circ }$
and
 $20^{\circ }$
, where
 ${\it\tau}$
is measured relative to the swept plane of the plate. The free-stream velocity was held constant at
 $0.016~\text{m}~\text{s}^{-1}$
, while rotational speed was varied to achieve tip speed ratios of 0, 1.2, 2.4 and 3.6. Reynolds number, as defined in (2.2), varied with tip speed ratio, but within a narrow enough range so as to expect minimal differences (
 $\mathit{Re}\in [573,1180]$
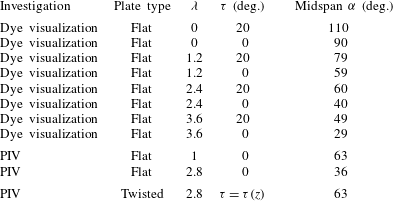
). The parameter space of the dye visualizations is given in table 1. These dye visualizations provide a preliminary look at how the flow topology changes with increasing tip speed ratio at different effective angles of attack. The effects of tip speed ratio and angle of attack were only fully decoupled in the PIV investigation.
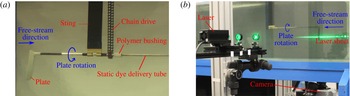
(a) Test apparatus for dye visualizations. Rotation of the plate is driven by a chain drive connected to an electric gear motor above the water line. (b) PIV set-up in the water tunnel. Two photos are taken once per rotation when the spanwise axis of the plate is perpendicular to the laser sheet. Five span-normal planes at different spanwise positions are sampled for each test case.

Plates and tip speed ratios,
 ${\it\lambda}$
, investigated using dye visualizations and PIV. For the twisted plate investigated using PIV, the angle of incidence along the span varies as per the twist profile
 ${\it\tau}={\it\tau}(z)$
plotted in figure 6. The chosen twist profile achieves the same angle-of-attack distribution along the span at
 ${\it\lambda}=2.8$
as the flat plate at
 ${\it\lambda}=1$
.

Figure 3(a) shows the experimental dye set-up. Dye was injected into the flow from a hole on the pressure side of the plate near to the leading edge, at a spanwise location of
 $z/R=0.28$
. For each test, a pressure regulator was used to adjust the flow of dye until it was observed to barely exit the dye port and travel tightly around the leading edge. Dye was delivered to the pressure side port through the hollow shaft and hollow plate. A polymer bushing was used to allow relative rotation of the static dye delivery tube and the rotating shaft connected to the plate. The rotation of the plate was driven via chain drive by an electric gear motor above the surface of the water.
A PIV investigation was undertaken to separate the independent effects of tip speed ratio and effective angle of attack; this was achieved by employing a twisted plate, where the value of
 ${\it\tau}$
varies continuously along the span. The exact required twist profile would be an inverse tangent function, as per (1.2), which approaches a slope of zero as the argument grows large. For simplicity of construction, the actual twist angle of the plate was kept constant outboard of the midspan. At the root of rotation (
 $z=0$
), the geometric angle of incidence is zero relative to the swept disk (
 ${\it\tau}=0^{\circ }$
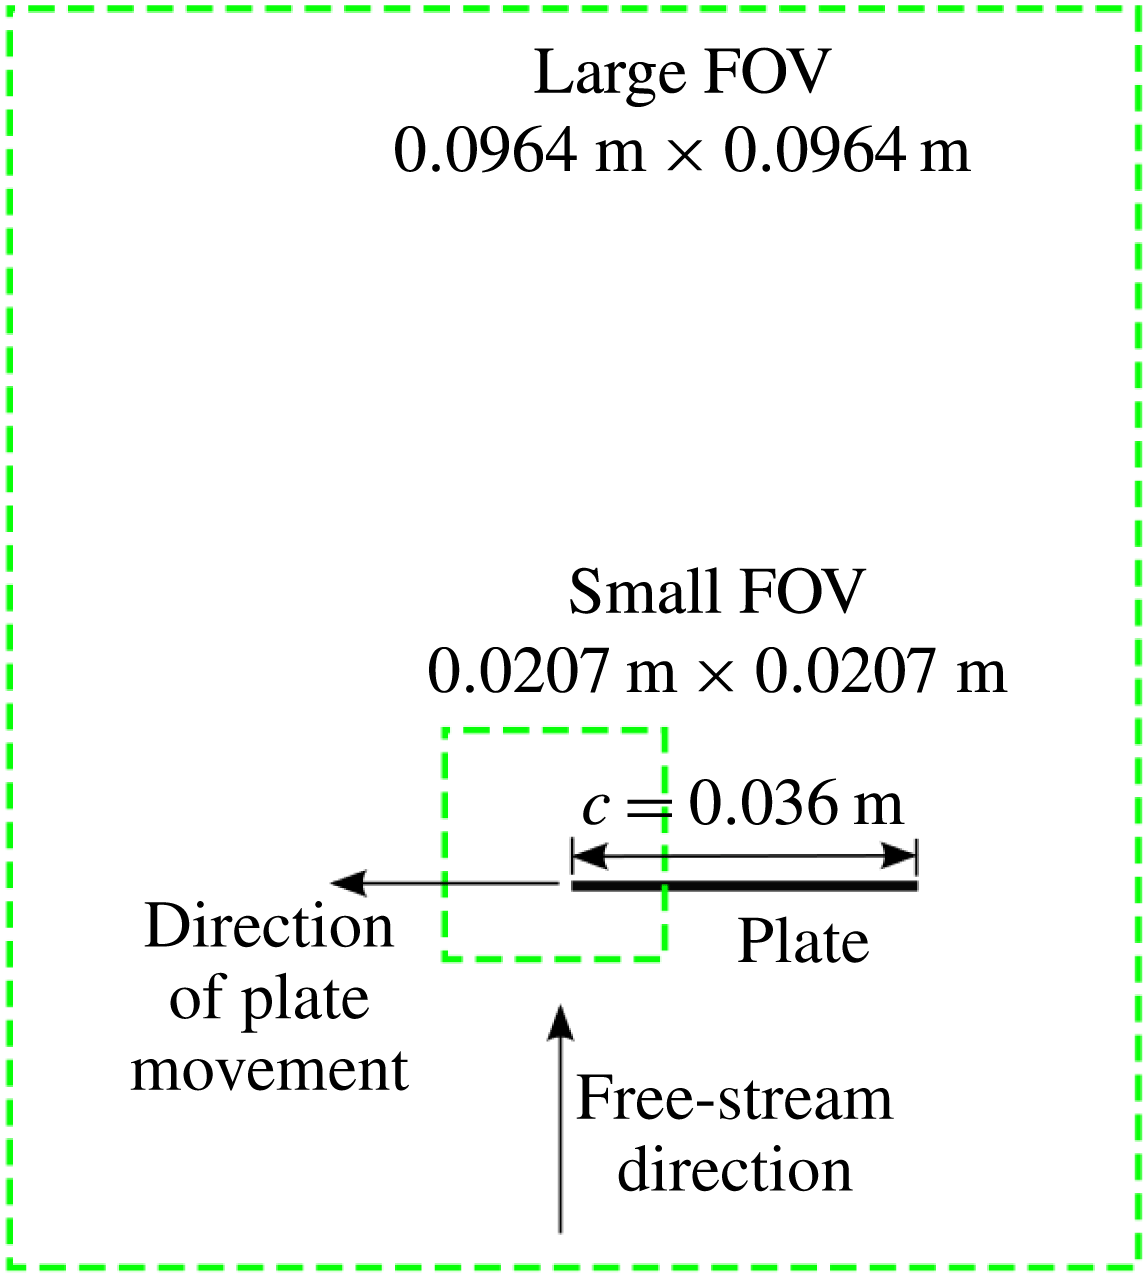
). Two different fields of view (FOVs) were used to quantify the flux of vorticity through the leading-edge shear layer (small FOV), and to view the overall flow topology and quantify mean circulation (large FOV). The width of these square FOVs were 0.0207 m and 0.0964 m, as shown in figure 4. The plate thickness was 1.57 mm, or
 $0.044c$
. Three test cases were investigated: a flat plate was tested at tip speed ratios of 1 and 2.8, alongside a twisted plate at a tip speed ratio of 2.8 (see table 1). Twist profile is measured relative to the swept disk of the plate, and
 ${\it\tau}(z)\equiv 0$
for the flat plate. For the twisted plate,
 ${\it\tau}(z)$
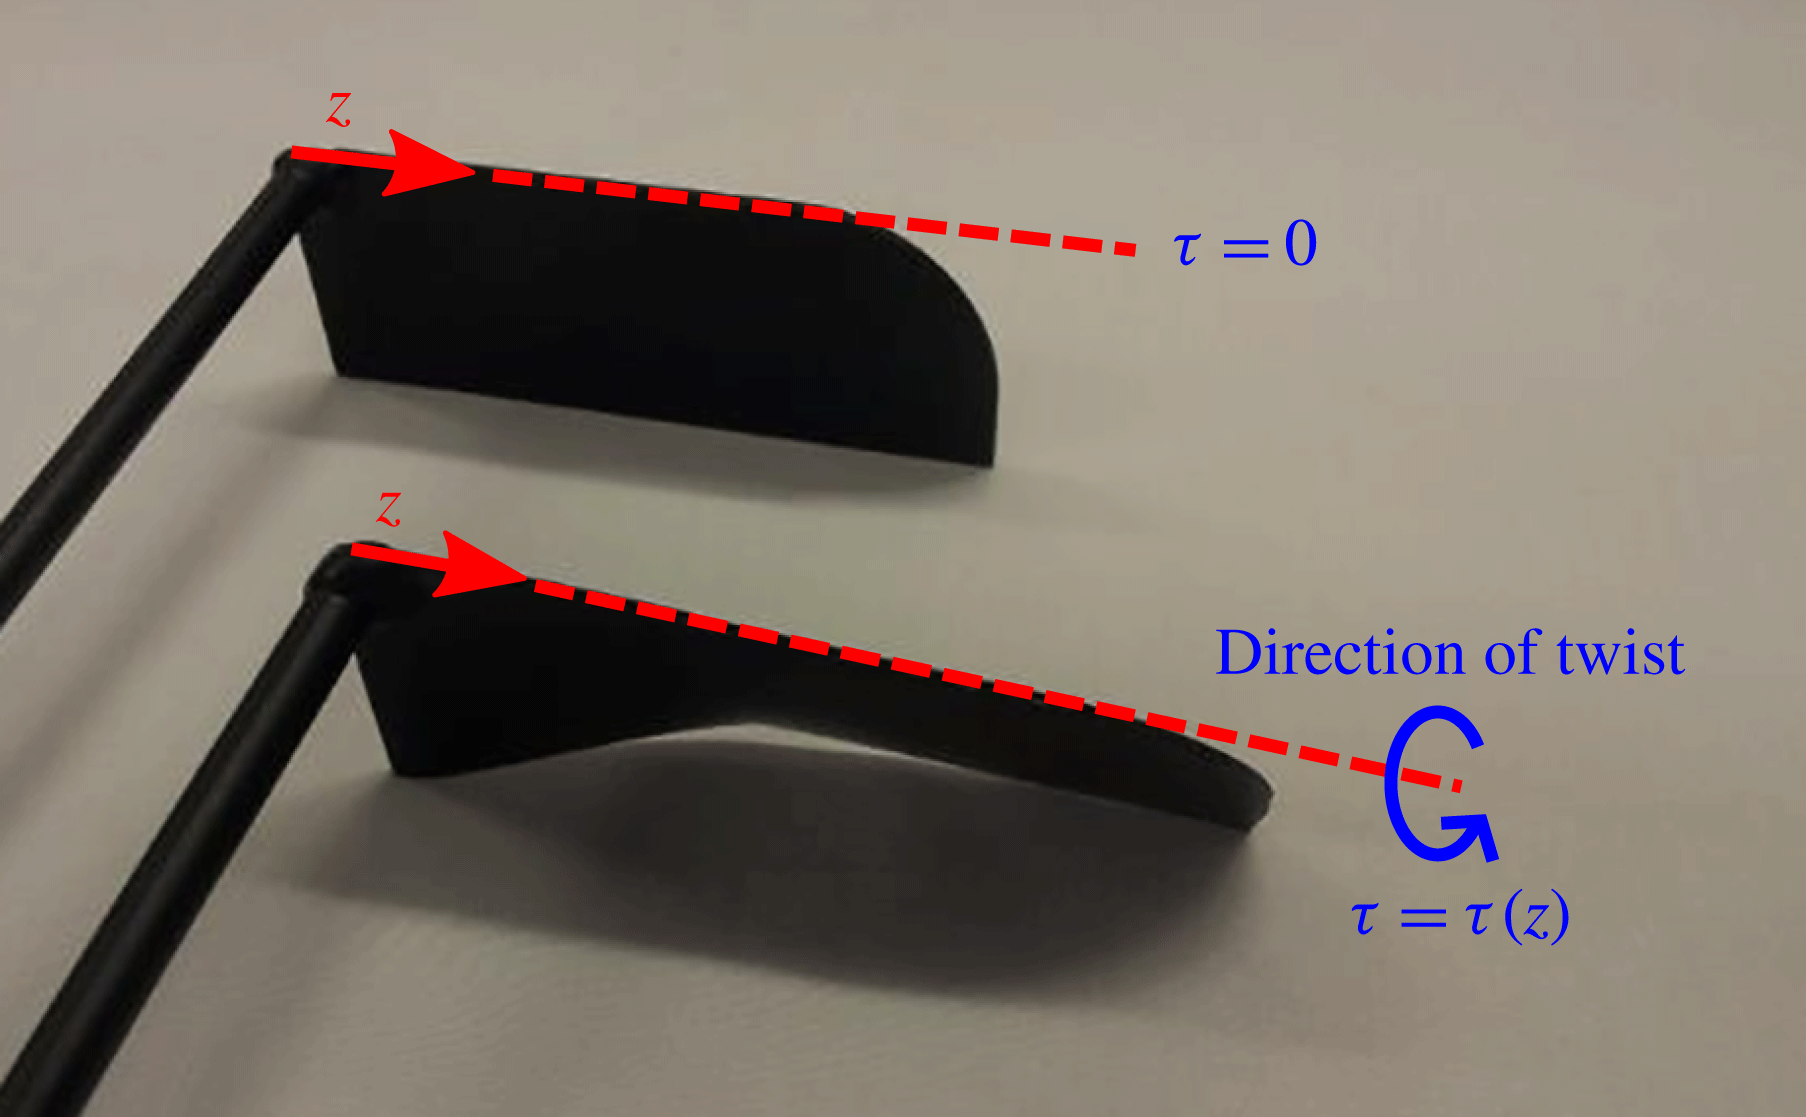
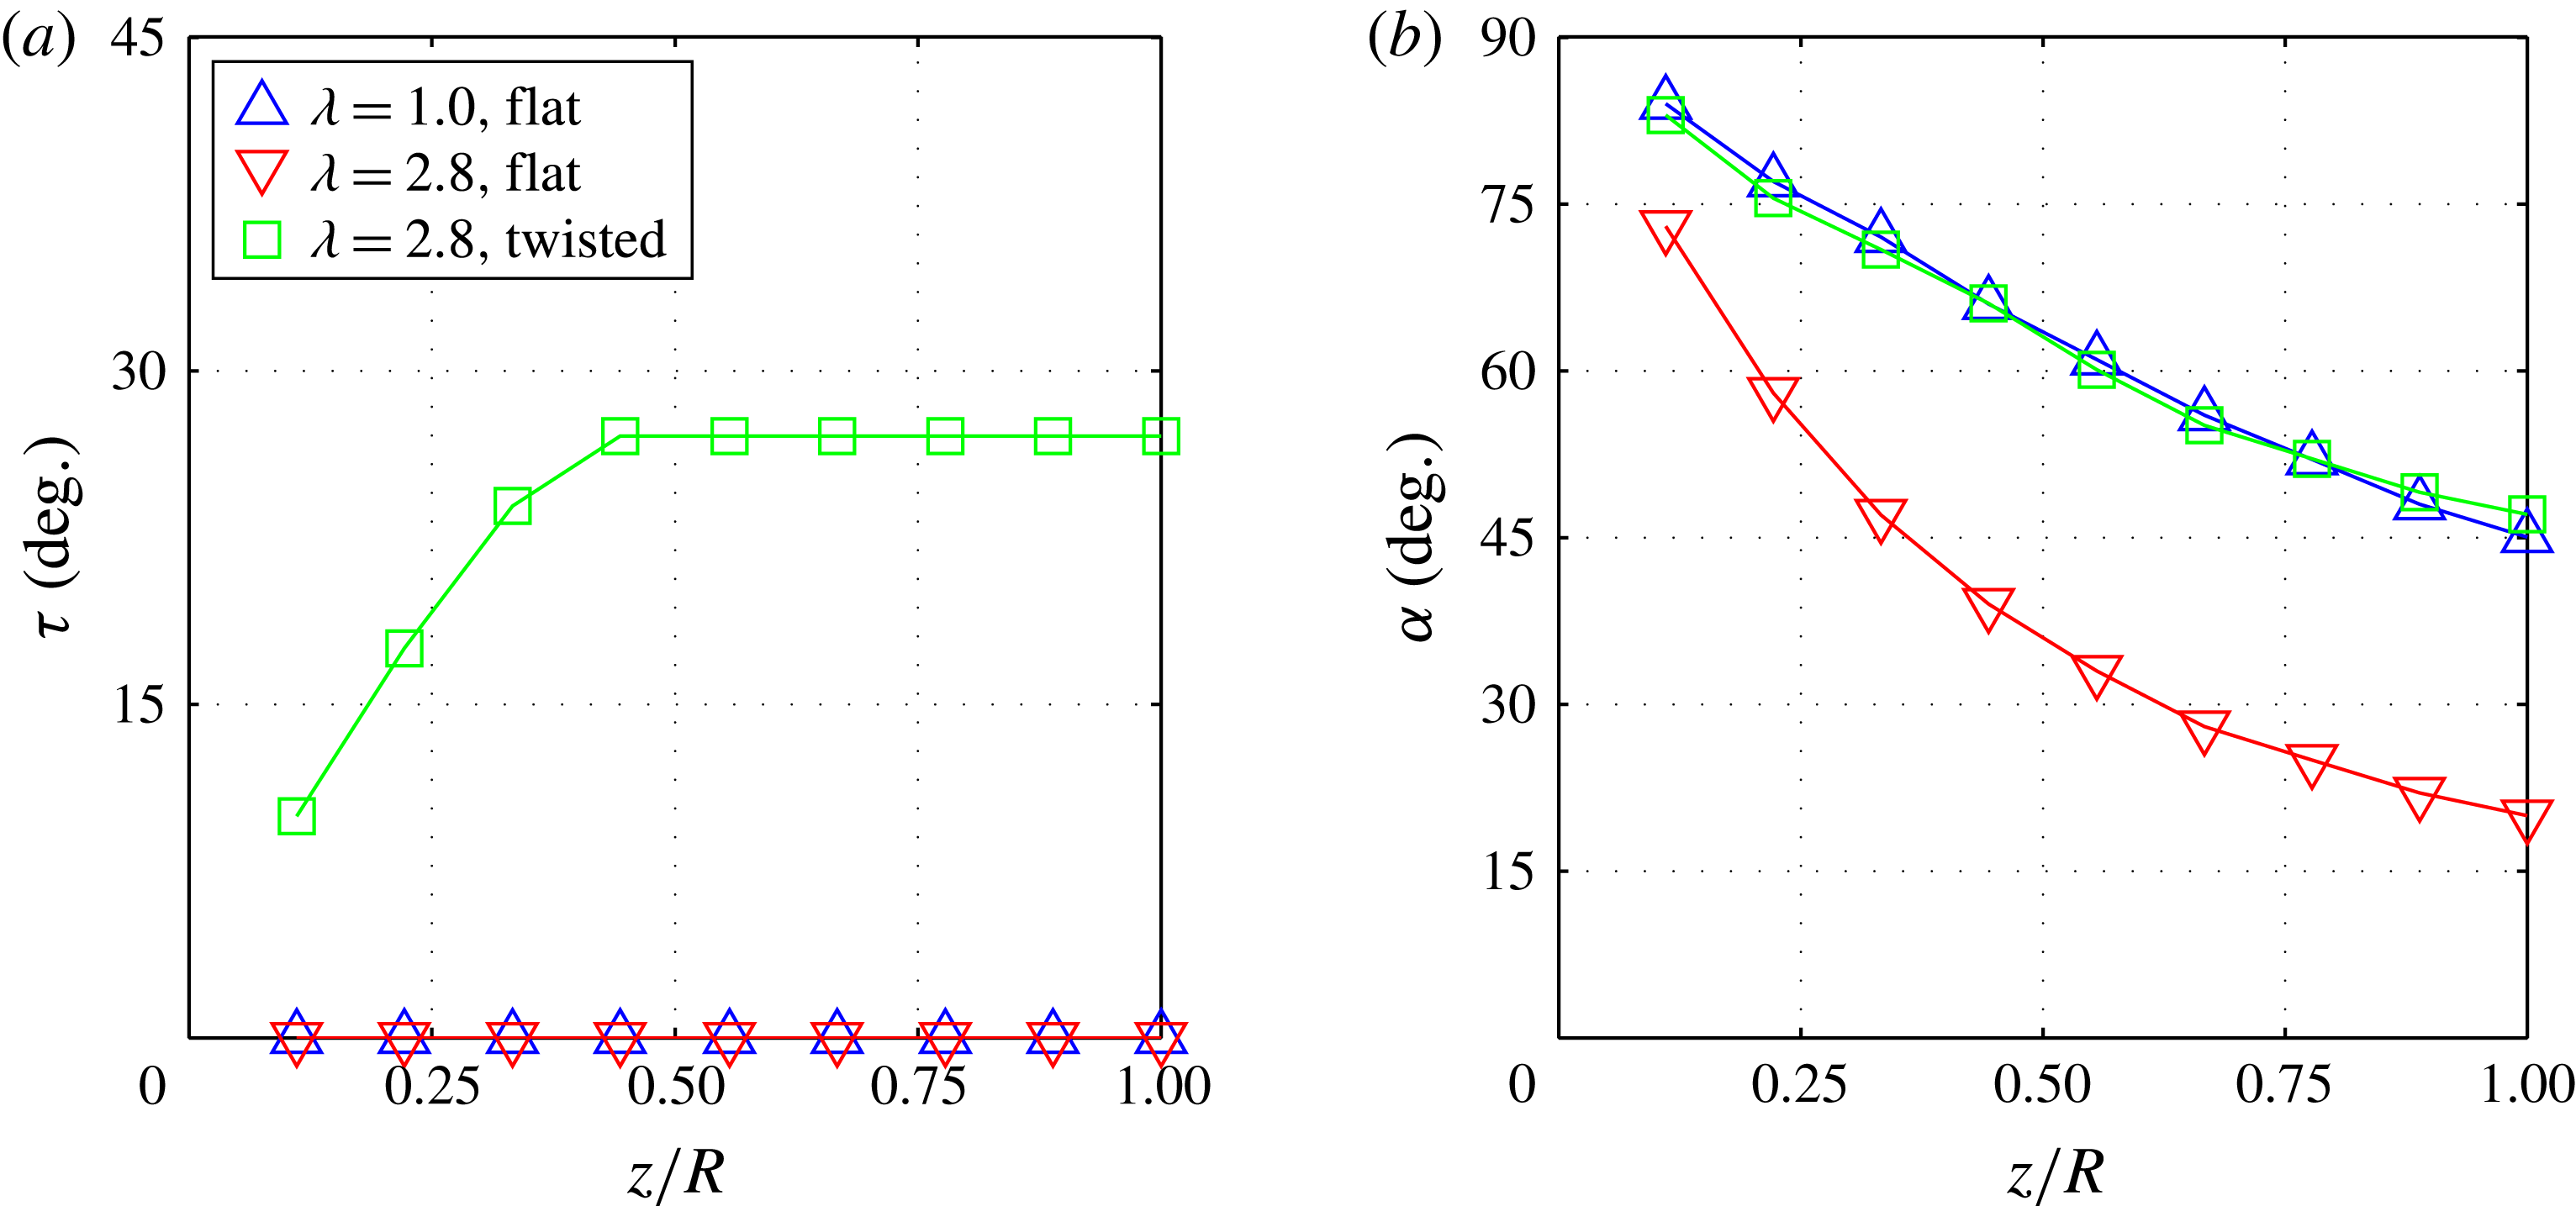
was chosen such that, at a tip speed ratio of 2.8, it has the same spanwise distribution of angle of attack as the flat plate at a tip speed ratio of 1. A photo of the flat and twisted plates is given in figure 5. The spanwise distributions of
 ${\it\tau}$
and
 ${\it\alpha}$
for the three test cases are shown in figure 6(a) and (b), respectively.
FOVs of the PIV investigation. Using a 105 mm lens, a small FOV was captured to quantify shear-layer vorticity flux on span-normal planes. The experiment was then repeated with a 60 mm lens to capture a larger FOV in order to determine the overall flow topology, and to quantify the mean circulation.

Photo of the twisted and flat plates. The twisted plate is twisted about the leading edge (spanwise axis) as shown. The twist profile
 ${\it\tau}(z)$
is chosen such that the
 ${\it\alpha}$
distribution of the twisted plate at
 ${\it\lambda}=2.8$
is equal to that of the flat plate at
 ${\it\lambda}=1$
(see figure 6).

(a) Twist,
 ${\it\tau}$
, versus normalized spanwise position,
 $z/R$
, for the three test cases. Twist is measured relative to the swept disk of the plate. (b) Local effective angle of attack,
 ${\it\alpha}$
, versus
 $z/R$
for all three test cases. For the twisted plate,
 ${\it\tau}(z)$
was chosen specifically to cause the shown collapse of its
 ${\it\alpha}$
distribution to that of the flat plate at
 ${\it\lambda}=1$
.

Reynolds number was held constant at the midspan for each test case: for the test case at a tip speed ratio of 1, the actual experimental value was
 $\mathit{Re}=1250$
; and for the test cases at a tip speed ratio of 2.8 it was
 $\mathit{Re}=1290$
. For each of the test cases, five span-normal planes were sampled at spanwise positions of approximately
 $0.22R$
,
 $0.36R$
,
 $0.50R$
,
 $0.64R$
and
 $0.78R$
, as shown in figure 2(b). Actual spanwise position varied slightly between test cases, and the measured spanwise position of each test plane is noted in the results. The experimental set-up for PIV is very similar to that which was used for the dye visualizations, with the PIV hardware replacing the dye delivery system, as depicted in figure 3(b). A Photron Fastcam SA4 camera was used with a 105 mm and a 60 mm lens to capture the small and large FOVs at frame rates of 500 Hz and 125 Hz, respectively. As the constantly rotating flat plate cut through the horizontal laser sheet, two consecutive images were captured when the span-normal plane was parallel to the laser sheet, yielding one correlation per rotation. Timing of the sampling was achieved with a phototransistor that changed state when the laser sheet was blocked by the passing of the plate. One hundred correlations per test plane were collected to allow the calculation of the mean velocity field.
Raw images from both cameras were captured at a resolution of 1024 pixel
 $\times$
1024 pixel, with a 12-bit depth. The spatial resolutions were
 $5.61\times 10^{-4}c$
and
 $2.61\times 10^{-3}c$
for the small and large FOVs, respectively. Multi-pass PIV correlations were performed: one pass with interrogation windows of 128 pixel
 $\times$
128 pixel and 75 % overlap, and two passes with interrogation windows of 16 pixel
 $\times$
16 pixel and 75 % overlap. This processing produced one vector for every four pixels, which amounts to one vector every
 $2.24\times 10^{-3}c$
for the small FOV, and every
 $0.0105c$
for the large FOV.
3. Results
3.1. Circulation on span-normal planes
The circulation associated with the leading-edge shear layer and LEV has been quantified, referred to hereafter as leading-edge circulation and denoted by
 ${\it\Gamma}$
. In the chosen coordinate system, only negative-signed vorticity is therefore summed in the calculation of leading-edge circulation, which for convenience will be taken to be positive. The calculation of leading-edge circulation thus is given by
 $$\begin{eqnarray}{\it\Gamma}=-\int _{A}{\it\omega}_{neg}\,\text{d}A\approx -\mathop{\sum }_{i}{\it\omega}_{neg,i}\,\text{d}A,\end{eqnarray}$$
where
 $A$
is the domain over which the summation is performed,
 $\text{d}A$
is the elemental area associated with a single measurement of vorticity, and
 ${\it\omega}_{neg,i}$
represents a single value of negative vorticity within the domain, such that
 $$\begin{eqnarray}{\it\omega}_{neg,i}=\left\{\begin{array}{@{}ll@{}}0,\quad & \text{if }{\it\omega}_{i}\geqslant 0,\\ {\it\omega}_{i},\quad & \text{if }{\it\omega}_{i}<0.\end{array}\right.\end{eqnarray}$$
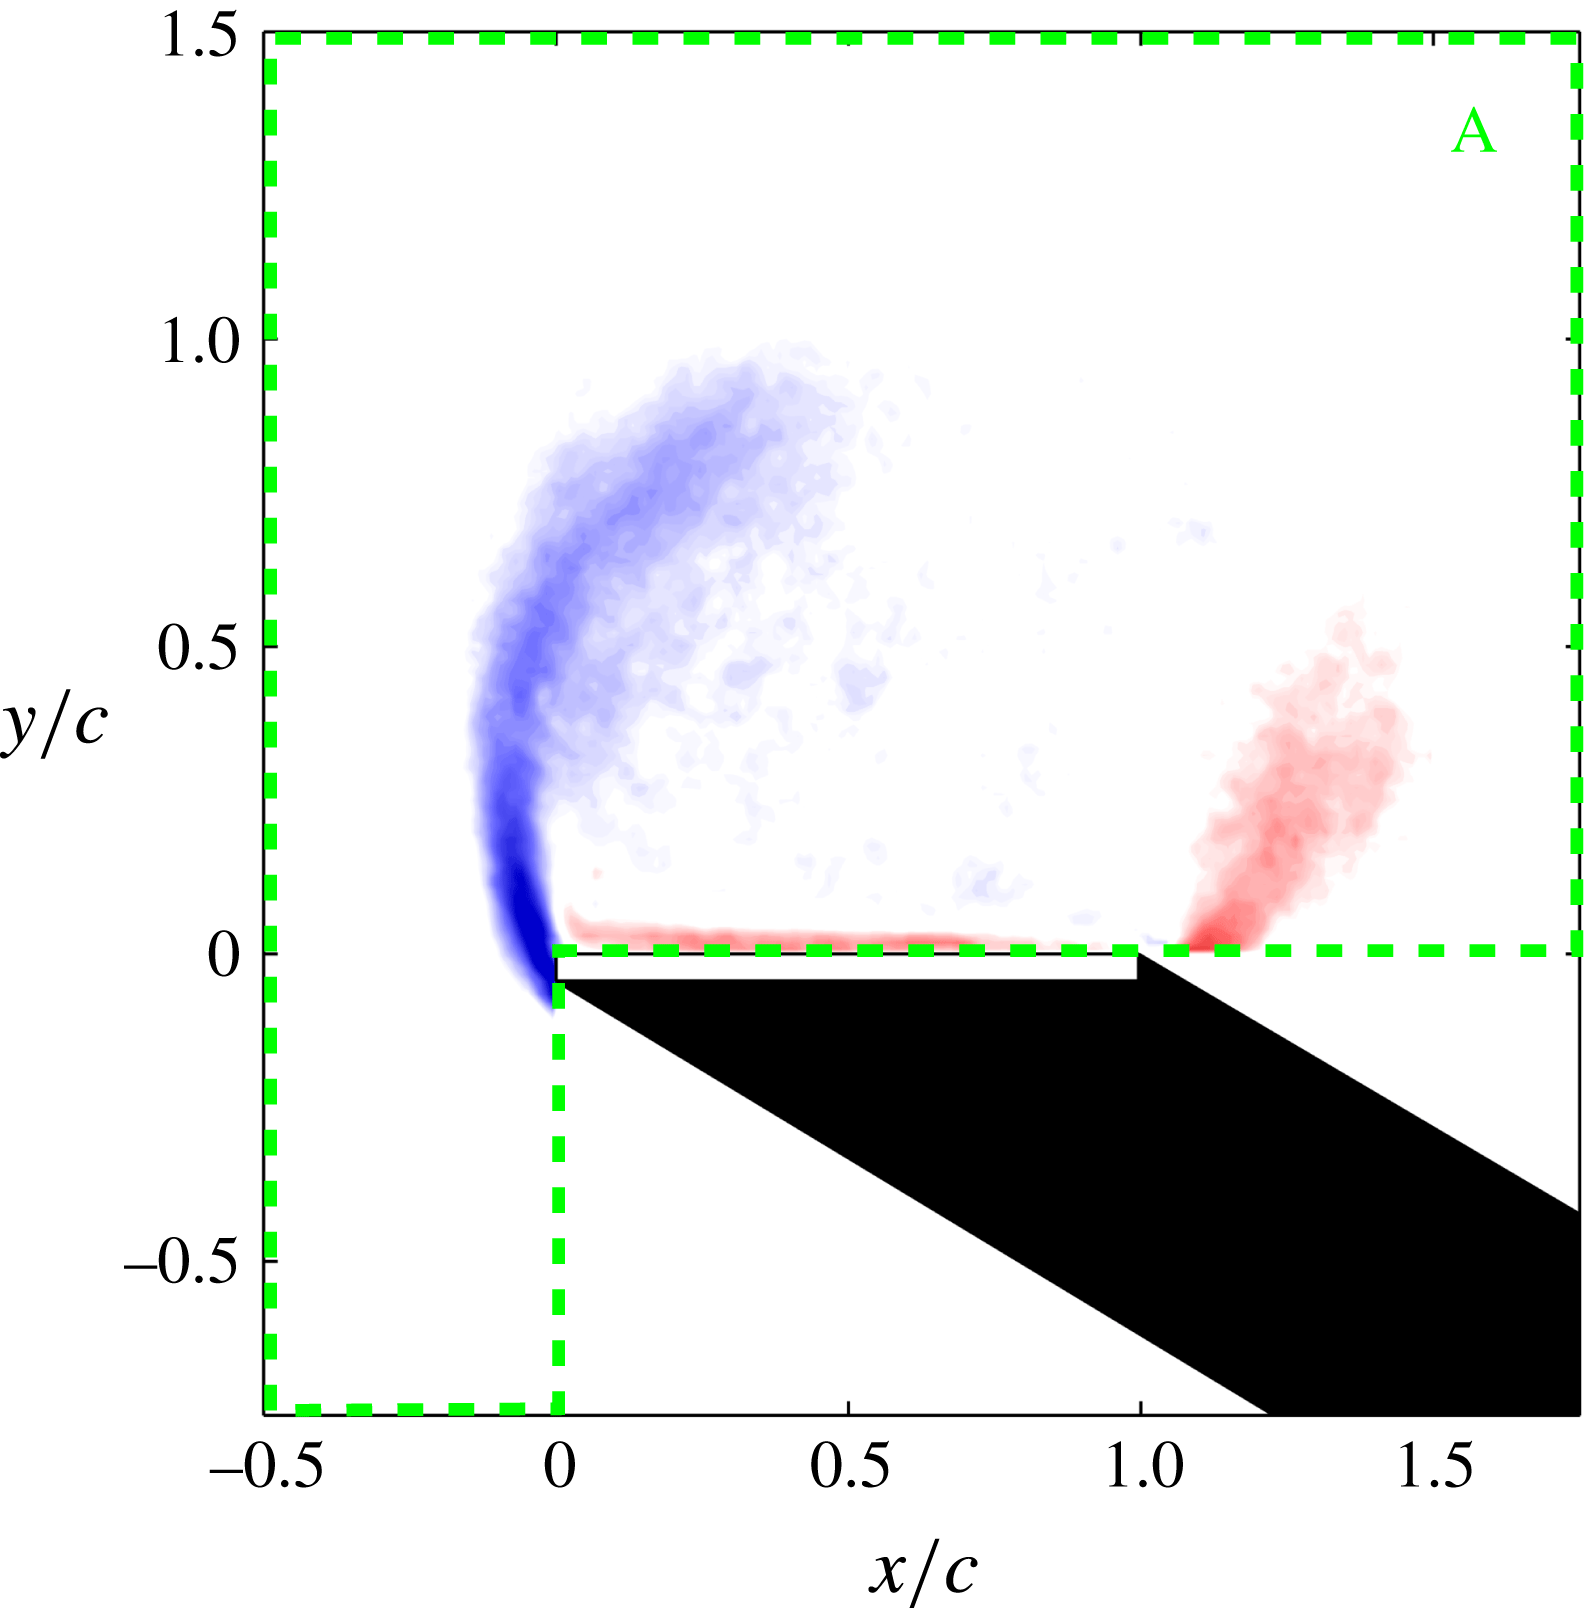
The domain of summation is above and ahead of the plate, as shown graphically in figure 7.
In the calculation of leading-edge circulation, only negative-signed vorticity data (shown on the left side; blue online) are summed over the domain A, the boundaries of which are shown with dashed lines (green online).

Leading-edge circulation is normalized locally to give
 $$\begin{eqnarray}{\it\Gamma}^{\ast }=\frac{{\it\Gamma}}{v_{eff}c},\end{eqnarray}$$
where
 $v_{eff}$
is the local effective velocity, calculated as
 $$\begin{eqnarray}v_{eff}=(V_{\infty }^{2}+({\it\Omega}z)^{2})^{1/2}.\end{eqnarray}$$
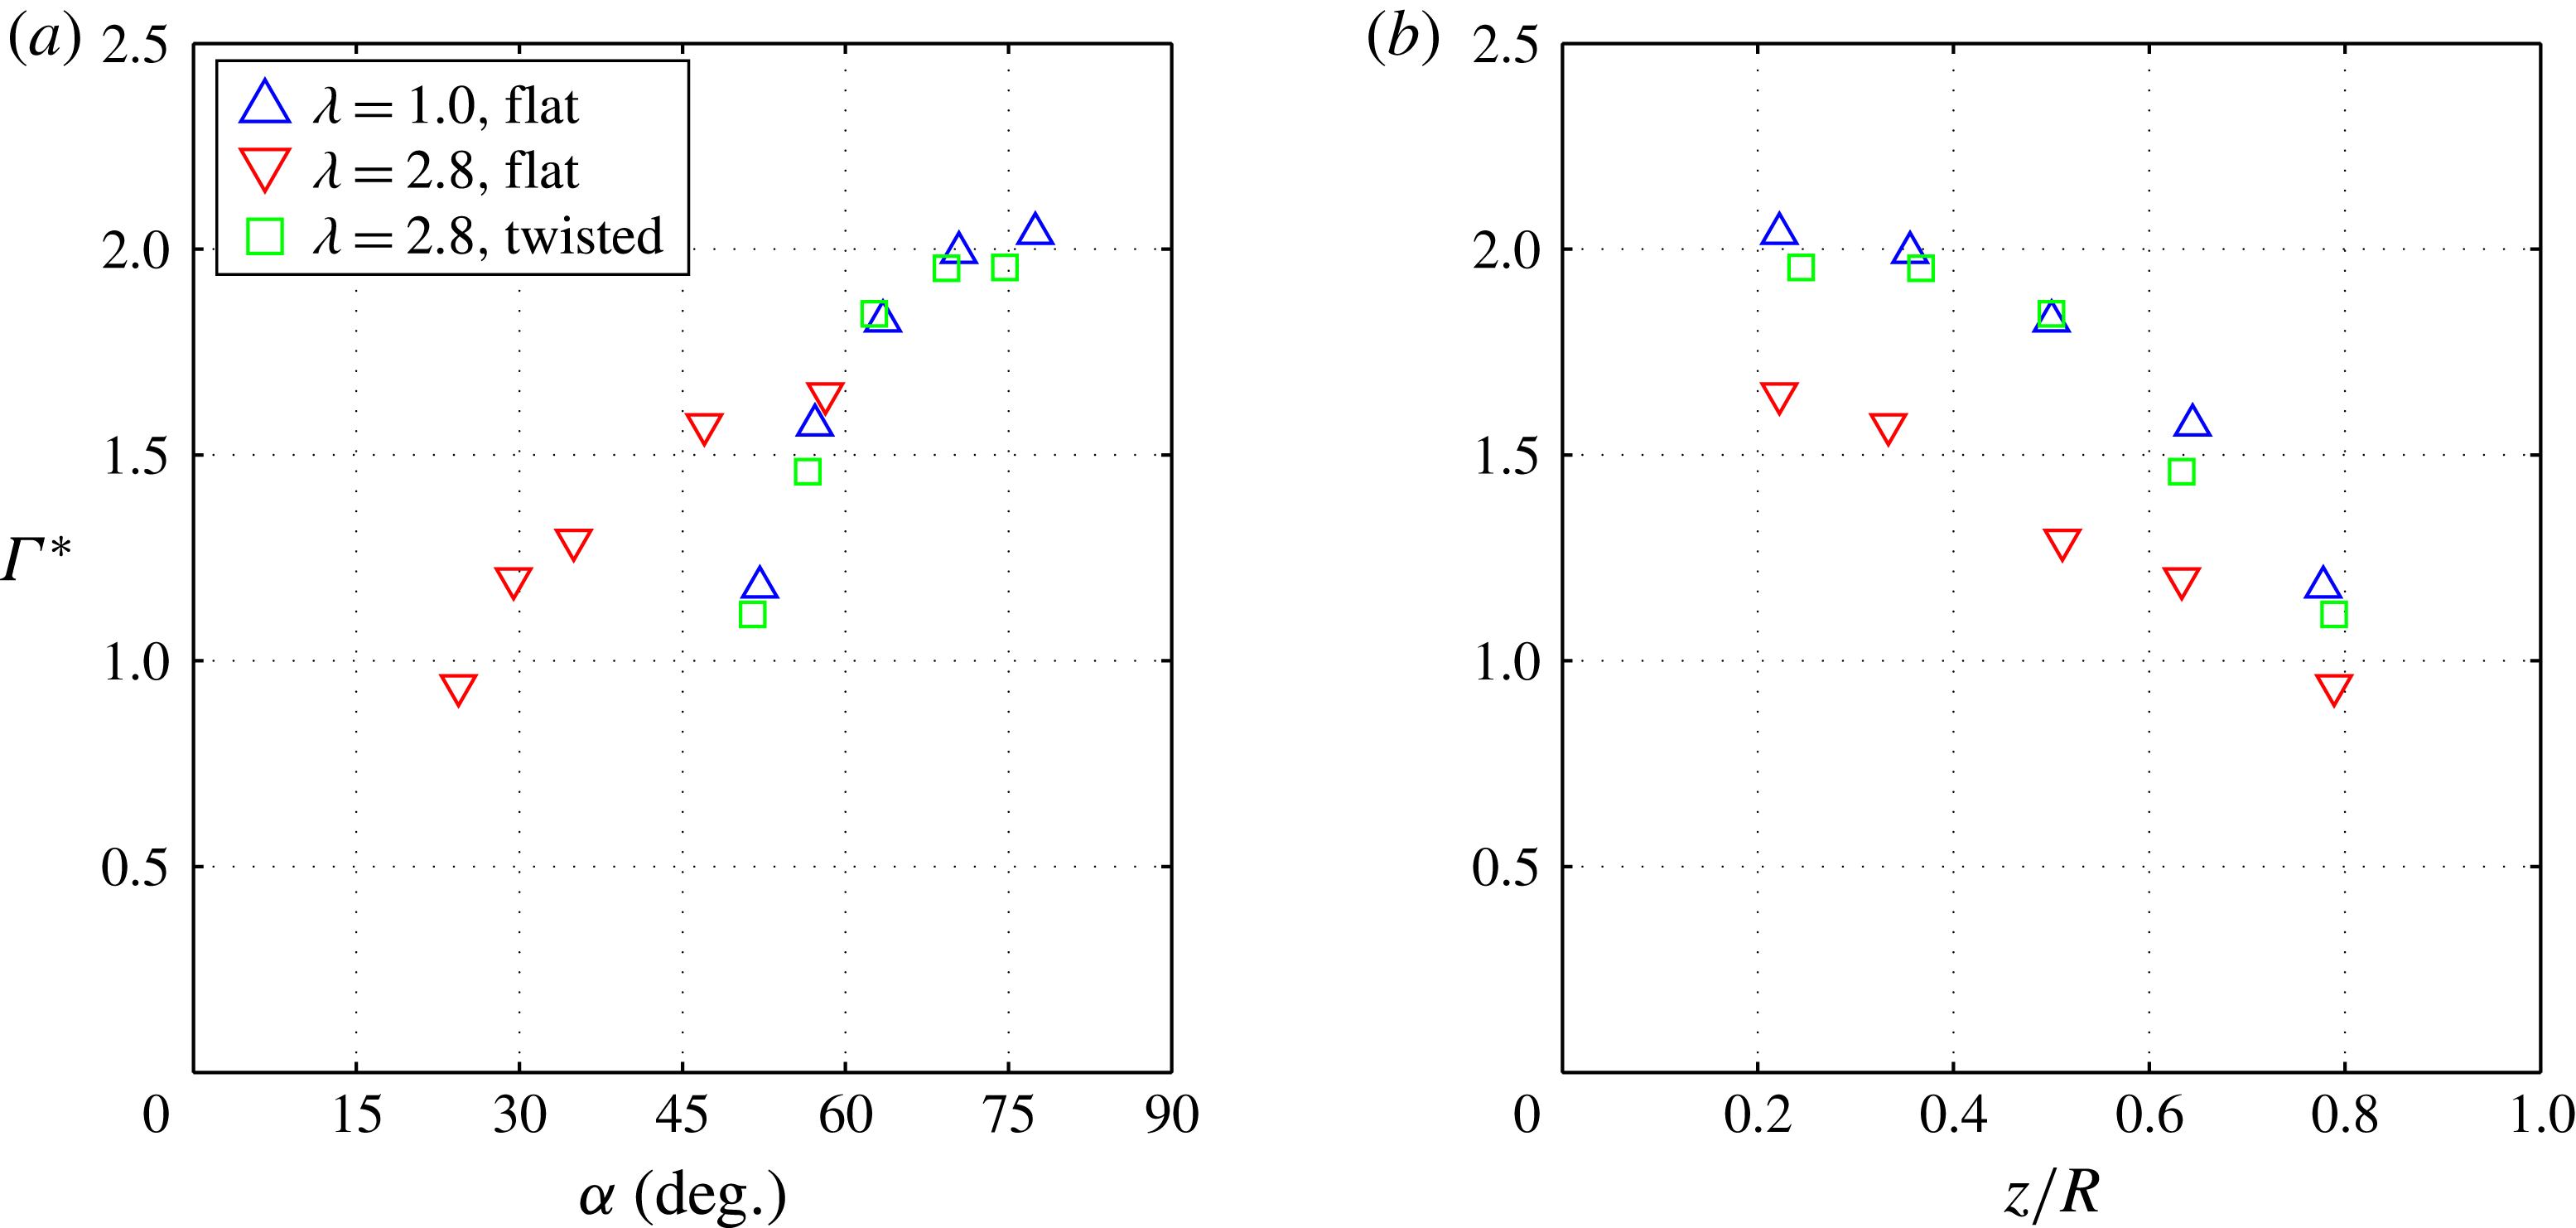
Figure 8(a) shows the calculated values of
 ${\it\Gamma}^{\ast }$
for each test plane plotted versus local effective angle of attack. Comparison of the twisted plate at a tip speed ratio of 2.8 and the flat plate at a tip speed ratio of 1 shows normalized leading-edge circulation to be independent of tip speed ratio at all spanwise locations. Circulation is uniquely defined when spanwise position, effective angle of attack and effective velocity are specified. In figure 8(b), normalized leading-edge circulation is plotted versus normalized spanwise position,
 $z/R$
; here it can be seen that, at a constant tip speed ratio of 2.8, the twisted plate exhibits greater leading-edge circulation at all sampled spanwise positions.
(a) Normalized leading-edge circulation,
 ${\it\Gamma}^{\ast }$
, versus local effective angle of attack,
 ${\it\alpha}$
. Trailing-edge vorticity is not accounted for in the calculation of
 ${\it\Gamma}^{\ast }$
. For each test case, each data point represents a different spanwise location. Circulation
 ${\it\Gamma}^{\ast }$
collapses all along the span for the twisted plate at
 ${\it\lambda}=2.8$
and the flat plate at
 ${\it\lambda}=1$
, showing
 ${\it\Gamma}^{\ast }$
to be independent of
 ${\it\lambda}$
. (b) Normalized leading-edge circulation versus normalized spanwise position,
 $z/R$
. For constant
 ${\it\lambda}=2.8$
, an increase in
 ${\it\alpha}$
at each spanwise location causes an increase in
 ${\it\Gamma}^{\ast }$
.

3.2. Flow topology
Using dye visualizations, flat plates in a constant free-stream velocity were investigated at four different tip speed ratios (
 ${\it\lambda}=0$
, 1.2, 2.4 and 3.6) at two fixed inclination angles relative to the swept disk (
 ${\it\tau}=0^{\circ }$
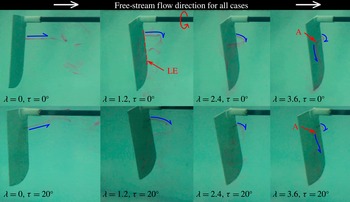
and 20°). The captured movies have been supplied as supplementary movies (available at http://dx.doi.org/10.1017/jfm.2015.279), and a snapshot of the movies is shown here in figure 9. The dye is observed to trace a streakline around the edge of the recirculation zone for each case. The streakline draws closer to the suction side of the plate with increasing tip speed ratio, which is attributed to the draining of the recirculation zone as spanwise flow increases. At a tip speed ratio of 3.6 for the
 ${\it\tau}=0^{\circ }$
test case, it is clear that the streakline stagnates onto the suction side of the plate, highlighting the existence of the bound LEV topology described in § 1. For the
 ${\it\tau}=20^{\circ }$
test case at a tip speed ratio of 3.6, the streakline spirals in a manner consistent with the presence of an LEV. For both values of
 ${\it\tau}$
, as tip speed ratio increases from zero, it is clear that the flow field gradually transitions from bluff-body vortex shedding to the presence of a recognizable, stable LEV.
Snapshots from the dye visualization movies at four tip speed ratios (
 ${\it\lambda}$
, increasing from left to right) and two fixed inclination angles of the flat plate relative to the swept disk (
 ${\it\tau}=0^{\circ }$
and 20°). The movies are synchronized by azimuthal angle. The direction of rotation is shown (red online) in the second image from the left in the top row; the leading edge is labelled as ‘LE’ (red online). Streaklines of dye (grey; purple online) emanate from the leading edge; the flow direction of these streaklines is highlighted with curved half-arrows (blue online) in each frame. The streakline is observed to draw closer to the plate with increasing tip speed ratio, and clearly stagnates onto the suction side of the plate at the highest tip speed ratio. Approximate stagnation point locations are labelled with the letter A (red online). Spanwise flow also becomes more prominent as tip speed ratio increases, highlighted with half-arrows (blue online) in the far right column.

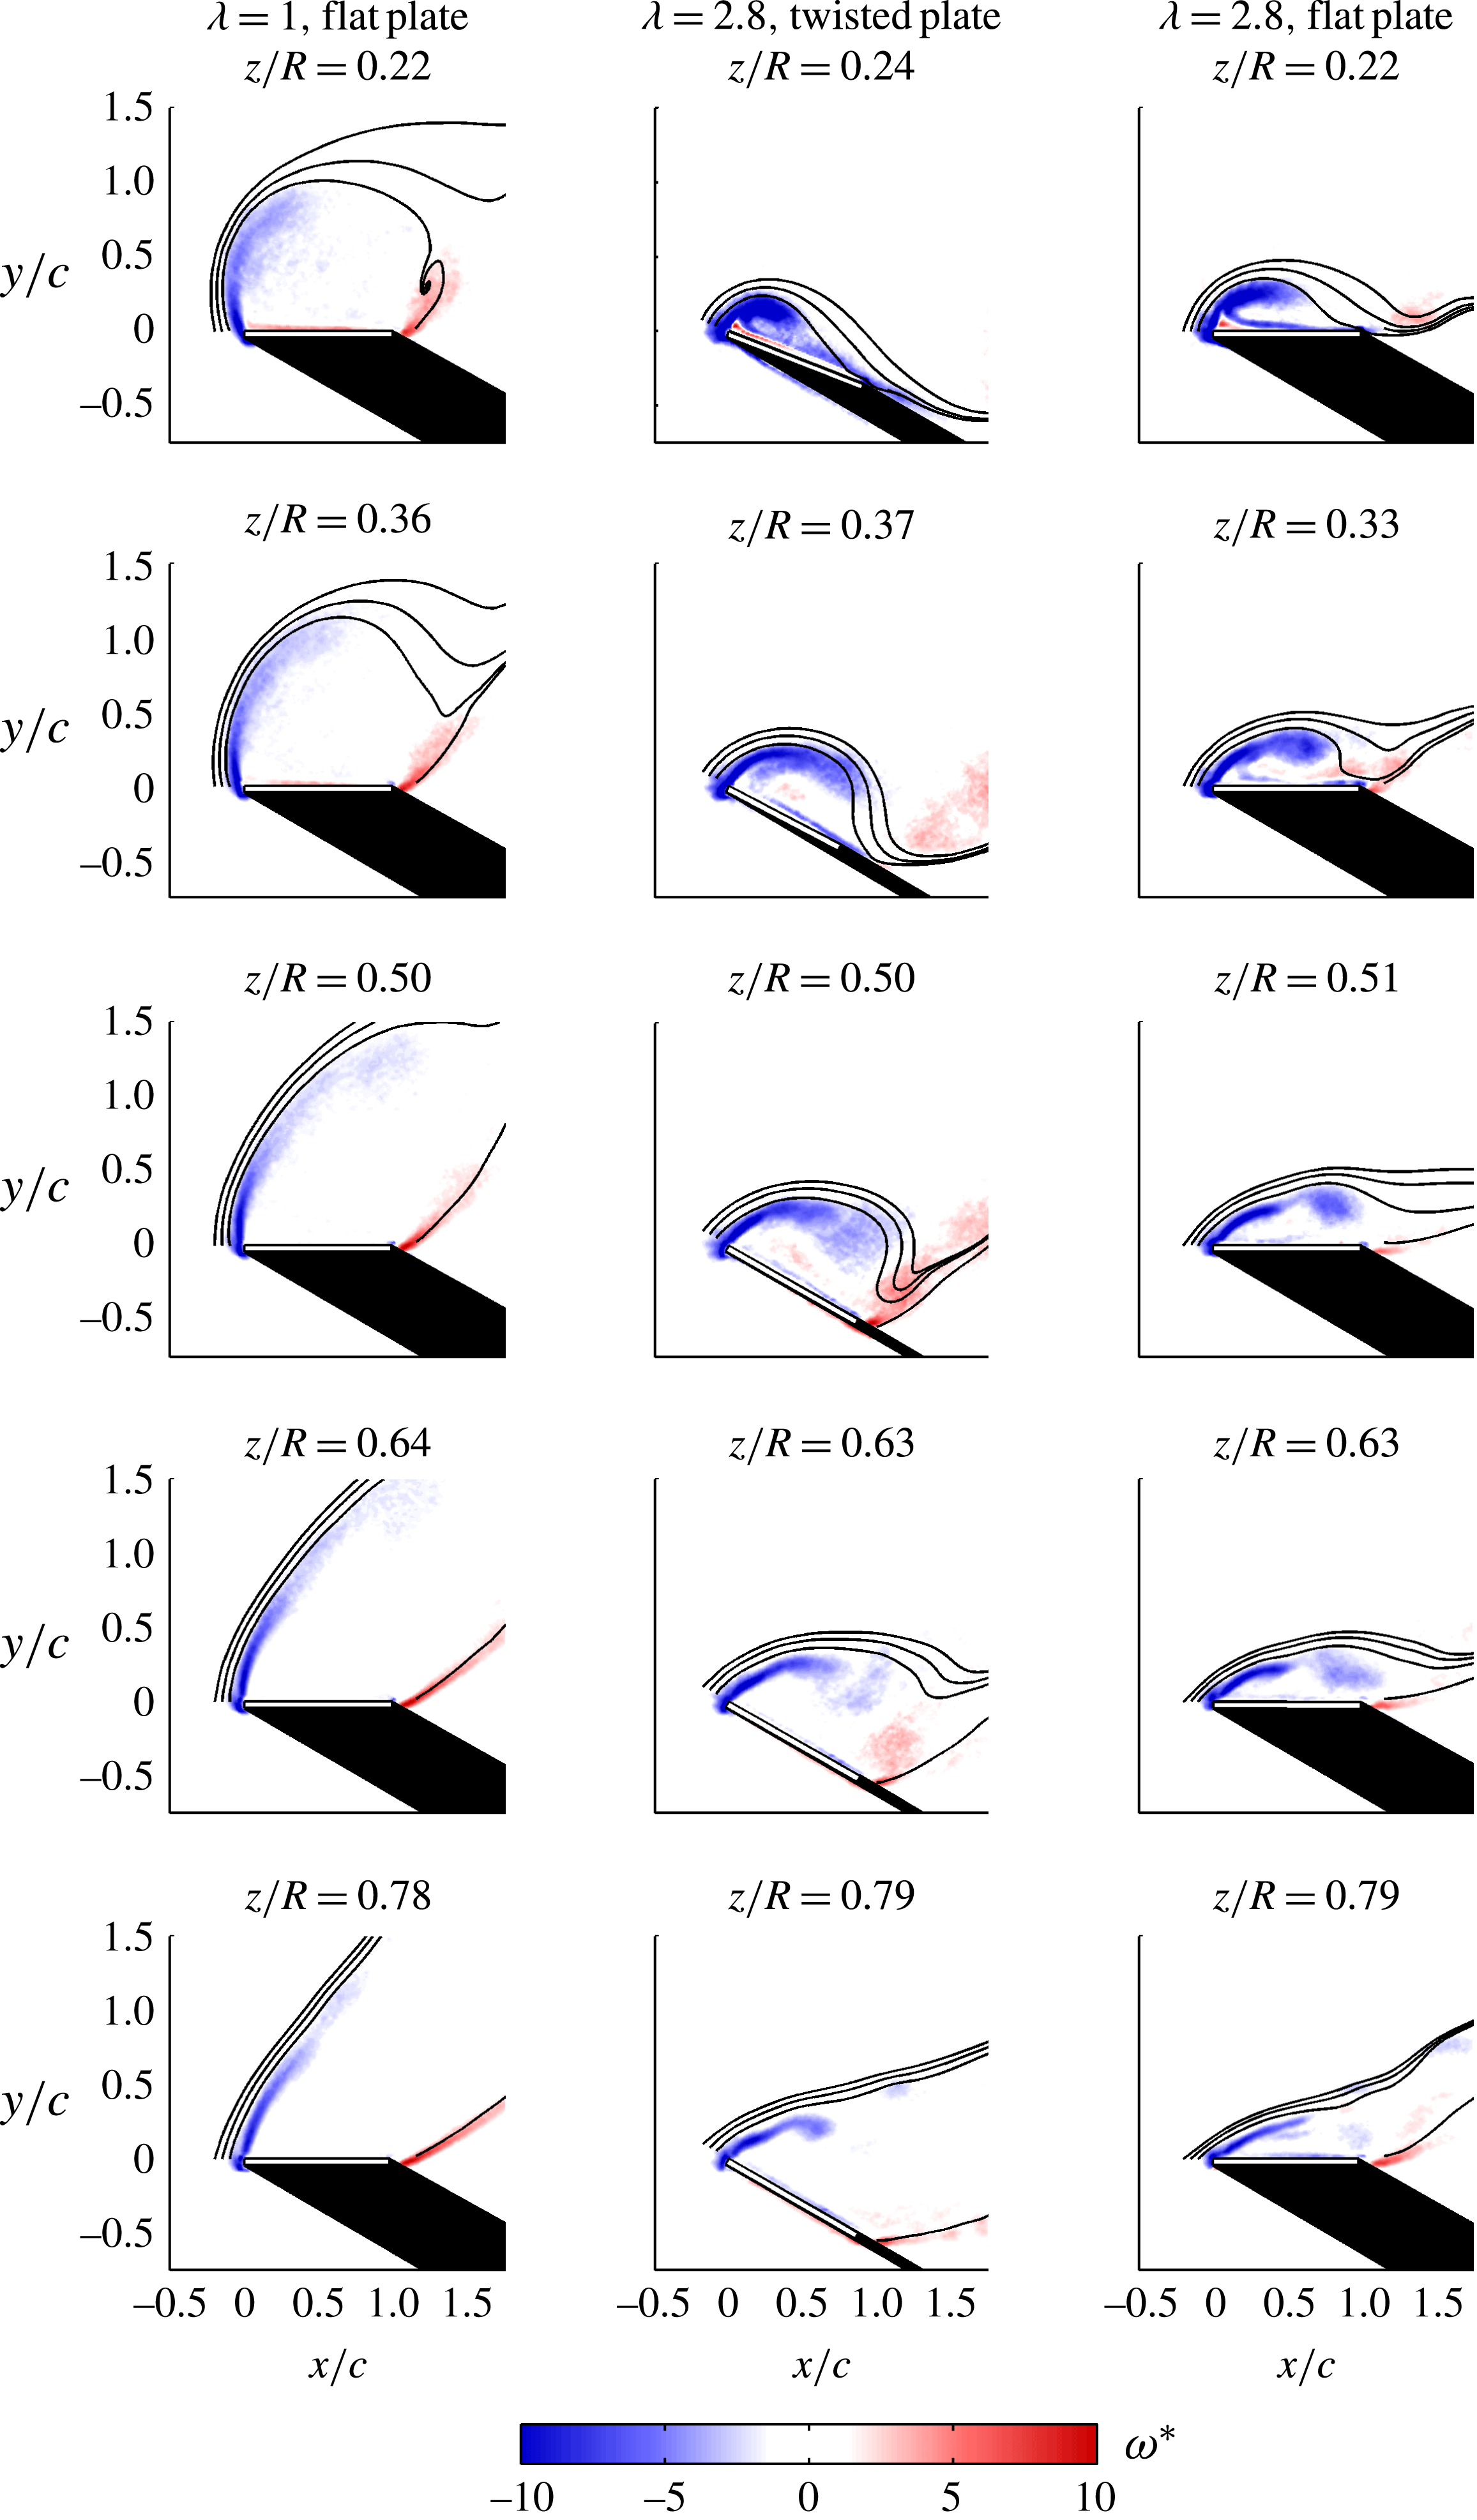
Contour plots of normalized spanwise vorticity,
 ${\it\omega}^{\ast }$
, from the mean velocity field of each test plane are shown in figure 10, where
 ${\it\omega}^{\ast }$
is defined as
 $$\begin{eqnarray}{\it\omega}^{\ast }=\frac{{\it\omega}_{z}c}{v_{eff}},\end{eqnarray}$$
and
 ${\it\omega}_{z}$
is the dimensional spanwise vorticity. One hundred PIV correlations (taken once per rotation) were averaged to obtain the mean velocity field on each test plane. The vorticity contours are overlaid with streamlines starting from the leading and trailing edges of the plate, as viewed from a plate-fixed frame of reference. At a tip speed ratio of 1, the flow separates from both the leading and trailing edges at all examined test planes. The mean velocity field resembles a bluff-body wake, featuring a full-saddle point above the suction side of the plate. At a tip speed ratio of 2.8, a bound LEV topology is observed at the most inboard planes, with the saddle point near to the trailing edge. On a given span-normal plane, decreasing tip speed ratio tends to redistribute the leading-edge vorticity to more closely resemble a free shear layer than a coherent LEV; this result is consistent with the findings of Bross et al. (Reference Bross, Ozen and Rockwell2013). For different angle-of-attack distributions at equal tip speed ratio, the flow topology was not greatly changed, as seen by comparing the centre and right columns in figure 10. For outboard planes, where the flow field resembles that of a bluff-body wake, the angles of the leading- and trailing-edge shear layers appear to be determined by local effective angle of attack, but tip speed ratio appears to have a greater effect on where a bound LEV is observed. The presence of significant trailing-edge vorticity at outboard planes is consistent with the results of the study by Ozen & Rockwell (Reference Ozen and Rockwell2012), wherein steadily rotating plates in a quiescent fluid were investigated.
Contours of normalized spanwise vorticity,
 ${\it\omega}^{\ast }$
, calculated from the mean velocity fields over the suction side of the plates. Darker grey (blue online) contours emanating from the leading edge (left side) represent negative vorticity, while lighter grey (red online) contours emanating primarily at the trailing edge represent positive vorticity. Black regions are in shadow. In-plane streamlines from the leading and trailing edges are shown to highlight the mean flow topology in the plate-fixed frame of reference. A more compact recirculation zone is observed at inboard planes (top rows) for higher
 ${\it\lambda}$
(centre and right columns), exhibiting the bound LEV topology.

3.3. Shear-layer measurements
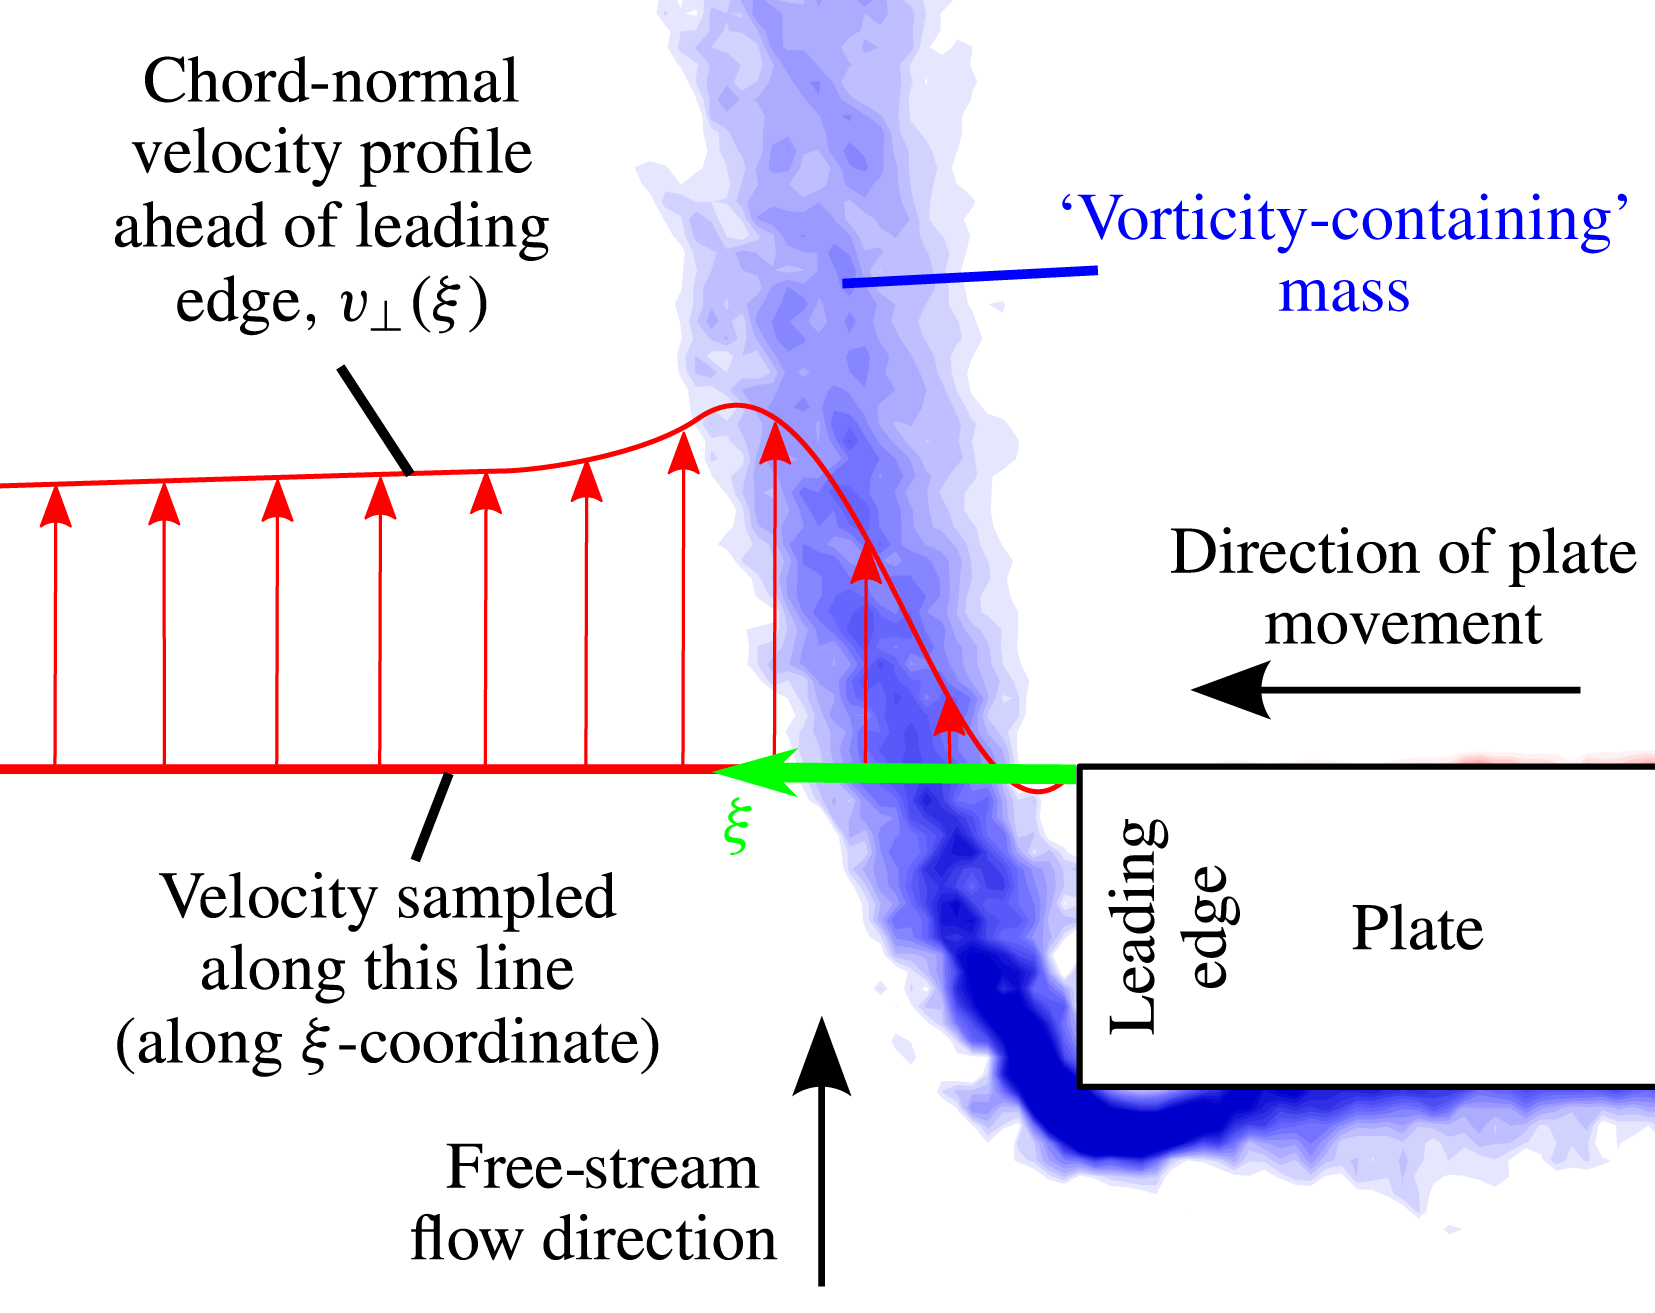
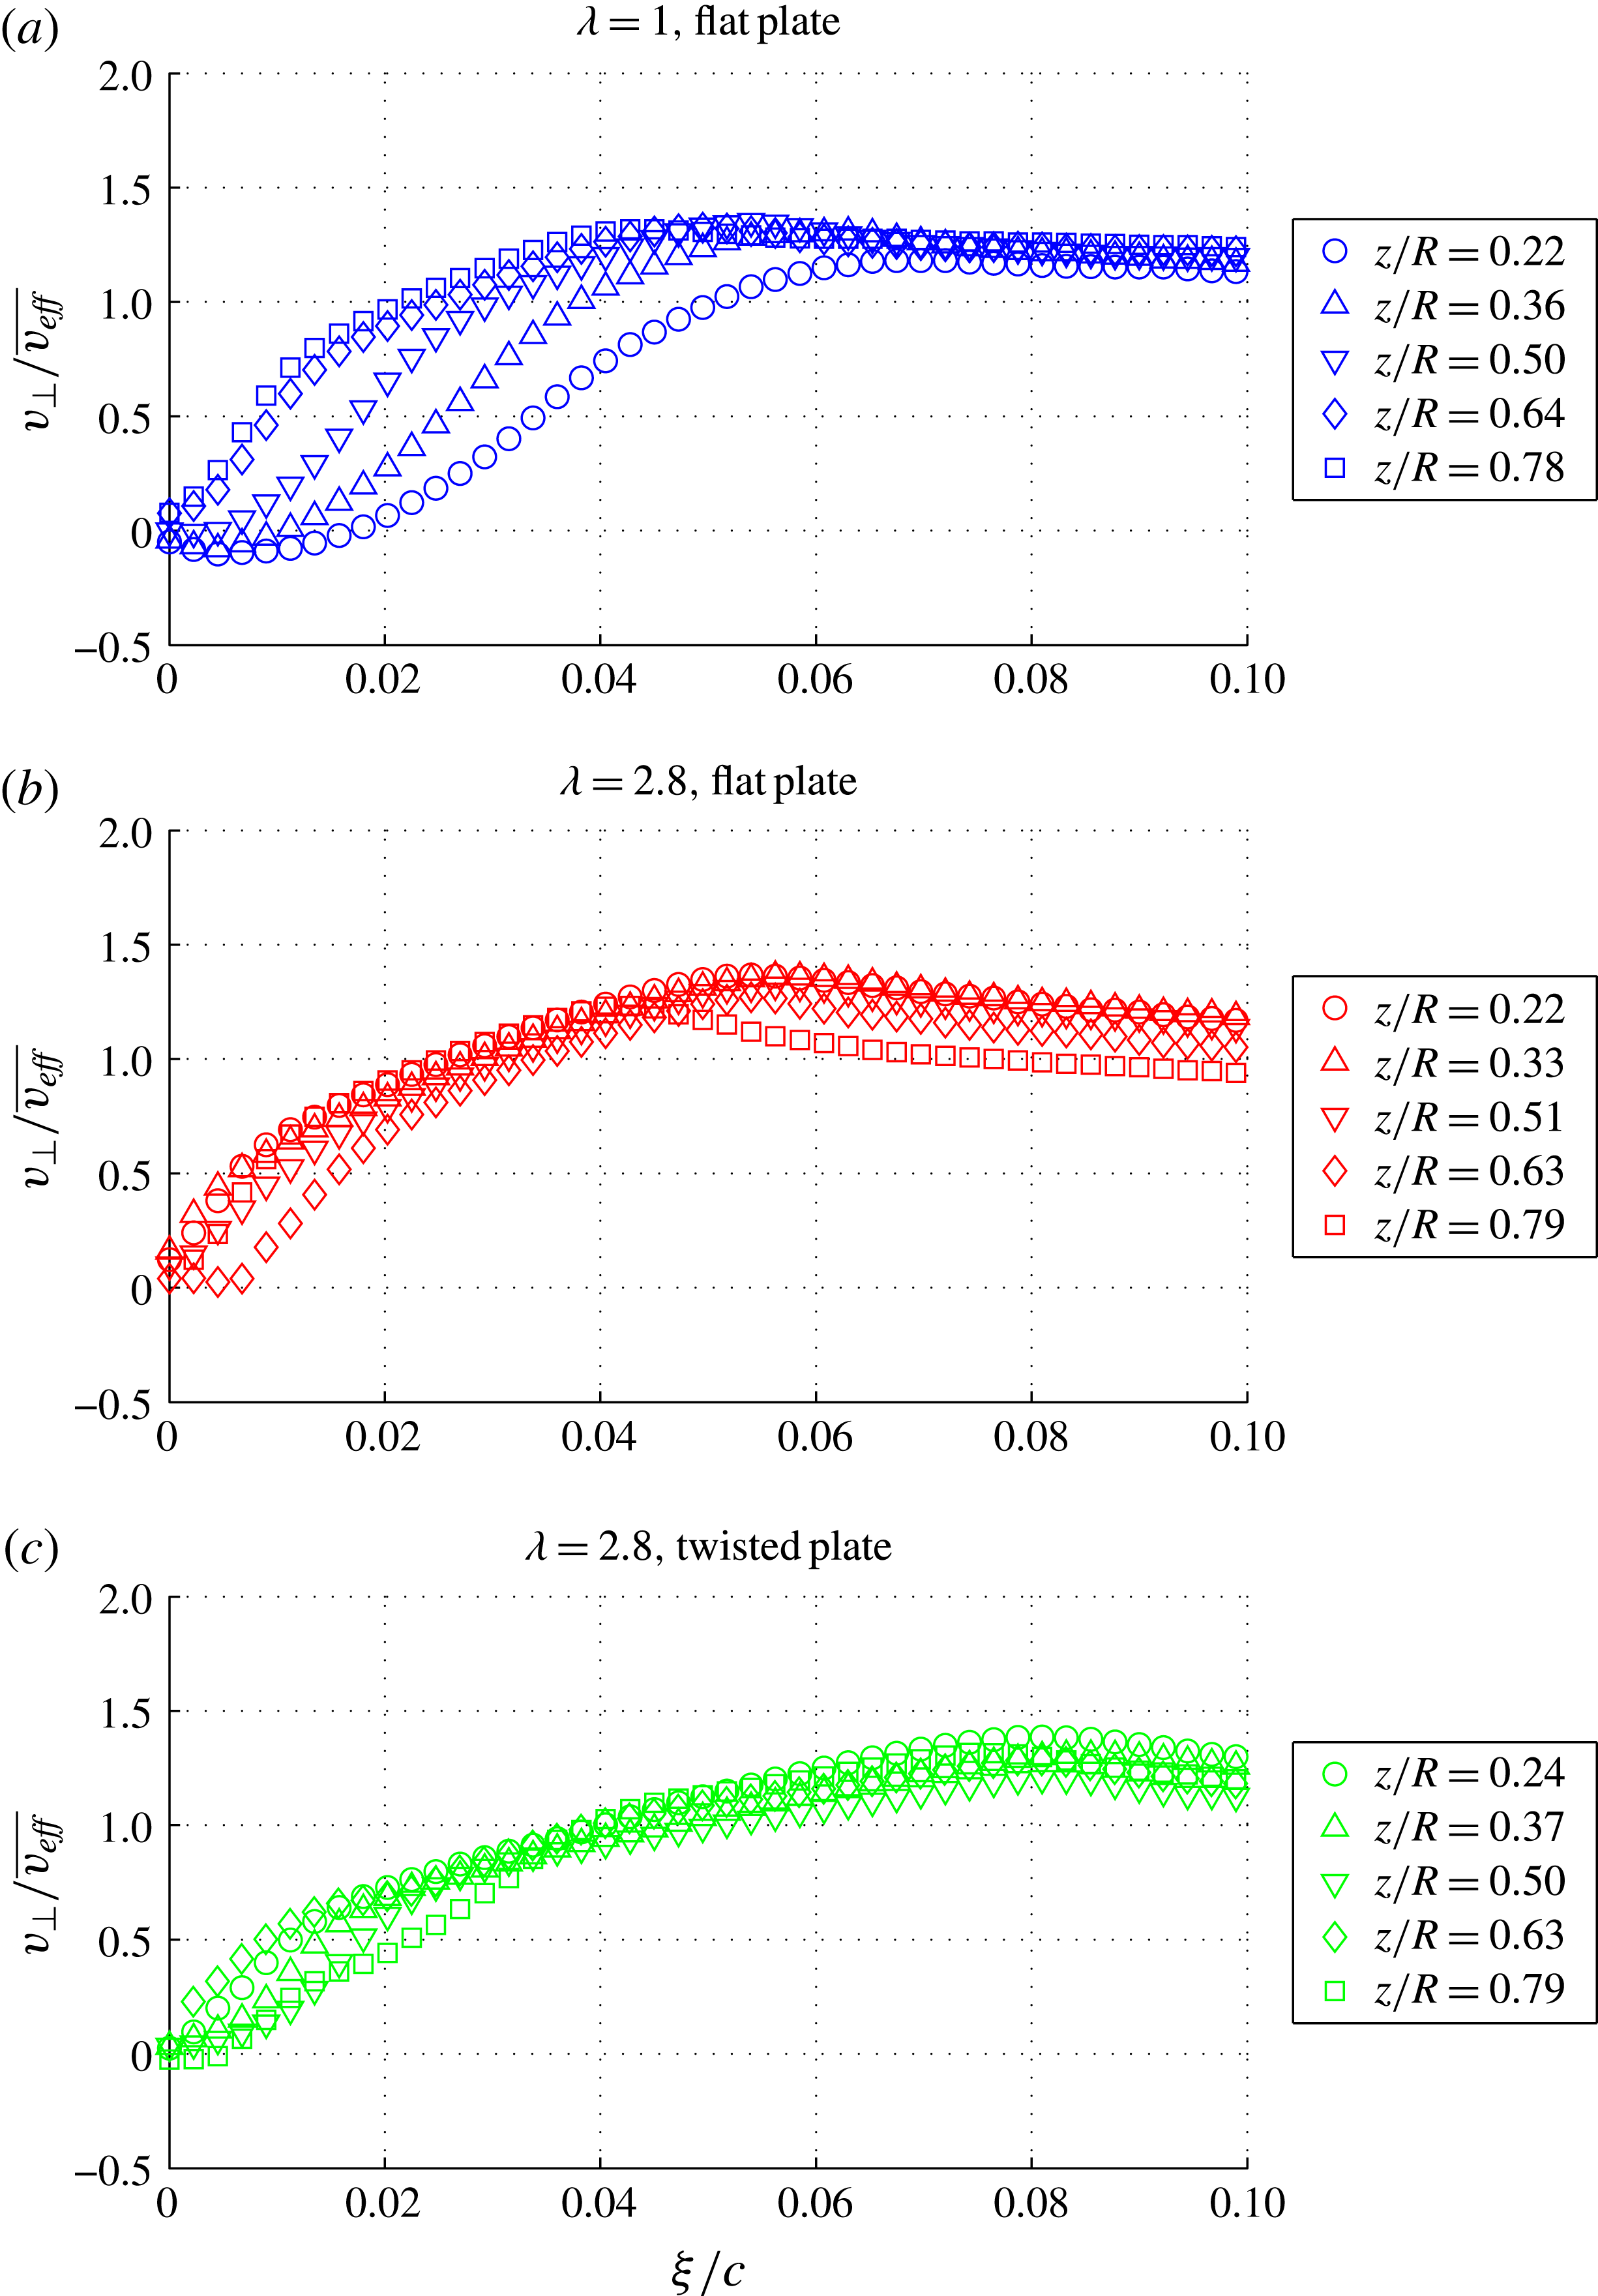
The shear-layer velocity profile at the leading edge of the plate was quantified using PIV with a small FOV. The velocity was sampled along a line extending from the suction side of the plate for each test case (along the
 ${\it\xi}$
coordinate), as shown in figure 11. One hundred correlations were averaged to produce the mean velocity profiles, which were then normalized by average effective velocity,
 $\overline{v_{eff}}$
, defined as
 $$\begin{eqnarray}\overline{v_{eff}}=\frac{1}{R}\int _{0}^{R}v_{eff}(z)\,\text{d}z.\end{eqnarray}$$
The resulting normalized velocity profiles are plotted in figure 12.
Chord-normal velocity is sampled along a horizontal line extending from the leading edge of the suction side of the plate. Vorticity flux through the shear layer,
 $J_{s}$
, is the integral across the shear layer of chord-normal velocity times spanwise vorticity (see (3.7)). Vorticity contours are shown in grey (blue online) to highlight the rotational fluid in the shear layer.

Normalized shear-layer velocity profiles,
 $v_{\bot }/\overline{v_{eff}}$
, for (a) the flat plate at
 ${\it\lambda}=1$
, (b) the flat plate at
 ${\it\lambda}=2.8$
and (c) the twisted plate at
 ${\it\lambda}=2.8$
. Velocity is sampled along a line collinear with the suction side of the plate on each test plane (see figure 11), as denoted by the coordinate
 ${\it\xi}$
. Normalized peak velocity is relatively flat along the span for each test case, and is equal to approximately 1.3 for all test cases. Shear-layer thickness is greatest for the twisted plate at
 ${\it\lambda}=2.8$
, leading to greater shear-layer vorticity flux.

A key challenge with PIV is resolving velocity vectors close to a body owing to reflections. In the current experiment, it is estimated that a saturated bright spot ahead of the leading edge extends, at worst, one-third of the plate thickness ahead of the leading edge. This means that the innermost six vectors (from
 ${\it\xi}/c=0$
to approximately
 ${\it\xi}/c=0.015$
) are suspect, although the value of velocity tends to zero as expected by the no-slip condition. The remainder of the velocity profile is unaffected by the reflections at the plate.
The maximum velocity in the shear layer,
 $v_{max}$
, is fairly constant along the span for all test cases. Furthermore, when normalized by
 $\overline{v_{eff}}$
, the maximum shear-layer velocity is constant for all test cases
 $(v_{max}/\overline{v_{eff}}\approx 1.3)$
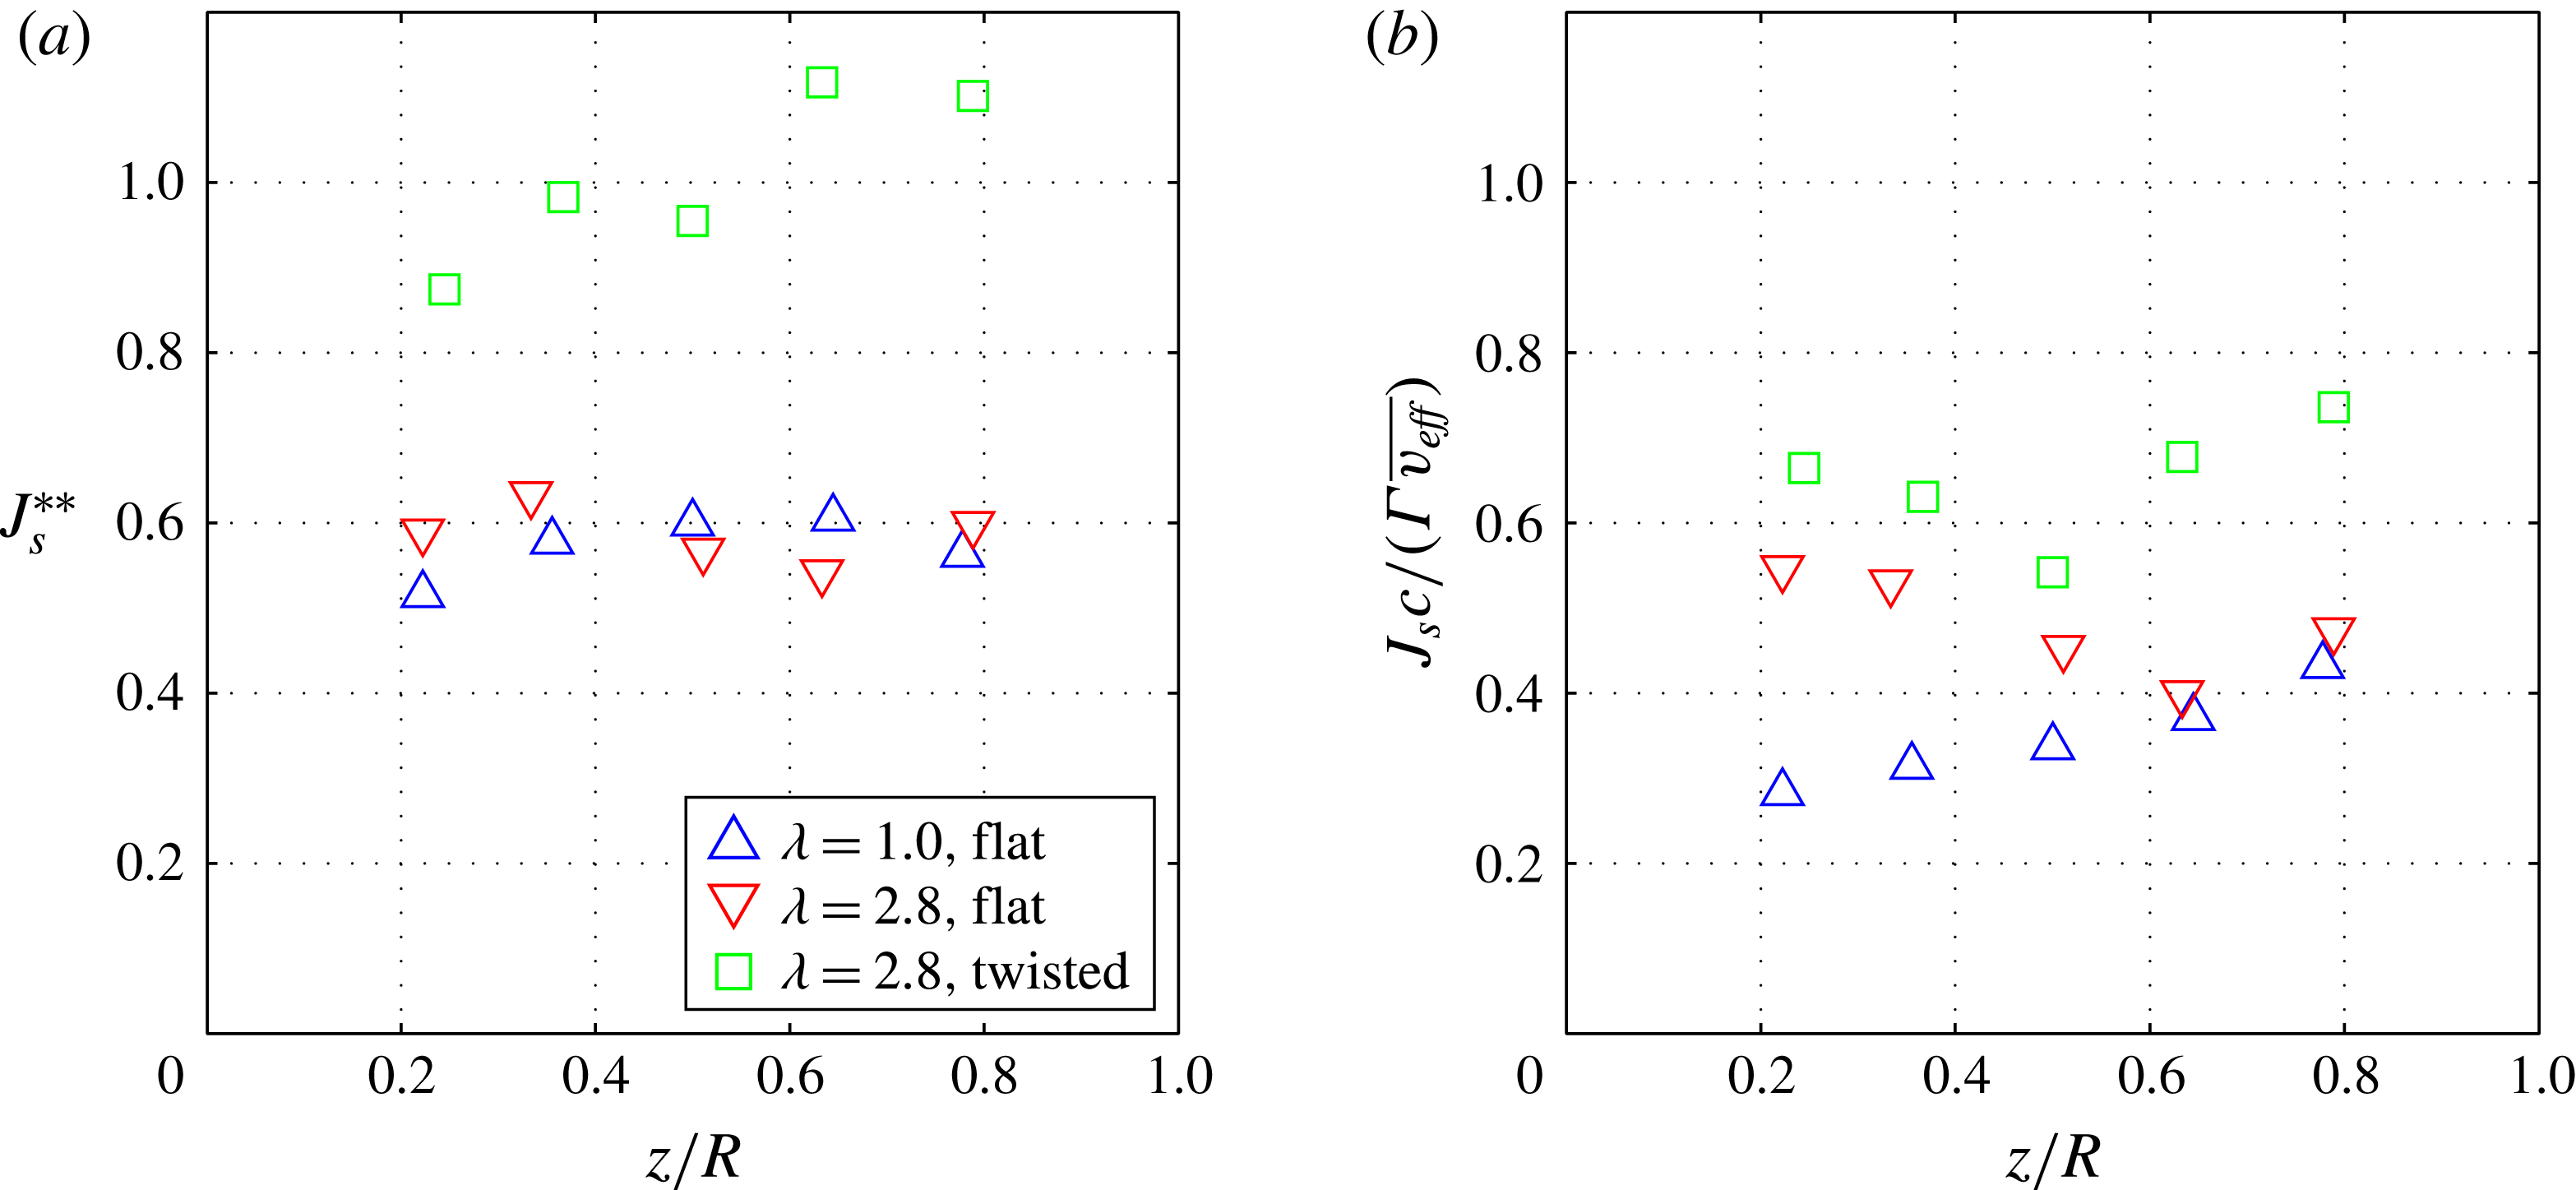
. The vorticity flux through the shear layer,
 $J_{s}$
, was also relatively insensitive to spanwise position;
 $J_{s}$
is calculated as
 $$\begin{eqnarray}J_{s}=\int _{SL}v_{\bot }{\it\omega}_{z}\,\text{d}{\it\xi},\end{eqnarray}$$
where
 $v_{\bot }$
is the chord-normal velocity ahead of the leading edge, and
 $SL$
denotes the shear layer. The integration is taken from the leading edge (
 ${\it\xi}=0$
) to a point beyond the shear layer where vorticity approaches zero. A similar approach has been previously used to successfully predict circulation growth for two-dimensional problems (Sattari et al.
Reference Sattari, Rival, Martinuzzi and Tropea2012; Wong et al.
Reference Wong, Kriegseis and Rival2013), and was used by Wojcik & Buchholz (Reference Wojcik and Buchholz2014) in quantifying the balance of circulation transport over a rotating flat plate. Normalized leading-edge vorticity flux,
 $J_{s}^{\ast \ast }$
, is defined as
 $$\begin{eqnarray}J_{s}^{\ast \ast }=\frac{J_{s}}{\overline{v_{eff}}^{2}}.\end{eqnarray}$$
The superscript
 $\text{}^{\ast \ast }$
has been used to denote normalization by a global parameter, which is constant for a given test case across the entire span. Previously, the superscript
 $\text{}^{\ast }$
was used to denote normalization by local, in-plane parameters, which vary with spanwise location. Conspicuously, normalized shear-layer flux collapses all along the span for the flat-plate test cases, which share neither a common tip speed ratio nor distribution of effective angle of attack. Unless the competing effects of tip speed ratio and angle of attack coincidentally cancel for the two flat-plate cases, it would appear that the twist profile of the plate is the governing parameter of shear-layer vorticity flux. It is thus implied that the shear-layer vorticity flux and the local circulation are not correlated with one another, as they are driven by different physical effects. This can be shown by defining a normalized ratio of shear-layer vorticity flux to circulation,
 $$\begin{eqnarray}\frac{J_{s}^{\ast \ast }}{{\it\Gamma}^{\ast \ast }}=\frac{J_{s}c}{{\it\Gamma}\overline{v_{eff}}}.\end{eqnarray}$$
This ratio is plotted versus spanwise position in figure 13(b). Although the ratio is similar on the inboard planes at a constant tip speed ratio of 2.8, no clear collapse of the data is observed.
(a) Normalized vorticity flux through the leading-edge shear layer,
 $J_{s}^{\ast \ast }$
, versus normalized spanwise position,
 $z/R$
. The twist profile appears to govern shear-layer vorticity flux, as the data for both flat-plate test cases collapse independently of tip speed ratio. (b) Normalized ratio of shear-layer flux to circulation, plotted versus
 $z/R$
. No obvious collapse is observed, showing that there is no clear correlation between shear-layer vorticity flux and steady-state circulation.

4. Discussion
4.1. Effects of tip speed ratio on vorticity transport and the resulting steady-state leading-edge circulation
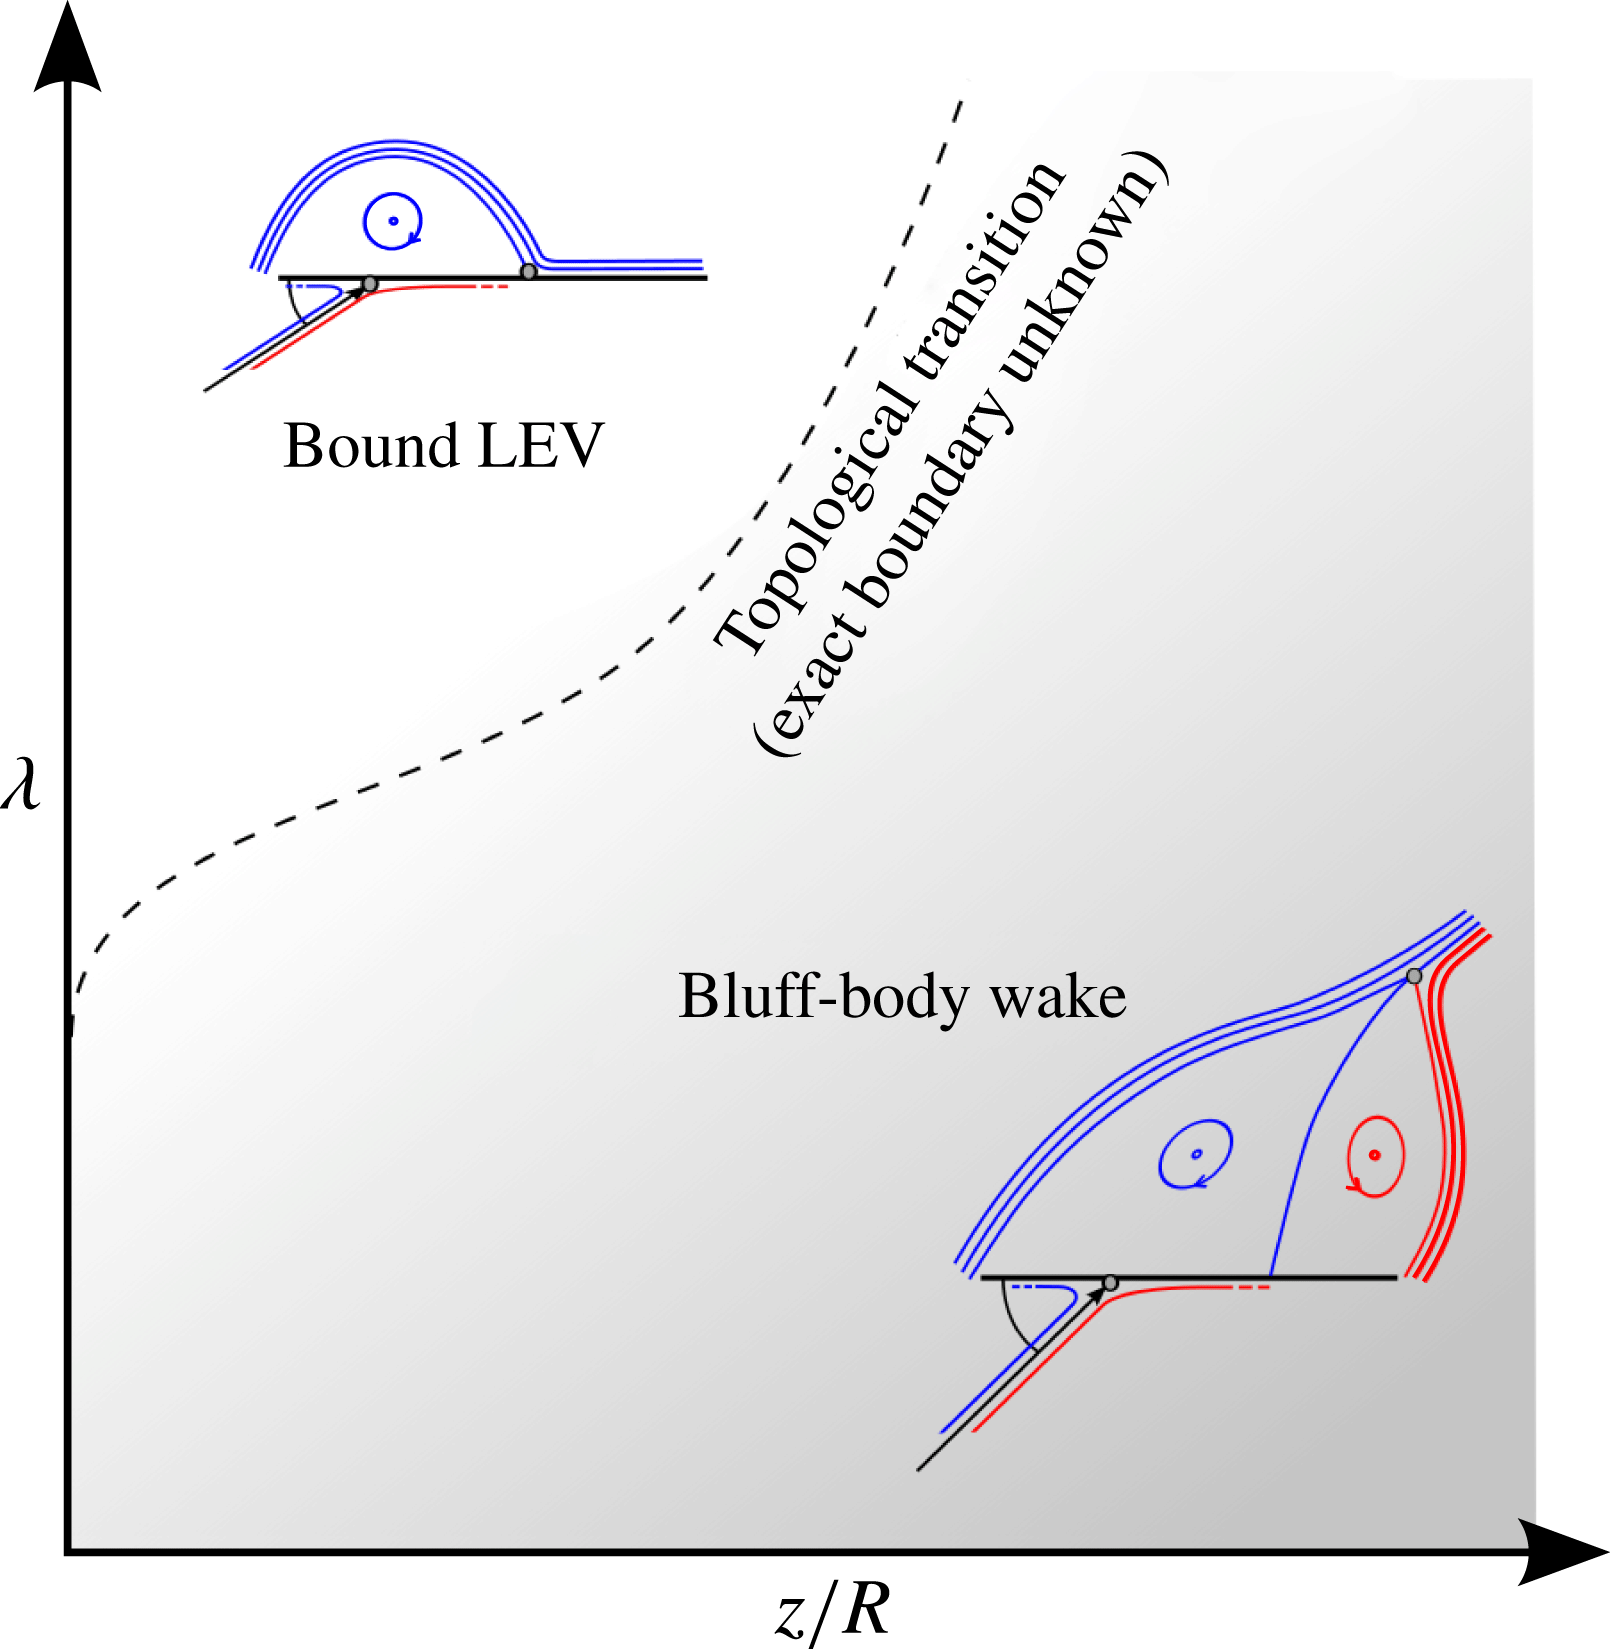
The observed independence of leading-edge circulation from tip speed ratio implies that the equilibrium is driven by the local inflow conditions of effective angle of attack and effective velocity, and modulated by spanwise position. In thin-aerofoil theory, with a trailing-edge Kutta condition imposed, circulation is similarly fixed by effective velocity and angle of attack; for a finite wing, the proximity of the tip vortex is a third degree of freedom. For a finite rotating plate undergoing separation, yet another degree of freedom exists: the fixed saddle point given by the Kutta condition is replaced by a full saddle somewhere in the wake, or a half-saddle somewhere on the suction side of the plate. Tip speed ratio was shown herein to be critical in determining the location of this saddle point (see figure 14); however, variation of this additional degree of freedom is not accompanied by changes in normalized leading-edge circulation. The net effect of increased tip speed ratio can thus be interpreted as increased vortex stretching, whereby the vorticity distribution around the leading edge is made more compact, but the total leading-edge circulation remains unchanged.
Topological transition in the two-dimensional parameter space of tip speed ratio,
 ${\it\lambda}$
, and normalized spanwise position,
 $z/R$
. A minimum tip speed ratio is necessary to generate the bound LEV topology, which is then observed only at spanwise positions sufficiently close to the centre of rotation. Effective angle of attack appears to have a lesser effect on the spanwise location of the topological transition than tip speed ratio.

An attempt was made to explain the trends of normalized leading-edge circulation in terms of the flux of vorticity through the leading-edge shear layer. This vorticity flux,
 $J_{s}$
(as defined in (3.7)), requires a sink of vorticity in order to maintain the steady flow field characteristic of stable LEVs. Since a minimum tip speed ratio is necessary to generate a stable LEV, we expect the various vorticity transport mechanisms to vary in magnitude with tip speed ratio. As tip speed ratio is increased from zero, spanwise flow is generated and spanwise vorticity convection grows. This mechanism is commonly cited as an important sink of vorticity (e.g. Ellington et al.
Reference Ellington, van den Berg, Willmott and Thomas1996; Wong et al.
Reference Wong, Kriegseis and Rival2013). Vorticity annihilation can also be expected to increase, as the vorticity distribution was shown to become more compact near the plate. Wojcik & Buchholz (Reference Wojcik and Buchholz2014) showed annihilation to be significant in the overall circulation balance in some cases. Tilting would probably increase, as the Coriolis acceleration acting on the spanwise flow in the recirculation zone would increase. Although Wojcik & Buchholz (Reference Wojcik and Buchholz2014) showed tilting to have no net effect on circulation transport in their experiment at locations up to the midspan, it is expected to play a role at locations approaching the tip, where any stable vortex system must begin to tilt into the helical wake.
In any case, we expect spanwise convection, vorticity annihilation and vortex tilting all to increase in magnitude as tip speed ratio increases. However, we cannot easily predict how their relative importance scales. If the relative magnitudes of all of these transport mechanisms were insensitive to tip speed ratio, then one might expect shear-layer vorticity flux to be consistently correlated with local circulation. However, figure 13(b) shows a normalized ratio of shear-layer vorticity flux to circulation, and no clear collapse of the data is observed for any of the three different test cases. Instead, changes in shear-layer vorticity flux do not affect leading-edge circulation at all if the angle-of-attack distribution remains constant. It appears that the transport mechanisms of spanwise convection, tilting and annihilation adjust to changes in shear-layer vorticity flux, conspiring to maintain the equilibrium circulation established by the spanwise position and the local irrotational inflow conditions.
Another approach to explaining the steady-state circulation may be warranted. Zannetti & Gourjii (Reference Zannetti and Gourjii2014) investigated the equilibrium positions of counter-rotating vortex pairs in the wake of an infinite flat plate, where the strength of the vortices and the total global circulation determine the flow topology of the wake. For any angle of attack, they showed that the total global circulation must be equal to zero to ensure that a local maximum of vorticity does not exist away from the plate in violation of the two-dimensional maximum principle for vorticity (Lugt Reference Lugt1985). For a steady three-dimensional problem, this constraint does not apply, as local maxima of vorticity are permitted in regions where diffusion is balanced by vortex stretching. However, the observations of the present study imply that some constraint on leading-edge circulation does exist, and could be similarly enforced by the allowable topologies of the irrotational flow around the recirculation region. Although not trivial, an extension of this type of wake analysis to three dimensions could provide insight into the problem.
4.2. Trends of topology and their relationship to LEV stability
It is expected that, for a sufficiently strong LEV near the centre of rotation, the half-saddle behind the LEV can exist ahead of the trailing edge. LEVs have previously been described as conical in shape (Ellington et al. Reference Ellington, van den Berg, Willmott and Thomas1996; Maxworthy Reference Maxworthy2007; Garmann et al. Reference Garmann, Visbal and Orkwis2013; Harbig et al. Reference Harbig, Sheridan and Thompson2013), such that the half-saddle would move towards the trailing edge with increasing spanwise position. This behaviour was not directly observed in the present study, as the half-saddle was already near the trailing edge at the most inboard span-normal planes. Outboard of the location where the half-saddle reaches the trailing edge, the saddle point moves into the flow field as a full saddle. In the present study, the wake is characterized by this full saddle on all planes outboard of the midspan for all test cases.
In previous studies of rotating plates in zero free-stream conditions, it was shown that an LEV is most likely to be observed at inboard locations, or areas with low local Rossby number (Lentink & Dickinson Reference Lentink and Dickinson2009); note that tip speed ratio tends to infinity in such studies. When the free-stream velocity is non-zero, tip speed ratio becomes a second governing parameter of stable LEV attachment. A non-zero tip speed ratio is necessary to generate a stable LEV, as stable LEV attachment does not occur for a stationary plate. We thus suggest that the bound LEV topology, and the strong LEVs that generate it, are possible at sufficiently high tip speed ratios at spanwise positions near to the centre of rotation (see figure 14).
5. Conclusions
Flow topology and leading-edge circulation over steadily rotating plates in a free-stream flow were studied using planar PIV. The effects of tip speed ratio and effective angle of attack were independently observed by comparing plates with different twist profiles. Circulation on span-normal planes is uniquely defined by spanwise position and local inflow conditions (local effective angle of attack and local effective velocity). Changes in tip speed ratio do not alter this equilibrium circulation when the inflow conditions are held constant. The shear-layer velocity profiles ahead of the leading edge were resolved using a sufficiently small field of view. This allowed shear-layer vorticity flux to be quantified, which was shown to be uncorrelated with the observed equilibrium values of circulation. This insensitivity of circulation to the leading-edge vorticity flux suggests that the remaining vorticity transport mechanisms (spanwise convection, tilting, annihilation) tend to adjust in magnitude to maintain the equilibrium circulation set by the irrotational inflow conditions.
Tip speed ratio is the key driver of the topology of the flow, where an increase in tip speed ratio stretches the leading-edge vorticity and drains the recirculation zone to make it more compact. At sufficiently high tip speed ratio, the flow that separates from the leading edge stagnates onto the suction side of the plate, encompassing a bound LEV. This topology is observed at inboard locations; at sufficiently outboard locations, the half-saddle on the plate is replaced by a full saddle in the wake, and separation at the trailing edge occurs. Tip speed ratio may serve as a good predictor of the spanwise location separating these distinct topologies, while local effective angle of attack, local effective velocity and spanwise position may be used to independently predict leading-edge circulation.
Acknowledgement
The authors wish to thank Alberta Innovates Technology Futures (AITF) for their financial backing.
Supplementary movies
Supplementary movies are available at http://dx.doi.org/10.1017/jfm.2015.279.