


1. Introduction
In Late Triassic times the supercontinent Pangaea stretched from pole to pole, surrounded by Panthalassa and partly dissected by the Tethys Ocean (Fig. 1). A strong monsoonal atmospheric circulation is believed to have induced three non-zonal (non-latitudinal) climate regions with: (1) arid/semi-arid conditions in central Pangaea and along the western margin of the Tethys, (2) alternating wet and dry seasonal conditions along the eastern coasts of Laurasia and Gondwana as well as the western coasts of Pangaea, and (3) wet and warm conditions in the high latitudes (Preto, Kustatscher & Wignall, Reference Preto, Kustatscher and Wignall2010). Towards the end of the Triassic Period, in late Rhaetian time, Triassic life suffered one of the five most severe crises during the Phanerozoic Eon (Sepkoski, Reference Sepkoski and Walliser1996). These mass extinction events are characterized by global extinction rates and magnitudes greatly exceeding background levels. The end-Triassic mass extinction, or ETE, is particularly marked by such losses of marine organisms (Sepkoski, Reference Sepkoski and Walliser1996). At the base of the marine food web, extinction of phyto- and zooplankton may have resulted in strongly reduced or highly altered primary production (Ward et al. Reference Ward, Haggart, Carter, Wilbur, Tipper and Evans2001). Dinoflagellates and coccolithophorids that had undergone rapid radiation during Late Triassic time experienced high extinction rates. Benthic organisms such as scleractinian corals, megalodont bivalves and calcareous algae were especially hard hit (Kiessling et al. Reference Kiessling, Aberhan, Brenneis and Wagner2007). Ammonites, nektonic predators, also suffered high diversity losses and survivors were possibly energy-saving passive floaters (Whiteside & Ward, Reference Whiteside and Ward2011). The end-Triassic event is temporally linked to extensive flood basalt volcanism with the formation of the large igneous province the Central Atlantic Magmatic Province (CAMP) (Schoene et al. Reference Schoene, Guex, Bartolini, Schaltegger and Blackburn2010), and degassing from this volcanism is generally believed to have played a major part in the extinction scenario.
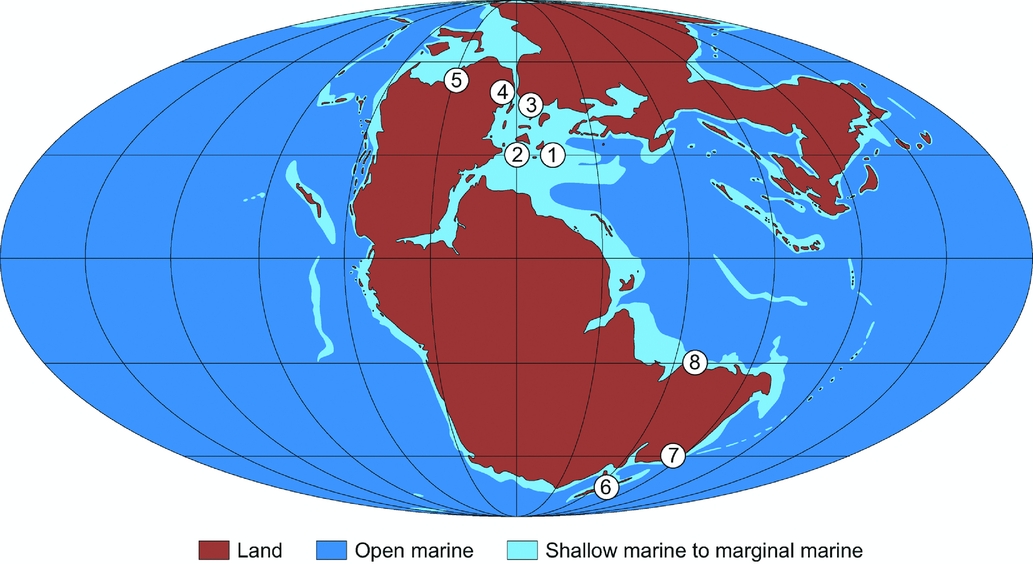
Palaeomap of Pangaea (after R. Blakey, 2014, http://cpgeosystems.com/paleomaps.html) showing the palaeogeographical location of localities discussed in the text: 1 – Kuhjoch, Austria; 2 – St Audrie's Bay, UK; 3 – Stenlille, Denmark; 4 – Astartekløft, Greenland; 5 – Sverdrup Basin, Arctic Canada; 6 – Northern Carnarvon Basin, Western Australia; 7 – Southeast Queensland, eastern Australia; 8 – New Zealand.
Much emphasis has been put on the marine record during this biotic crisis, and the terrestrial environment is generally considered to have been equally affected (McElwain & Punyasena, Reference McElwain and Punyasena2007). Some authors suggest that there is no distinctive floral mass extinction during the end-Triassic event, but rather that the terrestrial plant record only suffered disturbances, globally, rather than catastrophic losses (Bonis & Kürschner, Reference Bonis and Kürschner2012; Bond & Wignall, Reference Bond, Wignall, Keller and Kerr2014). However, major palaeobotanical studies across the Triassic–Jurassic boundary (TJB) are lacking from most areas. The only macroplant record across the TJB that has been studied in detail and in higher resolution is that from Greenland (Harris, Reference Harris1937; McElwain et al. Reference McElwain, Popa, Hesselbo, Haworth and Surlyk2007). The Greenland macroplant record is considered autochthonous, and to reflect the vegetation locally, with very little input of regional floral elements. The well-preserved macroplant fossil assemblages from Greenland have provided a detailed insight into the terrestrial environment and the changes that occurred across the TJB in this particular area, and show an exceptionally high species turnover of >80%, while the extinction at genus level was considerably more moderate, ~17% (McElwain et al. Reference McElwain, Popa, Hesselbo, Haworth and Surlyk2007). On a global scale, possibly only one plant family became extinct, namely the Peltaspermaceae (McElwain & Punyasena, Reference McElwain and Punyasena2007).
However, taxonomic loss is not the only important factor when assessing the severity of a biotic crisis. Ecological factors, expressed as (1) magnitude of ecological disruption, and (2) ranking of ecological impact, have provided additional information on the severity of a biotic crisis (Droser et al. Reference Droser, Bottjer, Sheehan and McGhee2000; McGhee et al. Reference McGhee, Sheehan, Bottjer and Droser2004, Reference McGhee, Clapham, Sheehan, Bottjer and Droser2013). McGhee et al. (Reference McGhee, Sheehan, Bottjer and Droser2004) placed the terrestrial biotic crisis at the end-Triassic event in either their severity Category I: existent ecosystems collapse and are replaced by new post-extinction ecosystems, or IIa: disruption produces permanent loss of major ecosystem components (McGhee et al. Reference McGhee, Sheehan, Bottjer and Droser2004). However, they do state that the impact of the end-Triassic crisis on terrestrial biota is problematic in terms of ecological characterization (McGhee et al. Reference McGhee, Sheehan, Bottjer and Droser2004).
This review will focus solely on taxonomic and ecological changes in terrestrial palynology across the TJB. The terrestrial palynology of a number of well-documented TJB successions that provide quantitative or at least semi-quantitative palynological data are reviewed and compared. This is by no means a complete review of all published records so far, but the aim is to investigate palynofloral patterns that can provide an insight into if and how the terrestrial vegetation was affected on a global scale during the ETE.
2. Parent plant affinities and environmental and climatic preferences
In order to interpret the palynological record it is necessary to refer the dispersed fossil spores and pollen to parent plant taxa. Table 1 lists the known or probable plant affinities of common Rhaetian–Hettangian spore and pollen taxa. For many of these taxa the probable affinity is merely based on their general morphology and similarity to extant taxa. Others are known from in situ occurrences in macroplant fossils, and this provides us with more information on their habit and preferred environment. A few taxa remain of unknown affinity. Authors working on Triassic palynofloras often divide spores and pollen into hygrophytic (i.e. wet-loving) or xerophytic (i.e. drought tolerant), based primarily on the works of Visscher & van der Zwan (Reference Visscher and van der Zwan1981), Brugman, van Bergen & Kerp (Reference Brugman, van Bergen, Kerp and Traverse1993) and Visscher et al. (Reference Visscher, van Houte, Brugman and Poort1994). Several published papers have supplied more detailed information on possible ecological preferences of Jurassic fossil plants, which can be used to interpret the palynological record (e.g. Abbink, Reference Abbink1998; van Konijnenburg-van Cittert, Reference van Konijnenburg-van Cittert2002, Reference van Konijnenburg-van Cittert2008). Some authors have used the link between sedimentology and palynology, or multivariate statistical analyses to interpret environmental and climatic preferences (e.g. Hubbard & Boulter, Reference Hubbard and Boulter1997; Bonis & Kürschner, Reference Bonis and Kürschner2012). In some cases such studies can indicate differences in ecological or climatological preference of morphologically similar and probably closely related taxa.
List of selected Triassic–Jurassic spore-pollen taxa and their probable parent plant affinities, and possible ecological and climatological preferences

3. Review of selected palynological TJB successions
The terrestrial palynological changes across the TJB interval from a selected number of sites are reviewed below. The major changes in spore-pollen taxa abundances at each locality are displayed in Figures 2, 3, 5–8, 11, where two reviewed sites at a time are compared. Five of the reviewed TJB successions are located in the northern hemisphere, while only three from the southern hemisphere have been found to contain sufficient palynological data to assess. The sites are put into a stratigraphical framework, where, if possible, independent dates obtained via invertebrate marine fossils or marine dinoflagellate cysts are used as markers. The base of the Jurassic is defined by the first occurrence of the ammonite Psiloceras spelae (Hillebrandt et al. Reference Hillebrandt, Krystyn, Kürschner, Bonis, Ruhl, Richoz, Schobben, Urlichs, Bown, Kment, McRoberts, Simms and Tomãsových2013). In addition to this traditional marine marker, the base of the Jurassic is also defined by an accessory marker, the pollen Cerebropollenites thiergartii, which at the GSSP (Global Stratotype Sections and Point) at Kuhjoch in Austria appears for the first time c. 3 m below the first occurrence of P. spelae.
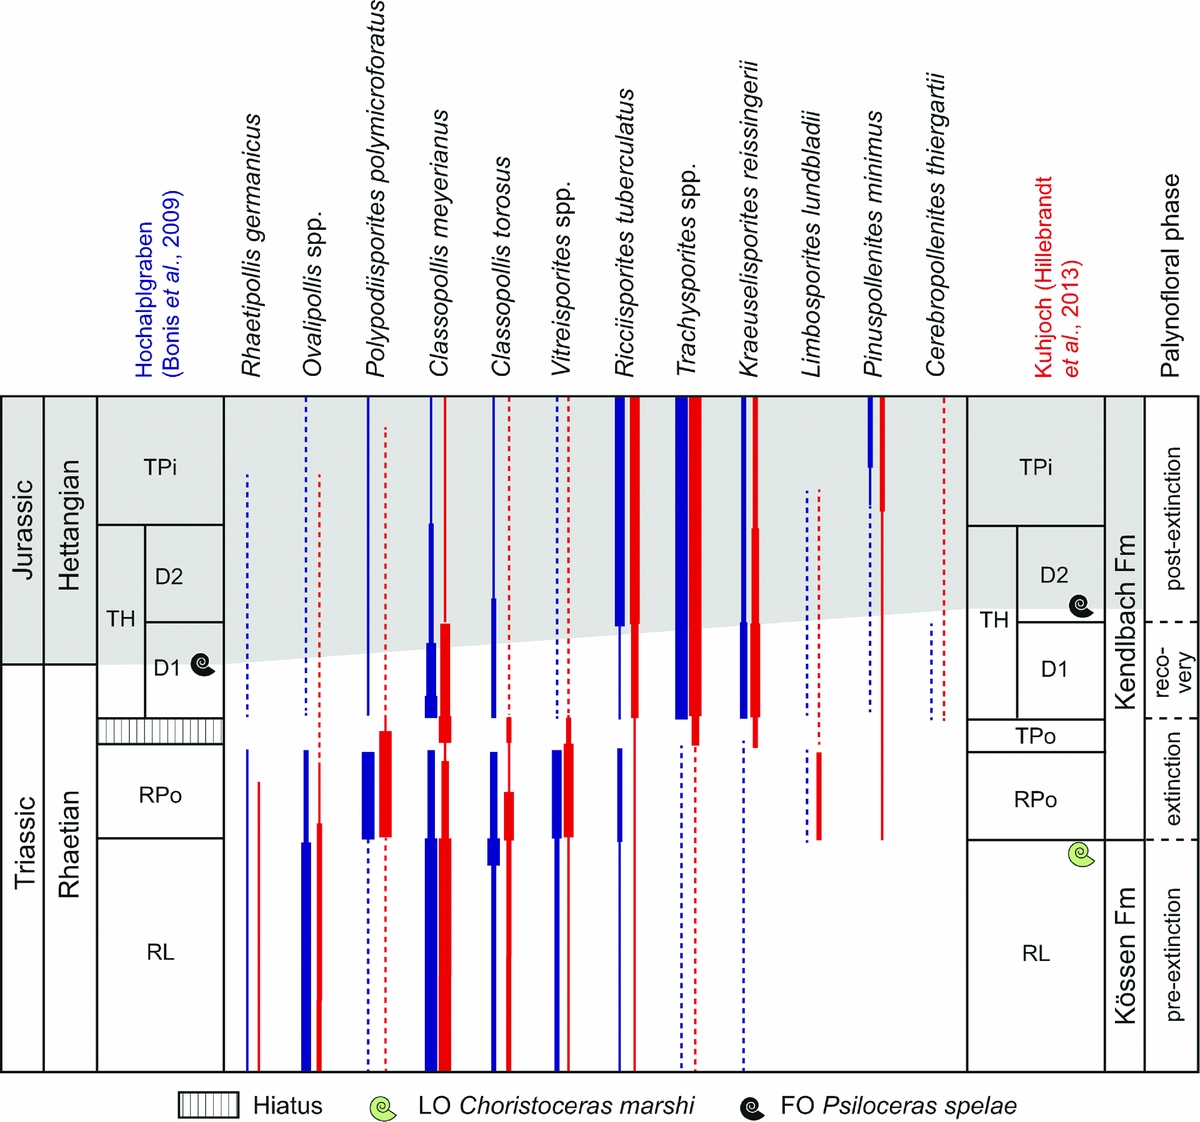
Selected palynological changes across the TJB at the GSSP locality Kuhjoch and Hochalplgraben in Austria (after Bonis et al. Reference Bonis, Kürschner and Krystyn2009; Hillebrandt et al. Reference Hillebrandt, Krystyn, Kürschner, Bonis, Ruhl, Richoz, Schobben, Urlichs, Bown, Kment, McRoberts, Simms and Tomãsových2013). Grey-shaded area marks the Jurassic.
Selected palynological changes across the TJB at St Audrie's Bay, UK (after Bonis et al. Reference Bonis, Ruhl and Kürschner2010) in comparison with the GSSP at Kuhjoch, Austria (after Bonis et al. Reference Bonis, Kürschner and Krystyn2009; Hillebrandt et al. Reference Hillebrandt, Krystyn, Kürschner, Bonis, Ruhl, Richoz, Schobben, Urlichs, Bown, Kment, McRoberts, Simms and Tomãsových2013). Grey-shaded area marks the Jurassic. C. Mb. – Cotham Member; L. Mb. – Langport Member.

In order to assess the ecological impact at each site, the spores and pollen at each site were placed in groups according to their known or probable parent plant affinity (following information in Table 1). From previous palynological work on the end-Permian and the Cretaceous–Palaeogene mass extinction events (e.g. Sweet & Braman, Reference Sweet and Braman1992; Looy et al. Reference Looy, Brugman, Dilcher and Visscher1999; Vajda, Raine & Hollis, Reference Vajda, Raine and Hollis2001; Lindström & McLoughlin, Reference Lindström and McLoughlin2007; Hermann et al. Reference Hermann, Hochuli, Bucher and Roohi2012) it is clear that palynofloral successions across such biotic crises can be divided into pre-extinction, extinction, recovery and post-extinction palynofloral phases. Pre-extinction and post-extinction palynofloras represent the stable pre- and post-vegetation, respectively. Extinction palynofloras are characterized by increased taxonomic losses and compositional changes. Recovery palynofloras may be characterized by rapidly changing assemblages, constituting not only surviving, but also lingering and new incoming taxa. This subdivision is applied to the palynological successions at the herein reviewed sites in order to assess taxonomic and ecological changes over the investigated time interval.
3.a. The GSSP locality Kuhjoch, and Hochalplgraben, Austria
At the TJB the Eiberg Basin, today located in the Northern Calcareous Alps, was an intraplatform on the northern margin of the Tethys (Hillebrandt et al. Reference Hillebrandt, Krystyn, Kürschner, Bonis, Ruhl, Richoz, Schobben, Urlichs, Bown, Kment, McRoberts, Simms and Tomãsových2013). The GSSP locality consists of two sections, Kuhjoch West and East (Hillebrandt et al. Reference Hillebrandt, Krystyn, Kürschner, Bonis, Ruhl, Richoz, Schobben, Urlichs, Bown, Kment, McRoberts, Simms and Tomãsových2013). The palynology of the TJB successions at Kuhjoch West and another section at Hochalplgraben were presented in Bonis, Kürschner & Krystyn (Reference Bonis, Kürschner and Krystyn2009). In addition, Hillebrandt et al. (Reference Hillebrandt, Krystyn, Kürschner, Bonis, Ruhl, Richoz, Schobben, Urlichs, Bown, Kment, McRoberts, Simms and Tomãsových2013) published an update of the Kuhjoch West succession, complemented with data from Kuhjoch East. The palynofloral changes over the extinction interval at Kuhjoch are reviewed below (Fig. 2), and the palynofloral changes are summarized in Table 2.
List of ecosystem changes, expressed as palynologically inferred parent plant group dominance across the TJB in the successions reviewed herein, as well as the taxonomic and ecological severity assessment of each site

The ecological severity is estimated using category assessments of McGhee et al. (Reference McGhee, Sheehan, Bottjer and Droser2004)
3.a.1. Pre-extinction palynoflora (Rhaetian)
In the Eiberg Member (Kössen Formation) pre-extinction palynofloras are dominated by xerophytic conifer pollen: the cheirolepid pollen Classopollis and Ovalipollis of unknown coniferalean affinity (Bonis, Kürschner & Krystyn, Reference Bonis, Kürschner and Krystyn2009; Hillebrandt et al. Reference Hillebrandt, Krystyn, Kürschner, Bonis, Ruhl, Richoz, Schobben, Urlichs, Bown, Kment, McRoberts, Simms and Tomãsových2013) (Fig. 2). These assemblages were assigned to the Rhaetipollis–Limbosporites (RL) Zone by Kürschner, Bonis & Krystyn (Reference Kürschner, Bonis and Krystyn2007) and correlated with the Rhaetipollis–Limbosporites Zone of Lund (Reference Lund1977) (Fig. 2).
3.a.2. Extinction palynoflora (Rhaetian)
The first marine extinction pulse, where conodonts, Triassic ostracods and the Triassic ammonoid Choristoceras marshi occur for the last time, is located in the topmost bed of the Eiberg Member, ‘the T-bed’ (sensu Hillebrandt), a c. 1 cm thick black millimetre-laminated clay layer, interpreted as an anoxic event and a first marine regression (Hillebrandt et al. Reference Hillebrandt, Krystyn, Kürschner, Bonis, Ruhl, Richoz, Schobben, Urlichs, Bown, Kment, McRoberts, Simms and Tomãsových2013). The succeeding Schattwald beds (lower Kendlbach Formation) represent the peak of the marine extinction (Hillebrandt & Krystyn, Reference Hillebrandt and Krystyn2009; Hillebrandt et al. Reference Hillebrandt, Krystyn, Kürschner, Bonis, Ruhl, Richoz, Schobben, Urlichs, Bown, Kment, McRoberts, Simms and Tomãsových2013). The extinction palynofloras of this interval differ substantially from pre-extinction ones (Fig. 2; Table 2), and were assigned to the Rhaetipollis–Porcellispora (RPo) Zone (Kürschner, Bonis & Krystyn, Reference Kürschner, Bonis and Krystyn2007; Bonis, Kürschner & Krystyn, Reference Bonis, Kürschner and Krystyn2009; Hillebrandt et al. Reference Hillebrandt, Krystyn, Kürschner, Bonis, Ruhl, Richoz, Schobben, Urlichs, Bown, Kment, McRoberts, Simms and Tomãsových2013). Initially Classopollis pollen was abundant together with the caytonialean pollen Vitreisporites bjuvensis and fern spores Deltoidospora and Polypodiisporites polymicroforatus. Within the middle and upper part of the Schattwald beds cheirolepidacean conifer pollen almost disappeared completely, while the probable schizaeacean fern spore P. polymicroforatus continued to increase in abundance (Hillebrandt et al. Reference Hillebrandt, Krystyn, Kürschner, Bonis, Ruhl, Richoz, Schobben, Urlichs, Bown, Kment, McRoberts, Simms and Tomãsových2013) (Fig. 2). At Kuhjoch East, assemblages assigned to the Trachysporites–Porcellispora (TPo) Zone (Kürschner, Bonis & Krystyn, Reference Kürschner, Bonis and Krystyn2007) show an initial continued dominance of P. polymicroforatus and Deltoidospora, together with common caytonialean Vitreisporites pollen, but with a gradual increase in Classopollis, and a temporary dominance of fern spores assigned to Conbaculatisporites in the upper part of the zone (Fig. 2). The RPo and TPo zones were both correlated with the Ricciisporites–Polypodiisporites Zone of Lund (Reference Lund1977) (Bonis, Kürschner & Krystyn, Reference Bonis, Kürschner and Krystyn2009).
3.a.3. Recovery palynoflora (latest Rhaetian)
At Kuhjoch East the succeeding D1 Subzone of the Trachysporites–Heliosporites (TH) Zone is dominated by Classopollis meyerianus, fern spores assigned to Trachysporites fuscus and lycopod spores Kraeuselisporites reissingerii (Heliosporites reissingerii) (Fig. 2). Deltoidospora is also common, but P. polymicroforatus is absent. At Kuhjoch West, the composition of the D1 Subzone palynoflora is similar; however, Classopollis meyerianus is less abundant and Ricciisporites tuberculatus is a common constituent. At Kuhjoch West, the accessory marker for the base of the Jurassic, Cerebropollenites thiergartii, occurs from the base of the D1 Subzone (Hillebrandt et al. Reference Hillebrandt, Krystyn, Kürschner, Bonis, Ruhl, Richoz, Schobben, Urlichs, Bown, Kment, McRoberts, Simms and Tomãsových2013). The palynoflora of the D1 Subzone is here regarded as representing the recovery phase.
3.a.4. Post-extinction palynoflora (Hettangian)
The D2 Subzone differs from the previous one only in that the abundance of C. meyerianus has declined further (Hillebrandt et al. Reference Hillebrandt, Krystyn, Kürschner, Bonis, Ruhl, Richoz, Schobben, Urlichs, Bown, Kment, McRoberts, Simms and Tomãsových2013). Ricciisporites continues to be common to abundant and even increases in abundance upwards within the following Trachysporites–Pinuspollenites (TPi) Zone. The TPi Zone is marked by an incoming of the bisaccate pinacean conifer pollen Pinuspollenites minimus. Trachysporites remains the most abundant constituent, while Kraeuselisporites reissingerii (Heliosporites reissingerii) has decreased markedly (Fig. 2). At Hochalplgraben the palynofloral succession is similar (Bonis, Kürschner & Krystyn, Reference Bonis, Kürschner and Krystyn2009), but as in the Kuhjoch West section, the TPo Zone is missing owing to an unconformity (Fig. 2). At Kuhjoch the base of the Jurassic, i.e. the first occurrence of the ammonite Psiloceras spelae, is in the lower part of the D2 Subzone. However, at Hochalplgraben the first occurrence of Psiloceras spelae actually occurs lower, within the D1 Subzone of the TH Zone (Bonis, Kürschner & Krystyn, Reference Bonis, Kürschner and Krystyn2009; Hillebrandt et al. Reference Hillebrandt, Krystyn, Kürschner, Bonis, Ruhl, Richoz, Schobben, Urlichs, Bown, Kment, McRoberts, Simms and Tomãsových2013) (Fig. 2). The implications of this were not discussed in Hillebrandt et al. (Reference Hillebrandt, Krystyn, Kürschner, Bonis, Ruhl, Richoz, Schobben, Urlichs, Bown, Kment, McRoberts, Simms and Tomãsových2013).
Hillebrandt et al. (Reference Hillebrandt, Krystyn, Kürschner, Bonis, Ruhl, Richoz, Schobben, Urlichs, Bown, Kment, McRoberts, Simms and Tomãsových2013) did not discuss the palynofloral turnover at Kuhjoch, but from their figures it is indicated that at least 12 out of 46 taxa at Kuhjoch West, i.e. 26%, may have disappeared over the TJB interval.
3.b. St Audrie's Bay, UK
As one of the final candidates proposed as a GSSP for the base of the Jurassic (Warrington, Cope & Ivimey-Cook, Reference Warrington, Cope and Ivimey-Cook1994), several studies have focused on, or included, the palynology of the upper Blue Anchor, Westbury, Lilstock and Blue Lias formations at St Audrie's Bay, including Orbell (Reference Orbell1973), Warrington, Cope & Ivimey-Cook (Reference Warrington, Cope and Ivimey-Cook1994), Hounslow, Posen & Warrington (Reference Hounslow, Posen and Warrington2004), van de Schootbrugge et al. (Reference van de Schootbrugge, Tremolada, Rosenthal, Bailey, Feist-Burkhardt, Brinkhuis, Pross, Kent and Falkowski2007) and most recently Bonis, Ruhl & Kürschner (Reference Bonis, Ruhl and Kürschner2010). In the latter study the terrestrial palynoassemblages were divided into four informal zones, SAB1 to SAB4, briefly reviewed below (Fig. 3). The palynofloral changes over the extinction interval at St Audrie's Bay are summarized in Table 2.
3.b.1. Pre-extinction palynoflora (Rhaetian)
Pre-extinction assemblages from the upper Blue Anchor Formation and the Westbury Formation are characterized by high abundances of Classopollis, Ricciisporites tuberculatus and Ovalipollis and assigned to the SAB1 Zone (Bonis, Ruhl & Kürschner, Reference Bonis, Ruhl and Kürschner2010). Rhaetipollis germanicus is common in the lower part of the zone, and Ovalipollis occurs in much lower numbers in its upper part (Fig. 3).
3.b.2. Extinction palynoflora (Rhaetian)
Assemblages from the base of the Cotham Member (Lilstock Formation) to just below the initial negative C-isotope excursion of Hesselbo et al. (Reference Hesselbo, Robinson, Surlyk and Piasecki2002) were assigned to the SAB2 Zone (Bonis, Ruhl & Kürschner, Reference Bonis, Ruhl and Kürschner2010). In this zone the caytonialean pollen Vitreisporites bjuvensis and V. pallidus increase in abundance, while there is also an increase in spore abundance, in particular Polypodiisporites polymicroforatus, Deltoidospora spp. and the osmundaceous fern spores Baculatisporites and Punctatisporites (Fig. 3). Classopollis torosus, as well as Ovalipollis, R. tuberculatus, V. bjuvensis and R. germanicus all decrease markedly in the uppermost part of the zone (Bonis, Ruhl & Kürschner, Reference Bonis, Ruhl and Kürschner2010) (Fig. 3). The SAB2 Zone is herein considered to represent the extinction flora; however, it is important to note that the two uppermost samples from the SAB2 Zone were collected above the unconformity (Bonis, Ruhl & Kürschner, Reference Bonis, Ruhl and Kürschner2010), and that, owing to this, a part of the zone may be missing.
3.b.3. Recovery palynoflora (latest Rhaetian)
The succeeding SAB3 Zone, herein considered to represent the recovery flora, encompasses the uppermost Cotham Member and the entire Langport Member of the Lilstock Formation (Bonis, Ruhl & Kürschner, Reference Bonis, Ruhl and Kürschner2010). This zone should possibly be subdivided into two subzones, as the lower part of SAB3 is completely dominated by C. meyerianus, while the upper part of the zone contains abundant to dominant amounts of spores, primarily Kraeuselisporites reissingerii, Deltoidospora spp. and Acanthotriletes varius. Cheirolepid pollen assigned to C. torosus dominate one sample.
3.b.4. Post-extinction palynoflora (Hettangian)
Psiloceras spelae has so far not been encountered in the TJ-succession from the UK. The oldest psiloceratid ammonite from the UK is Psiloceras erugatum (bed 8, Doniford Bay) closely followed by Psiloceras planorbis (bed 13, St Audrie's Bay) (Bloos & Page, Reference Bloos and Page2000; Hillebrandt et al. Reference Hillebrandt, Krystyn, Kürschner, Bonis, Ruhl, Richoz, Schobben, Urlichs, Bown, Kment, McRoberts, Simms and Tomãsových2013) (Fig. 3). Based on the succession of ammonites, Hillebrandt et al. (Reference Hillebrandt, Krystyn, Kürschner, Bonis, Ruhl, Richoz, Schobben, Urlichs, Bown, Kment, McRoberts, Simms and Tomãsových2013) suggested that the TJB should be placed within the lowest few metres of the Blue Lias Formation. This formation was assigned to palynological SAB4 Zone by Bonis, Ruhl & Kürschner (Reference Bonis, Ruhl and Kürschner2010); hence, the TJB is placed within the lowermost part of this zone (Fig. 3). However, the shift in the palynofloras from SAB3 to SAB4 is very abrupt with a dramatic increase in the cheirolepid pollen C. meyerianus at the base of the Blue Lias Formation, perhaps owing to an unconformity. The post-extinction palynoflora, as expressed in SAB4, is completely dominated by C. meyerianus, with only minor abundance peaks in the pinacean pollen Pinuspollenites minimus and Kraeuselisporites reissingerii (Bonis, Ruhl & Kürschner, Reference Bonis, Ruhl and Kürschner2010) (Fig. 3).
Bonis, Ruhl & Kürschner (Reference Bonis, Ruhl and Kürschner2010) illustrated the ranges of 34 (but not all registered) spore and pollen taxa in the St Audrie's Bay succession. Twelve of these, including Ovalipollis, Rhaetipollis germanicus, Lunatisporites rhaeticus, R. tuberculatus and P. polymicroforatus, disappear over the TJB interval, thus indicating a 35% turnover.
3.c. Stenlille
The general palynological changes across the siliciclastic marine to shallow marine TJB succession at Stenlille in the Danish Basin were presented in Lindström et al. (Reference Lindström, van de Schootbrugge, Dybkjær, Pedersen, Fiebig, Nielsen and Richoz2012), and a detailed palynological study will be presented elsewhere, but a brief review of the palynological succession is presented herein. A selection of representative Rhaetian–Hettangian spores and pollen from the Danish Basin are shown in Figure 4. The Stenlille palynozonation is correlated with that of Kuhjoch (Fig. 5) and St Audrie's Bay (Fig. 6), and the palynofloral changes over the extinction interval are further summarized in Table 2.
Photographs of some Rhaetian–Hettangian spores and pollen from the Danish Basin. Taxa names are followed by location, sample depth, slide number and England Finder coordinates. Scale bar is 20 μm. (a) Deltoidospora toralis, Höllviken-2, 1475.50 m: 4, J29/1. b) Trachysporites asper, Stenlille-4, 1502.38 m: 4, O19/1. (c) Thymospora ipsviciensis, Höllviken-2, 1475.50 m: 2, O37/2. (d) Ricciisporites tuberculatus, Stenlille-1, 1506.74 m: 4, K24/1. (e) Limbosporites lundbladii, Höllviken-2, 1477.95 m: 1, J29/4. (f) Kraeuselisporites reissingerii, Stenlille-4, 1511.75 m: 3, N34/2. (g) Vitreisporites pallidus, Stenlille-4, 1500.51 m: 3, P42/4. (h) Granuloperculatipollis rudis. (i) Polypodiisporites polymicroforatus, finely sculptured specimen, Höllviken-2, 1475.50 m: 4, K28/1. (j) Rhaetipollis germanicus, Höllviken-2, 1477.95 m: 1, G32/4. (k) Perinopollenites elatoides, Stenlille-4, 1501.42 m: 4, J26/1. (l) Classopollis meyerianus, Stenlille-4, 1502.15 m: 4, M31/2. (m) Ovalipollis ovalis, Stenlille-4, 1511.75 m: 3, H31/1. (n) Pinuspollenites minimus, Höllviken-2, 1372.95 m: 2, T41/4. (o) Cerebropollenites thiergartii, Höllviken-2, 1394.94 m: 1, H38/2. (p) Classopollis torosus, tetrad, Höllviken-2, 1372.95 m: 2, M30/4. (q) Alisporites robustus, Höllviken-2, 1422.2 m: 2, Q24/2.

Selected palynological changes across the TJB succession at Stenlille, Denmark (after Lindström et al. Reference Lindström, van de Schootbrugge, Dybkjær, Pedersen, Fiebig, Nielsen and Richoz2012, this paper) in comparison with the GSSP at Kuhjoch, Austria (after Bonis et al. Reference Bonis, Kürschner and Krystyn2009; Hillebrandt et al. Reference Hillebrandt, Krystyn, Kürschner, Bonis, Ruhl, Richoz, Schobben, Urlichs, Bown, Kment, McRoberts, Simms and Tomãsových2013). Grey-shaded area marks the Jurassic. Inferred position (*) of Psiloceras planorbis is from Lindström et al. (Reference Lindström, Pedersen, van de Schootbrugge, Hansen, Kuhlmann, Thein, Johansson, Petersen, Alwmark, Dybkjær, Weibel, Erlström, Nielsen, Oschmann and Tegner2015).

Selected palynological changes across the TJB succession at Stenlille, Denmark (after Lindström et al. Reference Lindström, van de Schootbrugge, Dybkjær, Pedersen, Fiebig, Nielsen and Richoz2012, this paper) in comparison with that at St Audrie's Bay, UK (after Bonis et al. Reference Bonis, Ruhl and Kürschner2010). Grey-shaded area marks the Jurassic. Inferred position (*) of Psiloceras planorbis is from Lindström et al. (Reference Lindström, Pedersen, van de Schootbrugge, Hansen, Kuhlmann, Thein, Johansson, Petersen, Alwmark, Dybkjær, Weibel, Erlström, Nielsen, Oschmann and Tegner2015).

3.c.1. Pre-extinction palynoflora (Rhaetian)
The pre-extinction assemblages from the Gassum Formation and lowermost part (black shales at MFS7 by Nielsen, Reference Nielsen2003) of the Fjerritslev Formation are dominated by almost equal amounts of cheirolepidiacean pollen (predominantly Classopollis torosus with common C. meyerianus and Granuloperculatipollis rudis) and Perinopollenites elatoides. Ricciisporites tuberculatus is common to abundant, but rarely dominant. Deltoidospora spp. and Vitreisporites spp. are common. Typical Rhaetian taxa such as Ovalipollis spp., Rhaetipollis germanicus, Limbosporites lundbladii and Lunatisporites rhaeticus are present. The assemblages are assigned to the informal Granuloperculatipollis–Classopollis–Perinopollenites (GCP) Zone (Figs 5, 6; Table 2). This indicates a terrestrial vegetation dominated by probable coastal cheirolepids that could tolerate dryer conditions, with moisture-loving taxodiacean/cupressacean conifers, caytonialean pteridosperms and tree ferns growing in forested mires on the lowlands behind the coastal zone (Petersen & Lindström, Reference Petersen and Lindström2012). Towards the top of the interval all cheirolepid pollen decline in abundance. Perinopollenites elatoides persists in high abundances towards the top of the zone, while Deltoidospora increases in abundance (Figs 5, 6).
3.c.2. Extinction palynoflora (Rhaetian)
There is a marked change to the Polypodiisporites–Ricciisporites–Deltoidospora (PRD) Zone, which encompasses the grey siltstone interval of the Fjerritslev Formation (Lindström et al. Reference Lindström, van de Schootbrugge, Dybkjær, Pedersen, Fiebig, Nielsen and Richoz2012). The extinction palynoflora is dominated by the tree fern spores Deltoidospora spp., schizaeacean fern spores P. polymicroforatus and R. tuberculatus (Figs 5, 6). Except for Ricciisporites, pollen of gymnosperms are few during this interval. Towards the top of the grey siltstone interval, rare specimens assigned to Cerebropollenites thiergartii appear for the first time (Figs 5, 6). There is a successive change in the palynoflora, as first Deltoidospora, then P. polymicroforatus and R. tuberculatus decline markedly in abundance. Instead, sphenopsid spores assigned to Calamospora tener, ground fern spores Conbaculatisporites spp. and monosulcate pollen increase in abundance within a brief interval referred to the Calamospora–Conbaculatisporites–Monosulcites (CCM) Zone (Figs 5, 6).
3.c.3. Recovery palynoflora (latest Rhaetian)
The succeeding interval, the Perinopollenites–Deltoidospora–Stereisporites (PDS) Zone, is marked by a massive increase in taxodiacean/cupressacean pollen (P. elatoides), and spores of putative tree ferns (Deltoidospora) as well as cheirolepid pollen are present but in low abundances (Figs 5, 6). This is interpreted as the onset of recovery of the terrestrial ecosystem after the end-Triassic event (Lindström et al. Reference Lindström, van de Schootbrugge, Dybkjær, Pedersen, Fiebig, Nielsen and Richoz2012).
3.c.4. Post-extinction palynoflora (Hettangian)
The succeeding Deltoidospora–Perinopollenites–Pinuspollenites (DPPi) Zone is marked by an increase in pinacean bisaccate pollen assigned to Pinuspollenites minimus. The assemblages are otherwise dominated by Deltoidospora with a high abundance of Perinopollenites, but the latter has markedly decreased in abundance in comparison to the previous interval (Figs 5, 6).
No ammonites have been found in the Stenlille succession, but Psiloceras planorbis is present in the Rødby-1 well in Denmark (situated in the northernmost part of the German Basin), which can be correlated with the Stenlille succession based on palynology, C-isotopes and geophysical log-correlation (K. H. Hansen, unpub. M.Sc. thesis, Univ. Copenhagen, 2013). This correlation indicates that the level of the first occurrence (FO) of Psiloceras planorbis should be placed within the lowermost part of the succeeding Perinopollenites–Pinuspollenites (PPi) Zone (Figs 5, 6); hence, the TJB is most probably placed in the lower DPPi Zone (Figs 5, 6). The PPi Zone differs from the previous one in that Perinopollenites dominates over Deltoidospora, which has declined markedly, while Pinuspollenites remains abundant. The DPPi and the PPi zones can both be correlated with the Pinuspollenites–Trachysporites Zone of Lund (Reference Lund1977) (Figs 5, 6).
Most of the typical Rhaetian taxa decrease markedly in abundance during the RPD Zone or disappear completely. Rare specimens of some taxa are still registered within the PDS and DPPi zones; however, it is difficult to assess whether these represent true occurrences or reworking. As much as 47% of the typical Rhaetian taxa disappear at the top of the CCM Zone or prior to the PPi Zone (Table 2).
3.d. Astartekløft, Greenland
The palynological succession at Astartekløft was first described by Pedersen & Lund (Reference Pedersen and Lund1980), who divided it into two zones, Zone 1 and 2, which in turn were subdivided into three and two subzones, respectively. Subzones 1L (for lower) and 1M (for middle) equate to the Lepidopteris Zone of Harris (Reference Harris1937), while Subzone 1U (for upper) corresponds to the Transition Zone of Harris (Reference Harris1937). Subzones 2L and 2U both represent the Taumatopteris Zone (Pedersen & Lund, Reference Pedersen and Lund1980). The exact stratigraphical positions of the samples analysed by Pedersen & Lund (Reference Pedersen and Lund1980) are difficult to relate to the later published lithostratigraphic column of Hesselbo et al. (Reference Hesselbo, Robinson, Surlyk and Piasecki2002), but provide valuable information on the palynofloral changes in the succession. In a more recent palynological study of the Astartekløft succession, Mander, Kürschner & McElwain (Reference Mander, Kürschner and McElwain2010, Reference Mander, Kürschner and McElwain2013) restricted their sampling and analyses to the seven macrofossil plant beds. Based on cluster analysis they divided the palynofloral succession into four zones, A1 to A4. Detailed palynological data for the latter can be found in Mander, Kürschner & McElwain (Reference Mander, Kürschner and McElwain2010, supplementary dataset S2). There are some significant differences between the palynological record of Pedersen & Lund (Reference Pedersen and Lund1980) and that of Mander, Kürschner & McElwain (Reference Mander, Kürschner and McElwain2013). The most prominent difference is found in the amounts of Pinuspollenites minimus registered in the succession. Mander, Kürschner & McElwain (Reference Mander, Kürschner and McElwain2013) registered common to abundant P. minimus throughout the succession, without any significant changes in abundance. According to Pedersen & Lund (Reference Pedersen and Lund1980), P. minimus is only sporadically present in subzones 1L and 1M, not registered in subzones 1U and 2L, and first becomes common in the uppermost assemblage of Subzone 2U. It is not clear whether these differences could be due to different sampling strategies. The palynofloral changes over the extinction interval at Astartekløft are briefly reviewed below (Fig. 7), and are summarized in Table 2.
Selected palynological changes across the TJB succession at Astartekløft, Greenland (after Mander et al. Reference Mander, Kürschner and McElwain2010, Reference Mander, Kürschner and McElwain2013) in comparison with that at Stenlille, Denmark (after Lindström et al. Reference Lindström, van de Schootbrugge, Dybkjær, Pedersen, Fiebig, Nielsen and Richoz2012, this paper). Grey-shaded area marks the Jurassic. Inferred position (*) of Psiloceras planorbis is from Lindström et al. (Reference Lindström, Pedersen, van de Schootbrugge, Hansen, Kuhlmann, Thein, Johansson, Petersen, Alwmark, Dybkjær, Weibel, Erlström, Nielsen, Oschmann and Tegner2015).

3.d.1. Pre-extinction palynoflora (Rhaetian)
The lowest zone of Mander, Kürschner & McElwain (Reference Mander, Kürschner and McElwain2013), A1 (plant beds 1, 1.5 and 2), is dominated by Ricciisporites tuberculatus with common osmundaceous fern spores (Osmundacidites, Baculatisporites, Punctatisporites) and lycophyte spores, mainly Uvaesporites reissingerii (Fig. 7). Zone A2 (plant beds 3 and 4) is marked by a distinct increase in the abundance of tree fern spores (Deltoidospora), osmundaceous fern spores and lycophyte spores, primarily U. reissingerii, but in the lowermost assemblage Limbosporites lundbladii (Fig. 7). However, this lycophyte acme is only characteristic for the lower half of the zone (plant bed 3), with only common R. tuberculatus. Zone A1 and the lower part of A2 probably correspond to subzones 1L and 1M of Pedersen & Lund (Reference Pedersen and Lund1980) as they only register that R. tuberculatus is common and U. reissingerii is present within Subzone 1M. These assemblages are correlated with the Rhaetipollis–Limbosporites Zone of Lund (Reference Lund1977) by both Pedersen & Lund (Reference Pedersen and Lund1980) and Mander, Kürschner & McElwain (Reference Mander, Kürschner and McElwain2013).
3.d.2. Extinction palynoflora (Rhaetian)
Both Pedersen & Lund (Reference Pedersen and Lund1980) and Mander, Kürschner & McElwain (Reference Mander, Kürschner and McElwain2013) suggested that the Ricciisporites–Polypodiisporites Zone is absent in Greenland. However, the dominance of R. tuberculatus together with abundant Deltoidospora and common osmundacean fern spores in the upper half of Zone A2 (plant bed 4) may correlate in part to the Ricciisporites–Polypodiisporites Zone (Mander, Kürschner & McElwain, Reference Mander, Kürschner and McElwain2010, Reference Mander, Kürschner and McElwain2013). Zone A3 of Mander, Kürschner & McElwain (Reference Mander, Kürschner and McElwain2013) represents plant bed 5 and the ‘Transition Zone’ of Harris (Reference Harris1937) (Fig. 7). It is dominated by U. reissingerii and osmundaceous fern spores, mainly Baculatisporites comaumensis, while R. tuberculatus has decreased in abundance. There are also acmes in the equisetopsid spore Calamospora tener and the cupressacean/taxodiacean conifer pollen Perinopollenites elatoides in the upper part of the zone. The accessory marker for the base of the Jurassic, Cerebropollenites thiergartii, is registered for the first time within this zone (Fig. 7) (Mander, Kürschner & McElwain, Reference Mander, Kürschner and McElwain2010, Reference Mander, Kürschner and McElwain2013). These results are in accordance with those of Pedersen & Lund (Reference Pedersen and Lund1980), who likewise found common to frequent U. reissingerii and common B. comaumensis in the ‘Transition Zone’ (i.e. their Subzone 1U). However, they did not register any minor acmes in P. elatoides or C. tener. They also registered a questionable specimen of C. thiergartii in their uppermost sample (Pedersen & Lund, Reference Pedersen and Lund1980).
3.d.3. Recovery palynoflora (latest Rhaetian)
Mander, Kürschner & McElwain (Reference Mander, Kürschner and McElwain2013) assigned plant beds 6 and 7 to Zone A4, which is characterized by common fern spores assigned to Trachysporites, while U. reissingerii has decreased markedly and only occurs sporadically. However, there is a major difference in the palynological composition of the two beds, which is why Zone A4 is subdivided into two subzones, a and b, herein. In the lower subzone, A4a (plant bed 6), probable tree fern spores constitute more than 45% of the assemblages. Total loss of Ricciisporites and lycophyte spores plus a marked decrease in conifer pollen in Subzone A4a (plant bed 6) indicate loss of tree-bearing vegetation. Instead spores from tree ferns (Deltoidospora) and osmundaceous ground ferns dominate completely. The entire Zone A4 is correlated by Mander, Kürschner & McElwain (Reference Mander, Kürschner and McElwain2013) with the Pinuspollenites–Trachysporites Zone of Lund (Reference Lund1977); however, Subzone A4a is herein considered to correlate better with the Transition Zone of Lund (Reference Lund1977).
3.d.4. Post-extinction palynoflora (Hettangian)
In the upper Subzone A4b (plant bed 7) Deltoidospora never makes up more than 9% of the assemblages. In addition, Subzone A4b contains higher abundances of corystosperm bisaccate pollen (Alisporites), and conifer pollen assigned to C. thiergartii is also common, indicating the establishment of forests. This is similar to the subdivision of Zone 2 by Pedersen & Lund (Reference Pedersen and Lund1980) into 2L and 2U, only, as mentioned earlier, Pinuspollenites was not registered as common until in their uppermost assemblage of Subzone 2U.
Mander, Kürschner & McElwain (Reference Mander, Kürschner and McElwain2013) considered single occurrences of typical Rhaetian taxa in their uppermost assemblages to be reworked. Out of 52 taxa present in the Rhaetian zones A4 and A5, nine disappear within this interval (Mander, Kürschner & McElwain, Reference Mander, Kürschner and McElwain2010, supplementary table S2), i.e. a palynofloral turnover of 17%.
3.e. Sverdrup Basin, Arctic Canada
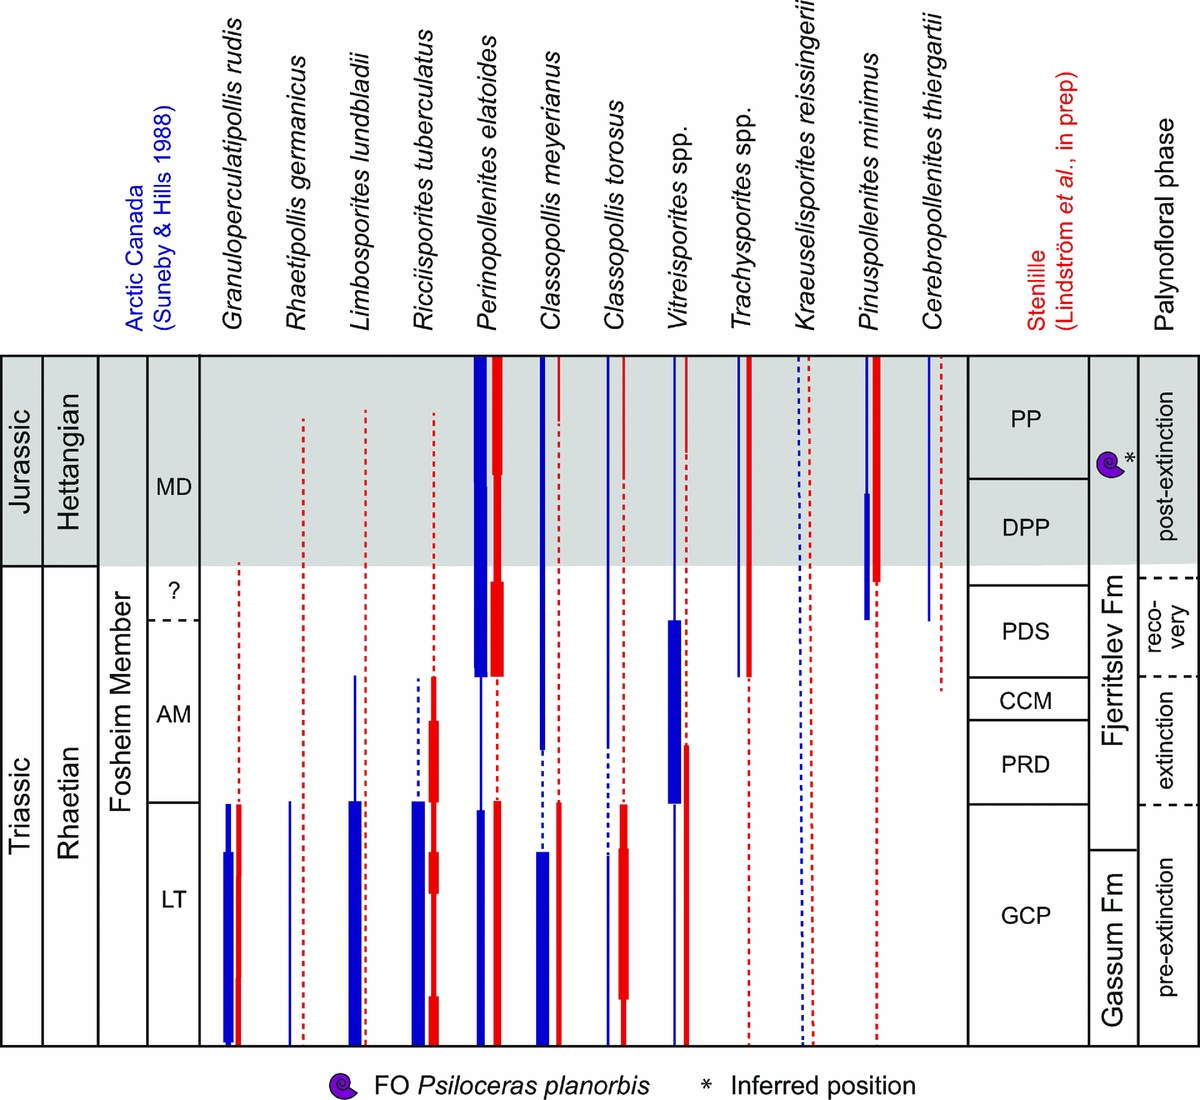
The semi-quantitative palynology of the TJB succession encompassing the Fosheim Member of the Heiberg Formation indicates that the boundary between the Rhaetian and the Hettangian can be distinguished in the Sverdrup Basin (Suneby & Hills, Reference Suneby and Hills1988). Rhaetian–Hettangian palynofloras were recognized in two sections: McKinley Bay and Blackwelder Anticline (Suneby & Hills, Reference Suneby and Hills1988). The palynofloral changes across the TJB in the Sverdrup Basin are reviewed briefly below (Fig. 8), and are summarized in Table 2.
Selected palynological changes across the TJB succession in the Sverdrup Basin, Arctic Canada (after Suneby & Hills, Reference Suneby and Hills1988) in comparison with that at Stenlille, Denmark (after Lindström et al. Reference Lindström, van de Schootbrugge, Dybkjær, Pedersen, Fiebig, Nielsen and Richoz2012, this paper). Grey-shaded area marks the Jurassic. Inferred position (*) of Psiloceras planorbis is from Lindström et al. (Reference Lindström, Pedersen, van de Schootbrugge, Hansen, Kuhlmann, Thein, Johansson, Petersen, Alwmark, Dybkjær, Weibel, Erlström, Nielsen, Oschmann and Tegner2015).
3.e.1. Pre-extinction palynoflora (Rhaetian)
Typical Rhaetian palynofloras dominated by Ricciisporites tuberculatus and Limbosporites lundbladii, together with common Granuloperculatipollis rudis characterize the Limbosporites lundbladii – Ricciisporites tuberculatus (LT) Biozone of Suneby & Hills (Reference Suneby and Hills1988). Cheirolepid pollen decreases upwards. The cupressacean/taxodiacean pollen Perinopollenites elatoides is consistently present but never dominant (Table 2).
3.e.2. Extinction palynoflora (Rhaetian)
The succeeding Retitriletes austroclavatidites – Chasmatosporites magnolioides (AM) Biozone covers strata that are often barren of palynomorphs (Suneby & Hills, Reference Suneby and Hills1988). The few productive samples of this zone contain many of the species typical for the previous zone; however, these usually persist in lower abundances and disappear at the top of the zone including e.g. R. tuberculatus, L. lundbladii, Cingulizonates rhaeticus and many other typical Rhaetian elements (Suneby & Hills, Reference Suneby and Hills1988). Assemblages from McKinley Bay are dominated by lycophyte spores (Limbosporites) and abundant tree fern spores, and common caytonialean bisaccates (Vitreisporites). The lower and middle AM Biozone is herein considered to represent the extinction flora, in which lycophytes dominate together with common tree ferns and caytonialean seed ferns (Fig. 8; Table 2).
3.e.3. Recovery palynoflora (latest Rhaetian)
The upper AM Biozone (known from Blackwelder Anticline) is dominated by caytonialean bisaccate pollen assigned to Vitreisporites. Tree ferns (Deltoidospora, Dictyophyllidites) and ginkgoalean/cycadalean monosulcate pollen assigned to Chasmatosporites apertus are common to abundant. The uppermost part of the AM Biozone is marked by a major increase in cupressacean/taxodiacean pollen (Perinopollenites elatoides) and abundant equisetalean spores (Calamospora) (Fig. 8).
3.e.4. Post-extinction palynoflora (Hettangian)
Assemblages of the Upper Fosheim Member are assigned a Hettangian to Sinemurian age, and are referred to the Cerebropollenites macroverrucosus – Pityosporites divulgatus (MD) Biozone (Suneby & Hills, Reference Suneby and Hills1988). This zone is characterized by common to abundant bisaccate pollen, and increased abundances of Chasmatosporites, Perinopollenites and osmundaceous fern spores (Baculatisporites, Osmundacidites). Cerebropollenites thiergartii appears at the base of the zone in one locality, but at the other two localities it first appears in the middle of the zone together with C. macroverrucosus, a NW European marker for the Hettangian–Sinemurian boundary (Dybkjær, Reference Dybkjær1991). Only the lowermost part of the MD Biozone, below the FO of C. macroverrucosus, is herein considered to represent Hettangian strata (Fig. 8).
Forty-two out of 79 of the taxa present within the Rhaetian LT and AM biozones in the McKinley Bay section are not present in the overlying MD Biozone, indicating a turnover of 53% (Table 2). In the Blackwelder Anticline section the similar turnover is 38% (23/61 taxa) (data from Suneby & Hills, Reference Suneby and Hills1988).
3.f. New Zealand
In New Zealand identification of the TJB is based on marine invertebrates, and is probably located near the FO of the bivalve Otapiria marshalli, while the first psiloceratid ammonites correlated with the Pacificum Horizon appear higher up in the Aratauran succession (Stevens, Reference Stevens2012). Late Triassic to Early Jurassic palynofloras from New Zealand have been described by De Jersey & Raine (Reference De Jersey and Raine1990) and Zhang & Grant-Mackie (Reference Zhang and Grant-Mackie2001), and were recently reviewed in De Jersey & McKellar (Reference De Jersey and McKellar2013) and Bomfleur et al. (Reference Bomfleur, Schöner, Schneider, Viereck, Kerp and McKellar2014). As an example, the palynofloral succession at Kawhia coast encompasses the Ngutunui, Arataura, Rewarewa and Arawhero formations and includes palynofloras assigned to assemblages II to IV by Zhang & Grant-Mackie (Reference Zhang and Grant-Mackie2001), and these are reviewed briefly below (Fig. 9), and the palynofloral changes are summarized in Table 2.
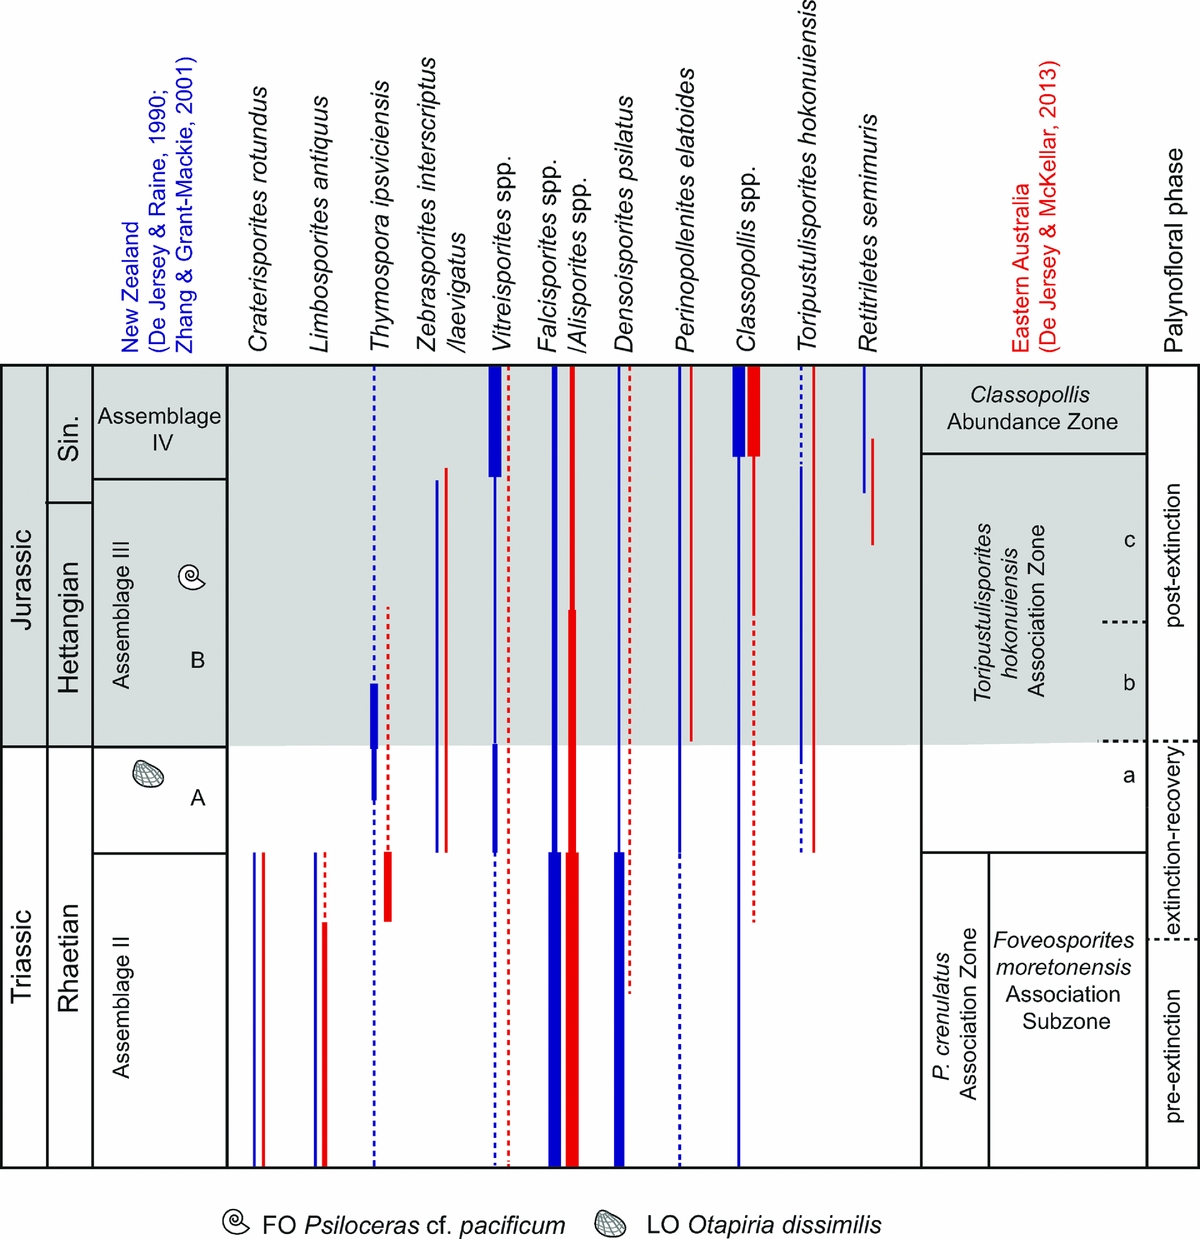
Selected palynological changes across the TJB succession at SW Kawhia, New Zealand (after Zhang & Grant-Mackie, Reference Zhang and Grant-Mackie2001) in comparison with that from Queensland, Australia (after De Jersey, Reference De Jersey1971; De Jersey & McKellar, Reference De Jersey and McKellar2013). Grey-shaded area marks the Jurassic. Sin. – Sinemurian.
3.f.1. Pre-extinction palynoflora (Rhaetian)
Rhaetian (Otapirian) pre-extinction palynofloras occur in Assemblage II from the lower Ngutunui Formation and are dominated by the lycophyte spores Densoisporites psilatus and Uvaesporites spp., and corystosperm pollen assigned to Alisporites (Zhang & Grant-Mackie, Reference Zhang and Grant-Mackie2001).
3.f.2. Extinction palynoflora (Rhaetian)
The boundary between assemblages II and III is marked by a dramatic decline in the abundance of the characteristic Triassic taxa, Alisporites spp. and Densoisporites psilatus, from 60% in Assemblage II to 5% in Assemblage III (De Jersey & McKellar, Reference De Jersey and McKellar2013). At Kawhia coast productive samples representing each zone are separated by c. 14 m of strata. Assemblage III commonly contains high abundances of spores, in particular bryophyte spores (Polycingulatisporites, Rogalskaisporites, Stereisporites), and laevigate trilete spores that may represent tree ferns (Deltoidospora and Dictyophyllidites) are also common (Zhang & Grant-Mackie, Reference Zhang and Grant-Mackie2001). The lower boundary of Assemblage III is further marked by the FOs of Toripustulatisporites hokonuiensis and Retitriletes semimuris. At Kawhia coast this biozone can possibly be subdivided into an older and a younger subzone, herein referred to subzones A and B, respectively. Subzone A encompasses palynofloras recovered from strata of the upper Ngutunui Formation that still contain the Triassic bivalve Otapiria dissimilis (Akikuni et al. Reference Akikuni, Hori, Vajda, Grant-Mackie and Ikehara2010). Hence, the earliest part of Assemblage III in New Zealand and its eastern Australian equivalent the Toripustulatisporites hokonuiensis Assemblage Zone of De Jersey & McKellar (Reference De Jersey and McKellar2013; see Section 3.g below) is actually late Rhaetian in age. The lowermost assemblage in Subzone A is dominated by bryophyte and tree fern spores, and abundant osmundaceous fern spores. Corystosperms have decreased in abundance and are partly replaced by caytonialeans. It may represent the extinction palynoflora, but there is also a possibility that the extinction palynoflora is not represented owing to the low sampling resolution across the formation boundary.
3.f.3. Recovery palynoflora (latest Rhaetian)
The upper assemblage of Subzone A is dominated by bryophyte spores. Corystosperms, tree ferns and osmundaceous ferns are abundant. The caytonialean bisaccate pollen Vitreisporites pallidus (as V. signatus) and marattialean fern spores are common.
3.f.4. Post-extinction palynoflora (Hettangian–Sinemurian)
The typical early Hettangian bivalve Otapiria marshalli has not been recovered from the Kawhia coast section, and because early Sinemurian ammonites have been recovered from the lower part of the Arataura Formation at Kawhia coast the Hettangian succession is either condensed or parts of it are missing (Akikuni et al. Reference Akikuni, Hori, Vajda, Grant-Mackie and Ikehara2010; Stevens, Reference Stevens2012). However, O. marshalli has been recovered from the Awakino Gorge section, where it occurs some 23 m above the last occurrence of O. dissimilis (Akikuni et al. Reference Akikuni, Hori, Vajda, Grant-Mackie and Ikehara2010). Hence, the younger Subzone B of Assemblage III (recognized herein) encompasses only one Hettangian palyno-sample, while the remaining two are early Sinemurian in age (Zhang & Grant-Mackie, Reference Zhang and Grant-Mackie2001; Akikuni et al. Reference Akikuni, Hori, Vajda, Grant-Mackie and Ikehara2010). In Subzone B caytonialean bisaccates (Vitreisporites) are present but in low numbers, while osmundaceous fern spores assigned to Osmundacidites and Baculatisporites are more abundant. The Sinemurian Assemblage IV from the Rewarewa and Arawhero formations is characterized by abundant cheirolepid pollen assigned to Classopollis and an increasing abundance of caytonialean Vitreisporites (Zhang & Grant-Mackie, Reference Zhang and Grant-Mackie2001).
Only 6 of 39 taxa, i.e. 15%, disappear at the boundary between assemblages II and III, but the major change is in the composition of the palynoflora (Table 2).
3.g. Queensland, eastern Australia
De Jersey & McKellar (Reference De Jersey and McKellar2013) presented new palynological data across the TJB in the terrestrial succession of the Clarence-Moreton Basin in southeastern Queensland. TJB palynology of this area has previously been presented in De Jersey (Reference De Jersey1971). The recognition of the boundary was based on the first appearances of five taxa that are also present in the independently dated (by ammonites and bivalves) TJB succession in New Zealand (see Section 3.f above). Like the New Zealand record, the eastern Australian record is of low resolution, but still displays some major and characteristic changes across the TJB (Table 2), and these are reviewed briefly below (Fig. 9). A selection of Rhaetian–Hettangian spores and pollen from Australia are shown in Figure 10.
Photographs of selected Rhaetian–Hettangian spores and pollen from the southern hemisphere. (a–h) Carnarvon Basin, Western Australia (from Backhouse & Balme, Reference Backhouse and Balme2002; reproduced with permission of MRIWA). (i–o) Queensland, eastern Australia (from De Jersey & McKellar, Reference De Jersey and McKellar2013; reproduced with permission of the State of Queensland). Taxa names are followed by location, sample depth, slide number and (for the Queensland specimens) England Finder coordinates. Scale bar is 10 μm. (a) Dictyophyllidites harrisii, Dailey-1, 1400 m. (b) Craterisporites rotundus, North Rankin-5, 2925.76 m. (c) Thymospora ipsviciensis, Dailey-1, 1400 m. (d) Classopollis meyerianus, Keast-2, 3015.44 m. (e) Leschikisporis sp. B, Keast-2, 3016.15 m. (f) Perinopollenites elatoides, Keast-2, 3015.44 m. (g) Ashmoripollis reducta, Dockerell-2, 2999.85 m. (h) Falcisporites australis, North Rankin-5, 2922.29 m. (i) Limbosporites antiquus, GSQ Ipswich 25, 313.43.39 m, S9622, S43/0. (j) Zebrasporites interscriptus, GSQ Ipswich 1, 147.39 m, S1780, D39/1. (k) Densoisporites psilatus, GSQ Ipswich 25, 320.61 m, S9619, M36/3. (l) Classopollis meyerianus, GSQ Ipswich 25, 88.68 m, 1630874, L27/2. (m) Classopollis sp. cf. C. chateaunovi, GSQ Ipswich 25, 78.68 m, A 480/1, K33/0. (n) Toripustulatisporites hokonuiensis, GSQ Ipswich 1, 117.19 m, S1819, O37/4. (o) Falcisporites australis, DME Ipswich NS 272, 368.14 m, S2135, L35/0.

3.g.1. Pre-extinction flora (Rhaetian)
Pre-extinction assemblages from the Raceview Formation were assigned to the Polycingulatisporites crenulatus Zone, which is characterized by a dominance of corystospermous bisaccate pollen assigned to Alisporites/Falcisporites. From the study by De Jersey (Reference De Jersey1971) it is evident that there are palynofloral changes within the uppermost Raceview Formation. In the cored GSQ Ipswich 4 well, assemblages from this formation are first dominated by bisaccate pollen with common lycophyte spore Limbosporites antiquus.
3.g.2. Extinction palynoflora (Rhaetian)
Towards the top of the Raceview Formation and the P. crenulatus Association Zone there is a slight decrease in bisaccates. Limbosporites antiquus becomes rare while instead marattialean (Thymospora ipsviciensis) and osmundaceous (Osmundacidites) fern spores become abundant (De Jersey, Reference De Jersey1971). De Jersey & McKellar (Reference De Jersey and McKellar2013) showed rare Limbosporites antiquus and abundant Thymospora ipsviciensis in their Raceview Formation samples from GSQ Ipswich 25. These assemblages may represent the extinction palynoflora; however, studies with a higher resolution are needed to assess the palynofloral changes across the formation boundary.
3.g.3. Recovery palynoflora (latest Rhaetian)
Assemblages from the succeeding Ripley Road Sandstone are assigned to the Toripustulatisporites hokonuiensis Association Zone, the lower limit of which is marked by the FO of the nominate taxon (De Jersey & McKellar, Reference De Jersey and McKellar2013). In the lowermost part of this zone, corystospermous bisaccate pollen (Alisporites) continues to dominate, although it has declined slightly in abundance compared to the previous zone. Further, osmundaceous fern spores, probable tree ferns spores and bryophyte spores are common to abundant. This lowermost part of the Toripustulatisporites hokonuiensis Association Zone, herein referred to as subzone a, is correlated with Assemblage IIIa in New Zealand, which suggests a latest Rhaetian age for this part of the zone (Fig. 9). It may represent the recovery palynoflora.
3.g.4. Post-extinction palynoflora (Hettangian–Sinemurian)
Alisporites continues to dominate in the middle part of the Toripustulatisporites hokonuiensis Association Zone, but there is also a marked increase in monosulcate pollen (Ginkgo, cycads). The middle part of the zone, herein referred to as subzone b, is further marked by the incoming of Perinopollenites elatoides. In the upper part of the zone, here referred to as subzone c (Fig. 8), cheirolepidiacean conifer pollen becomes common while there is a marked decrease in corystosperm pollen. In the succeeding Sinemurian Classopollis Abundance Zone, cheirolepids and corystosperm pollen dominate, together with common monosulcate pollen and osmundaceous fern spores (data from De Jersey & McKellar, Reference De Jersey and McKellar2013).
In general, the eastern Australian TJB record is similar to that of New Zealand; however, in the latter, spores generally dominate the palynofloras during Rhaetian and early Hettangian times, while the former contains much higher abundances of pollen. De Jersey & McKellar (Reference De Jersey and McKellar2013) correlated their assemblages from the P. crenulatus Zone with the uppermost Assemblage II of New Zealand (Zhang & Grant-Mackie, 2001) based on the co-occurrence of Limbosporites antiquus, Densoisporites psilatus and Classopollis meyerianus. One interesting trend observed in both the New Zealand and the eastern Australian records is an abundance of marattialean fern spores, which post-dates the Rhaetian lycophyte abundance. This lycophyte abundance is not apparent in the record of De Jersey & McKellar (Reference De Jersey and McKellar2013), but is evident in that of De Jersey (Reference De Jersey1971) where sampling probably includes older strata.
The palynological records of GSQ Ipswich 25 (De Jersey & McKellar, Reference De Jersey and McKellar2013) and GSQ Ipswich 3 and 4 (De Jersey, Reference De Jersey1971) both indicate that 19% of the typical Rhaetian palynoflora disappears across the TJB.
3.h. Northern Carnarvon Basin, Western Australia
In the Carnarvon Basin, Western Australia, the TJB transition has been sampled in two cored wells, North Rankin 6 and Keast 2 (Backhouse & Balme, Reference Backhouse and Balme2002). The sedimentary succession belongs to the upper Brigadier Formation and is without any apparent unconformity, but the sharp shift from Rhaetian to Hettangian palynofloras suggest there may be a part of the section missing (Backhouse & Balme, Reference Backhouse and Balme2002). The characteristics of the palynofloral changes across the TJB in Western Australia are summarized in Table 2, and are briefly reviewed below (Fig. 11).
Selected palynological changes across the TJB succession in the Carnarvon Basin, Western Australia (after Backhouse & Balme, Reference Backhouse and Balme2002) in comparison with that from Queensland, Australia (after De Jersey, Reference De Jersey1971; De Jersey & McKellar, Reference De Jersey and McKellar2013). Grey-shaded area marks the Jurassic. Sin. – Sinemurian.
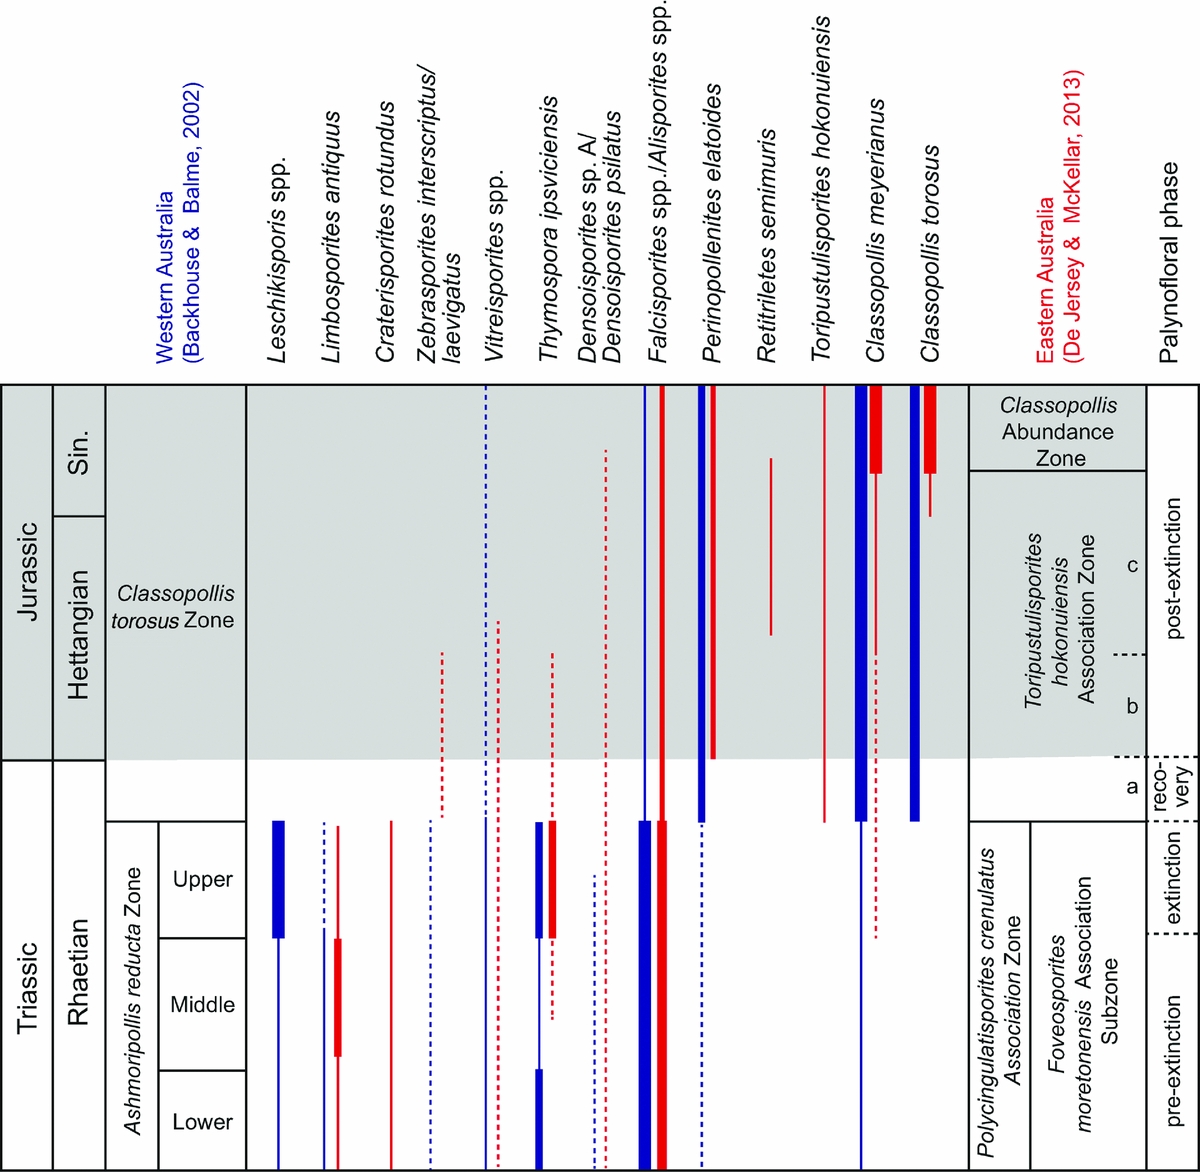
3.h.1. Pre-extinction palynoflora (Rhaetian)
Rhaetian assemblages belong to the Ashmoripollis reducta Zone, which is dominated by the corystospermous pollen Falcisporites australis, the probable gymnospermous pollen Ashmoripollis reducta, as well as common fern spores assigned to Thymospora ipsviciensis. The zone is subdivided into three subzones: the lower, the middle and the upper subzone, in ascending order (Backhouse & Balme, Reference Backhouse and Balme2002). The lower and the middle subzones are dominated by corystosperm seed ferns, with common to abundant tree fern spores, and are herein considered to represent the pre-extinction palynoflora.
3.h.2. Extinction palynoflora (Rhaetian)
Corystosperms continue to dominate in the upper subzone of the Ashmoripollis reducta Zone, and ferns, especially marattialean and osmundaceous ferns and tree ferns, are also abundant, and schizaeacean fern spores are common. During the upper subzone, 12 out of 48 taxa disappear, and an additional 25 taxa disappear at the top of the zone (Backhouse & Balme, Reference Backhouse and Balme2002). Most typical Rhaetian taxa that disappeared at the TJB in Western Australia were ferns or fern allies, e.g. schizaeacean, polypodiacean and marattialean fern spores (Leschikisporis, Polypodiisporites, Thymospora). Some of the undescribed forms of Leschikisporis reported by Backhouse & Balme (Reference Backhouse and Balme2002) are morphologically similar, possibly even in part identical to variants of Polypodiisporites polymicroforatus from the northern hemisphere.
3.h.3. Recovery palynoflora (latest Rhaetian)
The boundary between the Ashmoripollis reducta Zone and the succeeding Classopollis torosus Zone is marked by a simultaneous abrupt decline in Falcisporites spp. and an increase in Classopollis, as well as a marked loss of taxa (Backhouse & Balme, Reference Backhouse and Balme2002). The probable gymnosperm pollen Ashmoripollis reducta and polypodiacean/marattialean fern spores assigned to Thymospora ipsviciensis, which were common constituents during the upper Ashmoripollis reducta Zone, disappear along with many other fern spores. It should be noted that in these wells the typical Rhaetian dinoflagellate cysts Rhaetogonyaulax rhaetica and Suessia swabiana have their last records within the upper A. reducta Zone and at the top of it, respectively. Backhouse & Balme (Reference Backhouse and Balme2002) discussed the possibility of a hiatus at the TJB in their wells, even though there is no obvious unconformity present. This probably means that there is no record of the recovery palynoflora in this succession.
3.h.4. Post-extinction palynoflora (Hettangian–Sinemurian)
The post-extinction palynofloras are dominated by the cheirolepidiacean pollen Classopollis meyerianus and C. torosus, together with common cupressacean/taxodiacean pollen (Perinopollenites elatoides) and fern spores assigned to Dictyophyllidites harrisii (Backhouse & Balme, Reference Backhouse and Balme2002).
The continued presence of the dinoflagellate cyst Dapcodinium priscum in the succeeding Classopollis torosus Zone (Backhouse & Balme, Reference Backhouse and Balme2002) indicates that the Classopollis torosus Zone in these wells is not younger than early Sinemurian (Riding, Mantle & Backhouse, Reference Riding, Mantle and Backhouse2010).
Only 11 of the 48 taxa present in latest Rhaetian time are also present within the post-extinction palynoflora, which gives a turnover of 77% (data from Backhouse & Balme, Reference Backhouse and Balme2002).
4. Discussion
4.a. Correlation
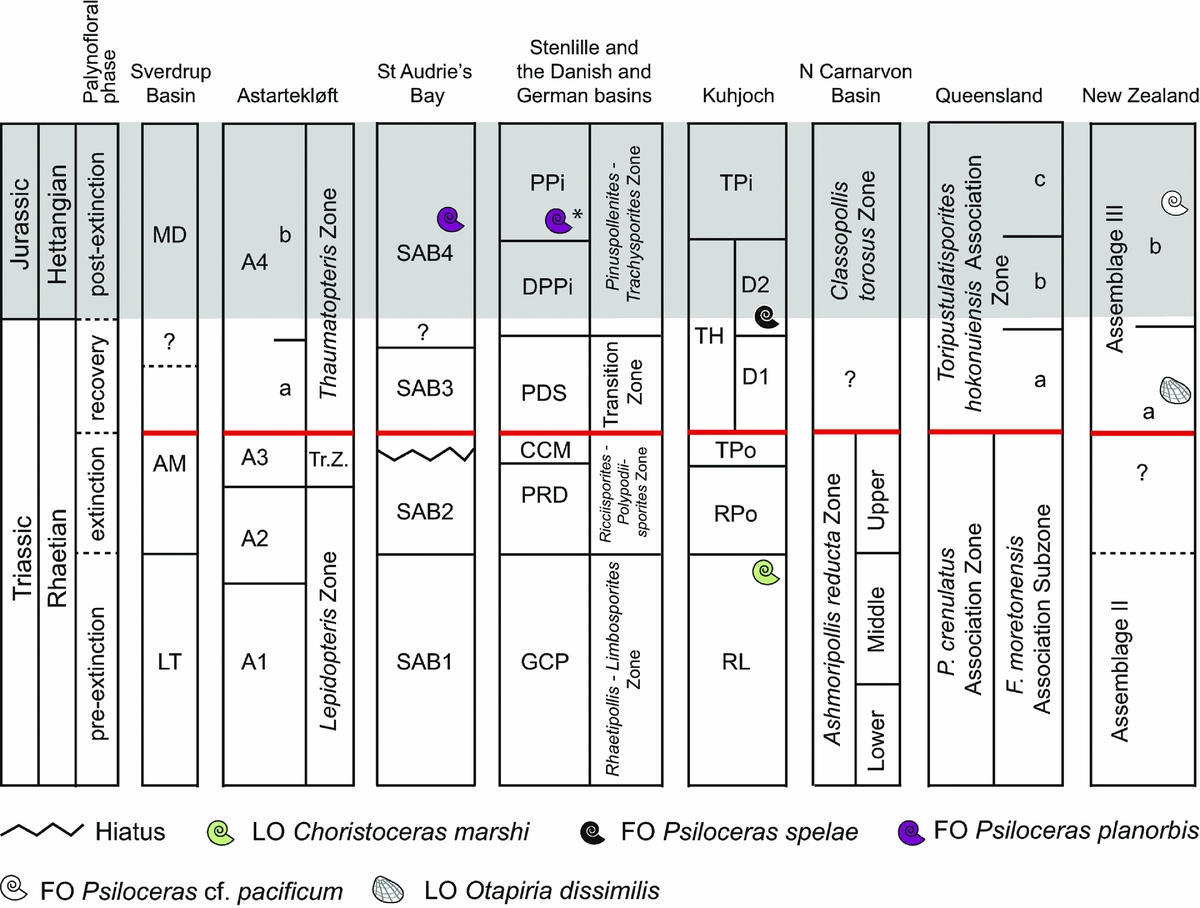
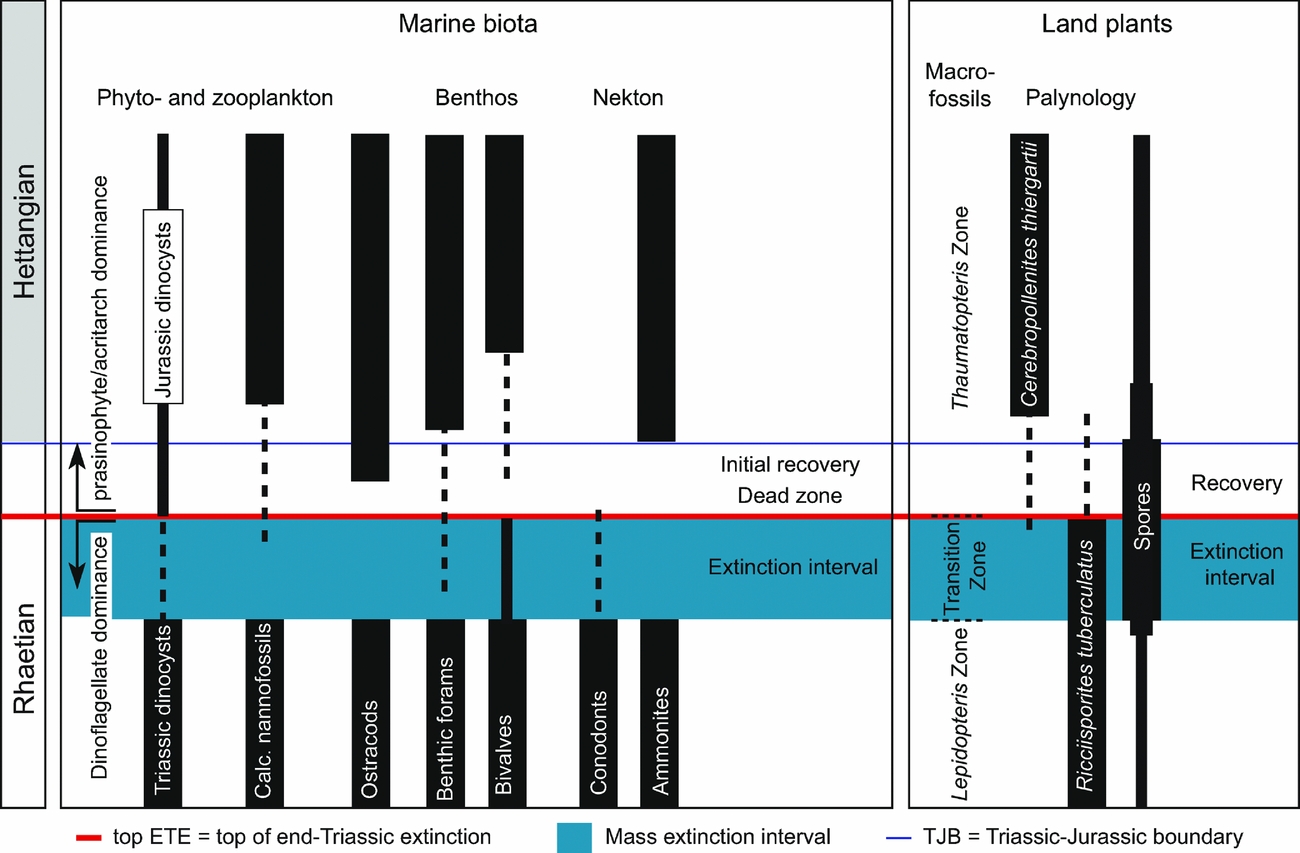
All the herein reviewed successions can be correlated fairly well palynologically in each hemisphere. The palynological correlations are supported by independent dating with marine invertebrates (Fig. 12). In particular, the GSSP locality Kuhjoch provides several useful markers for correlation, both marine and non-marine ones (Hillebrandt et al. Reference Hillebrandt, Krystyn, Kürschner, Bonis, Ruhl, Richoz, Schobben, Urlichs, Bown, Kment, McRoberts, Simms and Tomãsových2013). A compilation of late Rhaetian–Hettangian important biotic marine and terrestrial events in NW Europe is presented in Figure 13. This shows that the extinction and recovery palynofloras identified herein correlate with the marine extinction interval, dead zone and initial recovery (Mander, Twitchett & Benton, Reference Mander, Twitchett and Benton2008) (Fig. 13). In the southern hemisphere, the New Zealand succession plays an important role in long-distance correlations across the former southeastern parts of Pangaea by the combination of marine invertebrate faunas (Akikuni et al. Reference Akikuni, Hori, Vajda, Grant-Mackie and Ikehara2010; Stevens, Reference Stevens2012) and palynology (Zhang & Grant-Mackie, Reference Zhang and Grant-Mackie2001). Correlation of the New Zealand palynoflora, supported by marine invertebrate markers, allows recognition of the extinction interval and palynoflora also in the southern hemisphere (Fig. 12).
Global correlation of the palynofloral successions reviewed herein (Figs 2, 3, 5–9, 11). Grey-shaded area marks the Jurassic. Inferred position (*) of Psiloceras planorbis is from Lindström et al. (Reference Lindström, Pedersen, van de Schootbrugge, Hansen, Kuhlmann, Thein, Johansson, Petersen, Alwmark, Dybkjær, Weibel, Erlström, Nielsen, Oschmann and Tegner2015). Tr. Z. – Transition Zone; thick (red) horizontal line – top of extinction interval.
Comparison of NW European marine biotic events with terrestrial plant events. The marine biotic events are compiled from Hillebrandt et al. (Reference Hillebrandt, Krystyn, Kürschner, Bonis, Ruhl, Richoz, Schobben, Urlichs, Bown, Kment, McRoberts, Simms and Tomãsových2013), Mander et al. (Reference Mander, Twitchett and Benton2008), Clémence et al. (Reference Clémence, Bartolini, Gardin, Paris, Beaumont and Page2010a , Reference Clémence, Gardin, Bartolini, Paris, Beaumont and Guex b ) and Richoz et al. (Reference Richoz, de Schootbrugge, Pross, Püttmann, Quan, Lindström, Heunisch, Fiebig, Maquil, Schouten, Hauzenberger and Wignall2012). The terrestrial plant events are compiled from McElwain et al. (Reference McElwain, Popa, Hesselbo, Haworth and Surlyk2007), Lund (Reference Lund1977) and data from the palynological sites reviewed herein.
4.b. Taxonomic and ecological severity
At all sites terrestrial ecosystem changes occur primarily prior to the TJB (Table 2; Fig. 12). Although, the taxonomic and ecological severity of these changes varies between areas, it appears that all areas experienced ecosystem disturbances during late Rhaetian time. These disturbances led to re-organization of the vegetation with major changes in abundances and loss of taxa as a consequence. The loss of taxa occurs over a time interval that primarily encompasses the marine extinction interval. As an example, at Kuhjoch an initial major change in the terrestrial ecosystem, from conifer-dominated to fern- and caytonialean-dominated vegetation, more or less coincides with the first marine extinction pulse (Hillebrandt et al. Reference Hillebrandt, Krystyn, Kürschner, Bonis, Ruhl, Richoz, Schobben, Urlichs, Bown, Kment, McRoberts, Simms and Tomãsových2013). The marine extinctions continue while this new flora dominated by schizaeacean ferns, caytonialean seed ferns and tree ferns proliferates (Fig. 2; Table 2). Similarly, during this interval some typical Rhaetian taxa disappear completely, e.g. Rhaetipollis germanicus, and probably also Triancoraesporites reticulatus. Others decrease markedly in abundance, e.g. Lunatisporites rhaeticus, Polypodiisporites polymicroforatus, Limbosporites lundbladii, Cingulizonates rhaeticus and Ovalipollis spp., and are found as sporadic rare occurrences in the succeeding zones before disappearing completely. It can be difficult to assess whether such lingering taxa are in situ or simply reworked, as reworking of older material can seemingly extend the ranges of taxa. However, this pattern is similar in almost all of the herein reviewed sites. It is especially pronounced in the Danish (Lindström et al. Reference Lindström, van de Schootbrugge, Dybkjær, Pedersen, Fiebig, Nielsen and Richoz2012; Petersen & Lindström, Reference Petersen and Lindström2012) and German basins (Lund, Reference Lund1977; van de Schootbrugge et al. Reference van de Schootbrugge, Quan, Lindström, Püttmann, Heunisch, Pross, Fiebig, Petschick, Röhling, Richoz, Rosenthal and Falkowski2009; Heunisch et al. Reference Heunisch, Luppold, Reinhardt and Röhling2010).
The western Australian palynological succession is an exception, with its staggering 73% of the Rhaetian taxa ending abruptly within or at the top of the upper Ashmoripollis reducta Zone (Backhouse & Balme, Reference Backhouse and Balme2002). However, although Backhouse & Balme (Reference Backhouse and Balme2002) discussed the possibility of an unconformity separating the upper Ashmoripollis reducta Zone from the Classopollis torosus Zone, the taxonomic turnover is still a fact. Correlation between the western Australian TJB record and that of eastern Australia, and especially the abundance pattern of cheirolepid pollen (Classopollis), definitely suggests that there is an unconformity (Fig. 11). However, an earlier onset of Classopollis-abundance in Western Australia may have been an effect of palaeogeography and palaeoclimatic zones. At the TJB, the Northern Carnarvon Basin was situated approximately 30°S of the Equator, while south-central Queensland was located much further south, at c. 55°S (Fig. 1). The lowest taxonomic losses are registered in New Zealand (15%), Queensland (19%) and Greenland (17%) (Table 2), all of which are sites located in high latitudes (Fig. 1). The Sverdrup Basin was situated further north than Astartekløft, at c. 55°N (Fig. 1), but there the taxonomic losses are estimated at 38–52% depending on locality (Suneby & Hills, Reference Suneby and Hills1988). In the Greenland case, the low spore-pollen turnover may be an effect of a change in fluvial regime as plant bed 5 (TJB of Mander, Kürschner & McElwain, Reference Mander, Kürschner and McElwain2010, Reference Mander, Kürschner and McElwain2013) is sharply overlain by a succession of upward-fining fluvial units, conglomerates and coarse-grained sandstones, reflecting strong erosion and badland development (Steinthorsdottir et al. Reference Steinthorsdottir, Woodward, Surlyk and McElwain2012), indicating that reworking of Rhaetian strata could be an issue at this site.
The ecological impact for each site is estimated according to McGhee et al. (Reference McGhee, Sheehan, Bottjer and Droser2004) and shown in Table 2. Sites categorized as ecological impact Category I are the Sverdrup Basin, Stenlille, Kuhjoch and Northern Carnarvon Basin. At these sites the pre- and post-extinction palynofloras are fundamentally different in composition and dominance, and have also experienced major losses of palynofloral elements from the pre-extinction palynoflora (Table 2). The remaining sites (Astartekløft, St Audrie's Bay, SE Queensland and New Zealand) are all placed in ecological impact Category II, Subcategory IIa following McGhee et al. (Reference McGhee, Sheehan, Bottjer and Droser2004). Here, the existent ecosystems are disrupted, but recover and are not replaced post-extinction, but the disruption has also produced permanent losses of major ecosystem components. The New Zealand and SE Queensland sites are those that are least affected by the reorganizations (Table 2).
4.c. The northern hemisphere Ricciisporites enigma
The enigmatic fused pollen-tetrad Ricciisporites tuberculatus is often common to abundant in Rhaetian strata in parts of the northern hemisphere, and a well-known casualty of the ETE. In the Rhaetian it is a prominent component of the five northern hemisphere sites reviewed herein. It has also been registered in Rhaetian successions in France (Rauscher et al. Reference Rauscher, Hilly, Hanzo and Marchal1995), the Netherlands (Herngreen & De Boer, Reference Herngreen and de Boer1974), Germany (Achilles, Reference Achilles1981; Heunisch et al. Reference Heunisch, Luppold, Reinhardt and Röhling2010), Luxembourg (Schuurman, Reference Schuurman1977), Poland (Orlowska-Zwolinska, Reference Orlowska-Zwolinska1983; Pieńkowski, Niedźwiedzki & Waksmundzka, Reference Pieńkowski, Niedźwiedzki and Waksmundzka2012), Hungary (Götz et al. Reference Götz, Ruckwied, Pálfy and Haas2009), Slovakia (Ruckwied & Götz, Reference Ruckwied and Götz2009), Georgia (Yaroshenko, Reference Yaroshenko2007) and China (Yong et al. Reference Yong, Allen, Densmore and Qiang2003); is absent or sporadic in Spain (Barrón et al. Reference Barrón, Gomez, Goy and Pieren2006; Gómez, Goy & Barrón, Reference Gómez, Goy and Barrón2007); and appears to be absent from Italy (Galli et al. Reference Galli, Jadoul, Bernasconi, Cirilli and Weissert2007) and sites further to the west and south. It basically appears to be confined to mid-latitude (30°N to 60°N) locations. So far, the affinity of the parent plant remains unknown, but its exine ultrastructure most closely resembles that of gymnosperms (Pedersen, Reference Pedersen1983) and clearly shows that it is constructed as a permanent pollen tetrad (Mander et al. Reference Mander, Collinson, Chaloner, Brain and Long2012). Kürschner, Mander & McElwain (Reference Kürschner, Mander and McElwain2014) speculated that it was a herbaceous gymnosperm and that this would explain the absence of macrofossil remains. In most sites Ricciisporites disappears at the top of the extinction interval or decreases dramatically in abundance and only lingers on for a short interval in the succeeding zones (Figs 2, 3, 5–8). The Austrian records differ from this pattern. The continued high abundance of Ricciisporites tuberculatus in the Austrian sections (Kürschner, Bonis & Krystyn, Reference Kürschner, Bonis and Krystyn2007; Bonis, Kürschner & Krystyn, Reference Bonis, Kürschner and Krystyn2009) is remarkable, and may suggest that this area may have acted as a refugia for a population of the parent plant taxon after the biotic crisis.
4.d. A global spore spike?
A global ‘fern spike’ or ‘spore spike’ has been described from palynofloral successions as a consequence of the environmental changes after the Cretaceous–Palaeogene (KPg) event (see e.g. Schulte et al. Reference Schulte, Alegret, Arenillas, Arz, Barton, Bown, Bralower, Christeson, Claeys, Cockell, Collins, Deutsch, Goldin, Goto, Grajales-Nishimura, Grieve, Gulick, Johnson, Kiessling, Koeberl, Kring, MacLeod, Matsui, Melosh, Montanari, Morgan, Neal, Nichols, Norris, Pierazzo, Ravizza, Rebolledo-Vieyra, Reimold, Robin, Salge, Speijer, Sweet, Urrutia-Fucugauchi, Vajda, Whalen and Willumsen2010 and references therein). Fowell & Olsen (Reference Fowell and Olsen1993) described a spore spike from the TJB succession of the Newark Basin, and as this coincided with an iridium anomaly, Olsen et al. (Reference Olsen, Kent, Sues, Koeberl, Huber, Montanari, Rainforth, Fowell, Szajna and Hartline2002) suggested an impact scenario as a cause for the ETE. Both the location of the TJB based on the palynofloral turnover and the associated fern spike below the CAMP basalts in the eastern North American basins (Fowell & Olsen, Reference Fowell and Olsen1993) was questioned by Cirilli et al. (Reference Cirilli, Marzoli, Tanner, Bertrand, Buratti, Jourdan, Bellieni, Kontak and Renne2009), who found Rhaetian palynomorphs in sediments above the oldest basalts. In NW Europe late Rhaetian proliferation of ferns and fern allies during the extinction interval was described by van de Schootbrugge et al. (Reference van de Schootbrugge, Quan, Lindström, Püttmann, Heunisch, Pross, Fiebig, Petschick, Röhling, Richoz, Rosenthal and Falkowski2009) and interpreted as establishment of pioneering vegetation after widespread deforestation caused by volcanic degassing from the CAMP. The deforestation scenario as well as the fern spike was questioned by Bonis & Kürschner (Reference Bonis and Kürschner2012), the latter primarily because there is no stratigraphic consensus that the Newark spore spike and the NW European one are contemporaneous. However, regardless of the age of the Newark spore spike, it is evident from the sites reviewed herein that in contrast to most pre-extinction palynofloras, spores from ferns (tree ferns, schizaeacean, osmundacean and marattialean ferns), bryophytes and lycophytes became dominant components of the extinction palynofloras (Table 2), indicating that the environmental changes that took place generally favoured spore-producing plants over seed plants on both hemispheres. However, there is no indication of a global short-lived spore spike such as those reported from the KPg event (Schulte et al. Reference Schulte, Alegret, Arenillas, Arz, Barton, Bown, Bralower, Christeson, Claeys, Cockell, Collins, Deutsch, Goldin, Goto, Grajales-Nishimura, Grieve, Gulick, Johnson, Kiessling, Koeberl, Kring, MacLeod, Matsui, Melosh, Montanari, Morgan, Neal, Nichols, Norris, Pierazzo, Ravizza, Rebolledo-Vieyra, Reimold, Robin, Salge, Speijer, Sweet, Urrutia-Fucugauchi, Vajda, Whalen and Willumsen2010). In many sites spore-producing plants continue to play a dominant part in the recovery and post-extinction vegetation after the ETE (Table 2), and latitudinal differences are evident.
Very few of the typical Rhaetian to Hettangian spore taxa are considered to be xerophytic (Table 1), which means increased relative amounts of spores could be interpreted as signalling wetter conditions. When analysing the total relative abundances of spores in TJB records from the northern hemisphere it is important to remember that many authors have classified Ricciisporites tuberculatus as a bryophyte spore instead of a gymnosperm pollen. In this review this applies to the records from Greenland (Mander, Kürschner & McElwain, Reference Mander, Kürschner and McElwain2010, Reference Mander, Kürschner and McElwain2013), St Audrie's Bay (Bonis, Ruhl & Kürschner, Reference Bonis, Ruhl and Kürschner2010) and Kuhjoch (Bonis, Kürschner & Krystyn, Reference Bonis, Kürschner and Krystyn2009; Hillebrandt et al. Reference Hillebrandt, Krystyn, Kürschner, Bonis, Ruhl, Richoz, Schobben, Urlichs, Bown, Kment, McRoberts, Simms and Tomãsových2013), and the relative abundances of spores have been adjusted accordingly herein.
In pre-extinction palynofloras, those from high latitudes, i.e. New Zealand and Greenland, contain the highest relative abundances of spores (Table 3), which may then indicate more humid conditions in these areas. The records from St Audrie's Bay and Kuhjoch display the lowest relative abundances of spores, <5% (Table 3), suggesting terrestrial conditions near these two areas were not humid enough to sustain a vegetation rich in spore-producing plants.
Palaeolatitudinal position and total relative spore abundance for each site within each palynofloral phase (except Sverdrup Basin for which only semi-quantitative data exist)

It should be noted that in both the Astartekløft and Stenlille records the relative amounts of spores begin to increase just prior to the extinction interval (Table 3). This may be interpreted as an onset of more humid conditions in these two areas, at least. In Greenland, the total relative amount of spores was exceptionally high during the recovery phase (up to 95%; data from Mander, Kürschner & McElwain, Reference Mander, Kürschner and McElwain2010), and still continued to be dominating in the post-extinction palynoflora, up to 85%. At Stenlille, spores make up as much as 50% to 70%, respectively, of the recovery and initial post-extinction palynofloras, but later decrease to relative abundances around below 30% of the post-extinction assemblages (Lindström et al. Reference Lindström, van de Schootbrugge, Dybkjær, Pedersen, Fiebig, Nielsen and Richoz2012). This is in accordance with decreasing stomatal and canopy transpiration data for both ginkgos and Bennettitales already in plant bed 4 and continuing through plant beds 5 and 6, i.e. the extinction and recovery intervals, with transpiration first returning to pre-extinction levels in plant beds 7 and 8 (Steinthorsdottir et al. Reference Steinthorsdottir, Woodward, Surlyk and McElwain2012). This is interpreted as a response in the plants to increased pCO2 in the atmosphere (Steinthorsdottir et al. Reference Steinthorsdottir, Woodward, Surlyk and McElwain2012). Suppressed transpiration may lead to increased runoff because surplus precipitation is not taken up by plant roots, and could potentially explain the increased total relative abundance of spores from plant bed 4 and upsection (Table 3), as increased soil water availability due to ponding and/or waterlogging may favour spore-producing plants (Steinthorsdottir et al. Reference Steinthorsdottir, Woodward, Surlyk and McElwain2012). The increased runoff hypothesis is further supported by sedimentological evidence of the fluvial regime shifting from low-energy sluggish rivers to high-energy braided rivers (Steinthorsdottir et al. Reference Steinthorsdottir, Woodward, Surlyk and McElwain2012). However, although slightly decreased, the spore abundance remains high also in plant bed 7 (post-extinction phase) even though transpiration had returned to pre-extinction levels.
Regionally widespread wildfires may also have affected the vegetation pattern through deforestation, increased erosion and badland development. Increased frequency of wildfires at the TJB has been reported from Poland, Greenland and the Danish Basin (Marynowski & Simoneit, Reference Marynowski and Simoneit2009; Belcher et al. Reference Belcher, Mander, Rein, Jervis, Haworth, Hesselbo, Glasspool and McElwain2010; Petersen & Lindström, Reference Petersen and Lindström2012).
However, the total relative abundance of spores increased dramatically at all sites during the extinction interval, and the increase is most dramatic in St Audrie's Bay and Kuhjoch (Table 3). At St Audrie's Bay, spores fluctuated markedly over the extinction and recovery interval, with peaks between 60% and 90%, with higher values within the recovery interval, but decrease to generally below 5% in the post-extinction palynoflora (Bonis, Ruhl & Kürschner, Reference Bonis, Ruhl and Kürschner2010). At Kuhjoch, the relative abundance of spores increases over the extinction interval, and fluctuates between c. 50% and 70%, in both the recovery and post-extinction palynofloras (Bonis, Kürschner & Krystyn, Reference Bonis, Kürschner and Krystyn2009; Hillebrandt et al. Reference Hillebrandt, Krystyn, Kürschner, Bonis, Ruhl, Richoz, Schobben, Urlichs, Bown, Kment, McRoberts, Simms and Tomãsových2013). A global first-order sea-level rise at the base of the Jurassic, especially prominent in European marine and marginal successions, but also evident in successions from the Panthalassa Ocean (Hallam, Reference Hallam1997; Hallam & Wignall, Reference Hallam and Wignall1999, Reference Hallam and Wignall2000), may have affected the ground-water levels in coastal areas during earliest Jurassic time, favouring wet-loving vegetation. However, this does not explain the proliferation of spores during latest Rhaetian time when a short-lived but significant sea-level fall is registered (Hallam & Wignall, Reference Hallam and Wignall2000).
4.e. Cheirolepidiacean conifers pre- and post-extinction
In general, cheirolepids are considered to have been xerophytic, i.e. drought tolerant, shrubs or trees (Vakhrameev, Reference Vakhrameev1991), that were wind pollinated plants which produced large amounts of pollen (Ziaja, Reference Ziaja2006). Vakhrameev (Reference Vakhrameev1991) suggested that low abundances of Classopollis would indicate temperate conditions, high abundances subtropical or tropical conditions, and ultrahigh abundances arid conditions. However, at least some cheirolepids appear to have been adapted to coastal environments (Batten, Reference Batten1974; Alvin, Reference Alvin1982; Abbink, Reference Abbink1998). Abbink (Reference Abbink1998) classified Classopollis as a coastal element signalling warm conditions. While some cheirolepids were coastal plants that could tolerate both seasonal droughts and a saline influence on the environment (Francis, Reference Francis1984), others probably preferred less harsh environments. Mussard, Ducazeaux & Cugny (Reference Mussard, Ducazeaux and Cugny1997) found some differences in preferred environment for Classopollis torosus and C. meyerianus, suggesting that the latter probably preferred wetter environments. Based on principal components analysis ordination diagrams of assemblages from Austria and St Audrie's Bay, Bonis & Kürschner (Reference Bonis and Kürschner2012) suggested that these two cheirolepidacean taxa have slightly different environmental preferences, with C. meyerianus being a more warm-loving taxon than C. torosus. Bonis & Kürschner (Reference Bonis and Kürschner2012) suggested that C. torosus could tolerate lower temperatures, as it is present in the Greenland records (Pedersen & Lund, Reference Pedersen and Lund1980; Mander, Kürschner & McElwain, Reference Mander, Kürschner and McElwain2010). However, according to Suneby & Hills (Reference Suneby and Hills1988), C. meyerianus was much more common in the more northerly TJB succession of the Sverdrup Basin record than C. torosus. In Upper Jurassic semi-arid to arid successions C. torosus is sometimes overwhelmingly dominant (Batten, Reference Batten, Jansonius and McGregor1996), indicating that the differences in ecological preference between C. torosus and C. meyerianus may not only be reliant on temperature.
In NW Europe, cheirolepid conifers were often a prominent part of the Rhaetian vegetation (Table 2). At Kuhjoch and Stenlille, cheirolepids suffered severe temporary decline during the extinction interval (Table 4). At Kuhjoch and St Audrie's Bay, cheirolepids were still occasionally prominent during the extinction interval (Figs 2, 3), and this has also been registered in Mingolsheim from southern Germany (van de Schootbrugge et al. Reference van de Schootbrugge, Quan, Lindström, Püttmann, Heunisch, Pross, Fiebig, Petschick, Röhling, Richoz, Rosenthal and Falkowski2009). At least two cheirolepid pollen taxa are known to have gone extinct at the ETE, Granuloperculatipollis rudis and Geopollis zwolinskae (see e.g. Lund, Reference Lund1977). At Kuhjoch and Stenlille, cheirolepids returned after the extinction interval, but generally in much lower abundances than during the pre-extinction phase, down to around 10% (Table 4; Lindström et al. Reference Lindström, van de Schootbrugge, Dybkjær, Pedersen, Fiebig, Nielsen and Richoz2012), while at St Audrie's Bay cheirolepids, and especially C. torosus, became totally dominating, often constituting almost monotypic assemblages (Bonis, Ruhl & Kürschner, Reference Bonis, Ruhl and Kürschner2010) (Table 4). In the interior of Pangaea (Newark Basin) Classopollis occurred sporadically in high abundances below the inferred TJB, but first became consistently dominant during Hettangian time (Whiteside et al. Reference Whiteside, Olsen, Kent, Fowell and Et-Touhami2007).
Palaeolatitudinal position (according to Fig. 1) and total relative abundance of cheirolepid pollen (Geopollis, Granuloperculatipollis, Classopollis)

* For Sverdrup Basin the semi-quantitative data is from the Blackwelder Anticline (Suneby & Hills, Reference Suneby and Hills1988).
In the southern hemisphere, in Australia, C. meyerianus first becomes a consistent presence from the base of the Rhaetian (Backhouse & Balme, Reference Backhouse and Balme2002). Cheirolepids do not become prominent palynofloral elements until Early Jurassic time (Hettangian to Sinemurian) when C. torosus becomes dominant and widespread in Australia and New Zealand (Table 2). It is also known to be dominant in the Sinemurian of Antarctica (Bomfleur et al. Reference Bomfleur, Schöner, Schneider, Viereck, Kerp and McKellar2014).
Considering the total relative spore abundance data of the reviewed sites (Table 3), it seems plausible that increased humid conditions during the extinction, and often also recovery interval, were unfavourable to cheirolepid conifers. Some cheirolepids, like the mother plants of Granuloperculatipollis rudis and Geopollis zwolinskae, suffered extinction at the ETE, while other taxa were successful survivors that continued to thrive during the remainder of the Mesozoic Era. However, many spore-producing plants, especially ferns, can be opportunistic and act as pioneers and invaders of newly formed habitats (Page, Reference Page2002). This was especially true prior to the diversification of angiosperms. Many ferns can tolerate stressful habitats, including low-light conditions and low-nutrient soils, as long as they have enough water available to reproduce (Page, Reference Page2002). Hence, the increased total abundances of spores in both hemispheres during the extinction (and recovery) interval may only reflect environmental or climatic conditions that were less favourable for seed plants, as suggested by van de Schootbrugge et al. (Reference van de Schootbrugge, Quan, Lindström, Püttmann, Heunisch, Pross, Fiebig, Petschick, Röhling, Richoz, Rosenthal and Falkowski2009). Such conditions may include expected effects of CAMP volcanism: acid rain and terrestrial soil and freshwater acidification due to volcanic sulfur dioxide emissions and fluctuating ultraviolet flux due to ozone depletion caused by halogens and halocarbon compounds, in combination with drastically changing climatic conditions due to greenhouse gas emissions. Such a scenario is similar to that recently proposed by Black et al. (Reference Black, Lamarque, Shields, Elkins-Tanton and Kiehl2014) for the terrestrial end-Permian mass extinction.
5. Conclusions
This review shows that during latest Rhaetian time the terrestrial vegetation on both the northern and southern hemispheres was affected by environmental changes which led to taxonomic losses and the re-organization of the flora in all areas. Palynostratigraphic correlations between the different sites, supported by independent invertebrate fossil events (when present), show that the extinction and recovery phases occurred prior to the TJB. Extirpation/extinction of typical Rhaetian taxa generally follows a pattern of major decline in abundance during the extinction phase, followed by rare continued occurrences (lingering) during the recovery phase and sometimes even into the post-extinction phase. From a palynological point of view it can be difficult to assess whether these lingering occurrences are in situ or reworked.
Most of the typical Rhaetian or Triassic spore and pollen taxa that go extinct during the ETE are so far not known from in situ occurrences in reproductive structures of fossil plant taxa. The highest taxonomic turnover is registered in the N Carnarvon Basin, where 73% of the Rhaetian taxa disappear at the top of the extinction interval. Sverdrup Basin and Stenlille also exhibit high turnovers, with 38–52% and 47% of the Rhaetian taxa disappearing in each area, respectively.
The Rhaetian pre-extinction palynofloras of all sites appear to have been relatively stable. The northern hemisphere sites were dominated by either the enigmatic gymnosperm tetrad Ricciisporites tuberculatus, cupressacean/taxodiacean (Perinopollenites elatoides) pollen and/or cheirolepidiacean conifer pollen (Granuloperculatipollis, Classopollis). Total relative spore abundances indicate drier environments in the low-latitude sites (Kuhjoch, St Audrie's Bay), while spore abundances appear to increase further north and south. The relative abundances of cheirolepid conifer pollen seem to corroborate this pattern, although they are during the pre-extinction phase only abundant in the northern hemisphere, where they are most abundant in the low-latitudinal sites (Kuhjoch and St Audrie's Bay) and seem to decrease in abundance towards the north. Ricciisporites tuberculatus appears to be confined to the northern hemisphere and more or less to the mid-latitudinal belt. In the southern hemisphere, the pre-extinction palynofloras were dominated by corystosperm pollen and lycophyte and/or bryophyte spores. The xerophytic corystosperms are most abundant in the N Carnarvon Basin, while lycophyte spores increase in abundance towards the south.
The extinction phase is characterized at all sites by major to moderate structural changes in the palynofloral composition. From an ecological perspective, the palynofloral changes at the Sverdrup Basin, Stenlille, Kuhjoch and Carnarvon Basin, are classified as ecological severity Category I of McGhee et al. (Reference McGhee, Sheehan, Bottjer and Droser2004). At these sites the pre- and post-extinction palynofloras are fundamentally different in composition and dominance, and major losses of palynofloral elements from the pre-extinction palynoflora occurred. The remaining sites are placed in Subcategory IIa of McGhee et al. (Reference McGhee, Sheehan, Bottjer and Droser2004), because their pre-extinction ecosystems are disrupted, and although this produced permanent losses of major ecosystem components, the ecosystems recover and are not replaced post-extinction. The eastern Australian and New Zealand sites are considered least affected by the ETE.
Increased total abundances of spores on both hemispheres during the extinction and recovery intervals may indicate that environmental and/or climatic conditions became less favourable for seed plants, as suggested by van de Schootbrugge et al. (Reference van de Schootbrugge, Quan, Lindström, Püttmann, Heunisch, Pross, Fiebig, Petschick, Röhling, Richoz, Rosenthal and Falkowski2009), resulting in proliferation of spore-producing plants in all areas. High abundances of spores often continue during the recovery phase. This may reflect wetter conditions at all sites during the extinction and recovery phases. Alternatively, such conditions may include expected effects of CAMP volcanism such as acid rain, terrestrial soil and freshwater acidification due to volcanic sulfur dioxide emissions, fluctuating ultraviolet flux due to ozone depletion caused by halogens and halocarbon compounds, and drastic changes in climatic conditions due to greenhouse gas emissions.
The terrestrial ecosystem appears to have recovered by late Hettangian time in all areas, with the return of common to abundant woody plants. Although cheirolepid conifers suffered during the ETE, with at least two pollen taxa disappearing (Granuloperculatipollis rudis, Geopollis zwolinskae), they became important components of Early Jurassic palynofloras both on the northern and southern hemispheres.
In conclusion, this review indicates that the terrestrial vegetation was affected on a global scale during the end-Triassic event, but further studies are needed. Future research on the causes and effects of the end-Triassic event, and the response of the terrestrial vegetation, would benefit from complementary and additional high-resolution palynological studies from TJB sites globally.
Acknowledgements
This paper is dedicated to Anthony Hallam for his awe inspiring research on the end-Permian and end-Triassic mass extinctions. This study is part of a project funded by Geocenter Denmark (project 6–2013). The author publishes with permission of the director of the Geological Survey of Denmark and Greenland. The Mineral Research Institute of Western Australia (MRIWA), John Backhouse and Basil Balme, are all gratefully acknowledged for permission to publish photographs from Backhouse and Balme (Reference Backhouse and Balme2002); MERIWA Report 226 (Project M313), and the Geological Survey of Queensland, State of Queensland, John McKellar and Noel De Jersey are all greatfully acknowledged for permission to reproduce photographs from De Jersey and McKellar (Reference De Jersey and McKellar2013). Jette Halskov produced the line drawings. The author is grateful to the reviewers.



