Introduction
High-energy mechanical alloying is known to induce forced chemical mixing of immiscible systems. It has been described that mixing in such systems takes place through the ballistic relocation of atoms with individual species flowing along concentration gradients. In turn, this results in various degrees of homogenization, determined by the equilibrium tendency of the particular system to phase separate, a measure of which is given by the magnitude of the equimolar enthalpy of mixing (ΔH M) between the respective elements.[Reference Wang, Vo, Campion, Nguyen, Setman, Dillon, Bellon and Averback1, Reference Arshad, Lach, Pouryazdan, Hahn, Bellon, Dillon and Averback2] Based on this parameter, Cu-based systems can be partitioned into two main subgroups, those which exhibit lower equimolar enthalpies of mixing (ΔH M) values (i.e., Cu–Ag and Cu–Co), and those such as Cu–Mo, Cu–W, Cu–Ta, or Cu–Nb, which exhibit higher values.[Reference Wang, Averback, Bellon and Dillon3] While lower enthalpy of mixing systems (ΔH M < 10 kJ/mol) can be forced into larger ranges of solubilities,[Reference Klassen, Herr and Averback4, Reference Gente, Oehring and Bormann5] systems exhibiting higher values (Cu–W, Cu–Mo, Cu–Ta, and Cu–Nb)[Reference Atwater, Roy, Darling, Butler, Scattergood and Koch6–Reference Darling, Roberts, Mishin, Mathaudhu and Kecskes9] remain as either two discrete phases or exhibit a limited degree of alloy formation. As such, the latter systems, with incomplete mixing, represent thermodynamically far-from-equilibrium or metastable states which are ideal material candidates for atomic species partitioning studies. Although understanding species partitioning in such systems is scientifically interesting, the thermal evolution of such alloys has greater practical significance. For example, in the Cu-based systems, i.e., Cu–Nb or Cu–Ta, manipulation of the metastable state can lead to highly unusual properties.[Reference Darling, Roberts, Mishin, Mathaudhu and Kecskes9, Reference Özerinç, Tai, Vo, Bellon, Averback and King10] Recently, evidence of very high strength levels in a mechanically alloyed Cu–Ta alloy has been observed,[Reference Darling, Tschopp, Guduru, Yin, Wei and Kecskes11] which could not be explained by grain size strengthening alone. In part, this was attributed to the decomposition of the Cu-rich Cu–Ta solid solution matrix, forming a high-density nanoscale Ta precipitate dispersion, resulting in an extremely stable composite structure. The presence of these Ta precipitates resulted in strength levels approximately two times those predicted by Hall–Petch hardening alone.[Reference Darling, Tschopp, Guduru, Yin, Wei and Kecskes11]
The implications of such findings are that the controlled decomposition of forced solid solutions between immiscible elements to produce nanostructured materials is a highly effective way to increase the strength of a material well above conventional means provided by grain-size reduction. Decoupling different strengthening mechanisms may effectively provide greater means to control well-known trade-offs between strength and ductility exhibited by nanocrystalline metals. As such, the primary objectives of this effort were to first to understand, and then delineate the decomposition process of the as-milled solid solution as a function of temperature of the Cu–10 at.% Ta composite, mentioned in Ref. Reference Darling, Tschopp, Guduru, Yin, Wei and Kecskes11. This was accomplished by subjecting the as-milled powder to annealing treatments at 450 and 700 °C. In addition to differential thermal analysis of the as-milled powder, the formation and spatial redistribution of the Ta solute atoms were investigated by atom probe tomography (APT) technique.
Experimental procedures
High-energy cryogenic mechanical alloying was used to synthesize a Cu–10 at.% Ta powder. The appropriate amounts of Cu and Ta powders (−325 mesh, 99.9% purity) with a total weight of 5 g were loaded into hardened steel vials along with the milling media (440C stainless steel balls) with a ball-to-powder ratio of 10-to-1 by weight, and then sealed inside a glove box in Ar atmosphere. Milling was carried out in a modified SPEX 8000M shaker mill using 440C stainless steel balls at −196 °C for 8 h.[Reference Darling, Tschopp, Guduru, Yin, Wei and Kecskes11] After completion of the milling cycle, the vials were opened inside the glove box and the powders were stored therein. This process was repeated until a total powder charge of 100 g was attained. Cryogenic mechanical milling resulted in an unagglomerated powder mass with a particulate size range of 20–100 μm. Contamination from the milling media was noted; however, these elements were excluded from subsequent analysis. Small tablets were made by uniaxial pressing the as-milled powder at 3.5 GPa in a 3 mm diameter tungsten carbide die. Some of these compacted samples were later annealed at 450 °C for 1 h. In addition to 450 °C annealed samples, some of the as-milled powder was consolidated at 700 °C using high-temperature equal channel angular extrusion (ECAE). For the ECAE consolidation experiments, the as-milled powders were placed into nickel cans and sealed inside the glove box. Prior to ECAE, the die assembly was heated to 350 °C. The nickel cans loaded with as-milled powders were equilibrated (for 40 min) in a box furnace purged with pure Ar gas at 700 °C, respectively. The equilibrated cans were then quickly removed from the furnace, dropped into the ECAE tooling and extruded at an extrusion rate of 25.5 mm/s. This procedure was repeated four times following route B c.[Reference Furukawa, Horita, Nemoto and Langdon12–Reference Segal14] The ECAE tooling had a channel angle of 90°. The four consecutive extrusions resulted in a total strain of ~450%. The extruded can was then serial sectioned and the cut surfaces polished to a mirror finish. Differential scanning calorimetry (DSC) experiments were performed in a Netzsch STA 409C differential thermal analyzer equipped with a TASC 414/3 controller. High-energy ball milling is known to introduce Fe contamination, under the conditions reported here.[Reference Darling, Roberts, Mishin, Mathaudhu and Kecskes9] Therefore, special precautions were taken to reduce the level of Fe as to minimize the influence of this particular contamination.[Reference Darling, Roberts, Mishin, Mathaudhu and Kecskes9] Atom probe results reveal overall concentration of Fe in the samples to be low (0.05–1 at.%). This level of contamination is not expected to influence the overall microstructural evolution.[Reference Darling, Roberts, Mishin, Mathaudhu and Kecskes9] The level of oxygen contamination was found to be similar in magnitude.
Samples for APT were prepared using the FEI Nova200™ dual-beam focused ion beam system. Lift-outs were cut to generate eight atom tips for each dataset. After an annular milling process, the final tip diameter of the atom probe specimens was 50–70 nm. The APT experiments were conducted using a CAMECA LEAP 3000X™ HR instrument; all experiments were carried out in the pulsed-laser evaporation mode at a specimen temperature of 45 K with a laser pulse energy of 0.3 nJ and target evaporation rate of 0.5%. Visualization and quantitative evaluation of the APT datasets were carried out using a CAMECA IVAS 3.6.6™ software. The size of the APT reconstructions analyzed was at least 40 × 40 × 80 nm3. At least three individual samples from each condition were analyzed and the microstructures were found to be consistent. Furthermore, based on a prior survey of the microstructure, the reconstructions, shown in this study, were ensured to be representative of the sample.
Results and discussion
Cryogenic milling produced a nanocrystalline, two-phase Cu–10 at.% Ta composite of spheroidal Ta particles and nanolamellar Ta structures dispersed in a Cu-rich matrix. X-ray diffraction (XRD) analysis and corresponding Scherrer estimates of the size of each of the respective phases, suggested that the volume average grain size of the Cu-rich matrix and that of the residual Ta particles were 6.7 and 6.0 nm, respectively. However, larger isolated Ta particles were also observed during transmission electron microscopy (TEM) and scanning electron microscopy (SEM) imaging of samples prepared from powder particles. Supplemental Fig. S1 shows bright field (a) and dark field (b) TEM micrographs and grain size distribution (c) for the Cu–10 at.% Ta alloy. The grain size estimated from TEM is consistent with the XRD estimates. A brief overview of the microstructural evolution/decomposition of this alloy is provided herein. Earlier results of Darling et al.[Reference Atwater, Roy, Darling, Butler, Scattergood and Koch6, Reference Darling, Roberts, Mishin, Mathaudhu and Kecskes9] reveal the Cu matrix grain and Ta particle size evolution under isothermal annealing conditions at 540, 770, 900, and 1040 °C to be 21, 54, 111, and 166 nm (for Cu) and 22, 37, 43, and 100 nm (for Ta), respectively. The samples consolidated using ECAE underwent an equivalent strain of 4.5 while being exposed to a total annealing time of 2 h and 40 min at 700 °C. During this time interval, TEM revealed the microstructure to consist of Cu grains with Ta dispersions. The mean grain size for the Cu matrix was found to be approximately 70 nm. Additionally, the Ta-particle size distribution was bimodal; the two modes of the distribution were found to be about 40 and 7 nm, respectively. Recently, it was reported that severe straining of precipitated Cu–Nb composites, using high-pressure torsion at room temperature, resulted in a self-organized microstructure, wherein the Nb the particle size distribution underwent a refining process to form a narrower normal distribution. In the case of the Cu–Ta alloy, the ECAE processing at 700 °C did not result in a normal size distribution[Reference Darling, Tschopp, Guduru, Yin, Wei and Kecskes11]; furthermore, the Ta particle size appears to be consistent with those of the isothermal annealing experiments at similar temperatures.[Reference Atwater, Roy, Darling, Butler, Scattergood and Koch6–Reference Darling, Roberts, Mishin, Mathaudhu and Kecskes9]
To establish the decomposition process as function of temperature, DSC data were utilized to identify the width of the associated exothermic process. Fig. 1(a) shows broad exothermic events at 450 and 700 °C, which correspond to the end of the first and second main peaks. The total calculated heat release associated with the peaks is 8.7 J/g, or 0.553 kJ/mol, which was calculated by integrating the DSC signal versus time for the exothermic event. This heat release due to the exothermic event and the relationship to grain growth and decomposition were reported in.[Reference Darling, Roberts, Mishin, Mathaudhu and Kecskes9] Therefore, APT was performed for three conditions: as-milled, and annealed at 450 °C and samples processed via ECAE at 700 °C, respectively.
(a) DSC curve showing exothermic reactions corresponding to grain growth of Cu. Solid solution of Ta within Cu matrix observed in the (b) as-milled, (c) 450 °C annealed, and (d) 700 °C annealed samples.

Figures 1(b)–1(d) display the atom probe reconstructions of the Ta solute atoms (shown in black) in solid solution with Cu matrix atoms (shown in orange) for the as-milled, 450 and 700 °C annealed samples, respectively. A more rigorous statistical analysis for the Ta solid solution concentration in the Cu matrix was investigated using cluster search algorithm; the results are shown in Table I. Details of the cluster search algorithm will be discussed hereafter. It was found that the as-milled sample [Fig. 1(b)] contained the highest number density of dissolved Ta atoms. This is clear proof that the milling is capable of forcing Ta atoms into a random solid solution with Cu, regardless the strong tendency to remain immiscible in the equilibrium state.[Reference Wang, Averback, Bellon and Dillon3] In contrast, with annealing at 450 °C, this saturated solid solution decomposes and the majority of the dissolved Ta atoms are lost [Fig. 1(c)]. As the solid solution is exposed to higher temperatures [700 °C, Fig. 1(d)], the relative number of dissolved Ta atoms is further decreased. The removal of a large number of oversized solute atoms from the Cu lattice and its contraction, and associated loss of strain energy should result in a significant heat release from the system corresponding to the first main exothermic event ending at ~450 °C. To complement this data, XRD analysis was performed on the first Cu Bragg reflection for samples isothermally annealed at sequentially increasing temperatures. Figure 2 shows that with increasing temperature, a simultaneous shift to higher 2θ angles and a narrowing of the (111) peak occurs, corresponding to the contraction of the Cu lattice due to the loss of dissolved Ta solute atoms and overall coarsening of the grain size. Above 500 °C, the microstructure continues to coarsen, but there is negligible lattice contraction. Thus, it can be concluded that this thermal decomposition, coupled with the elimination of grain boundary area (i.e., grain growth), manifests itself as the first exothermic DSC event ending at 450 °C. Combined with the APT observations, this data also confirms that substitutional Ta atoms are removed from the Cu lattice and, as will be described hereafter, likely diffuse along grain boundaries to facilitate coarsening of existing Ta clusters.
XRD plot showing Cu peak shift as a function of annealing temperature.
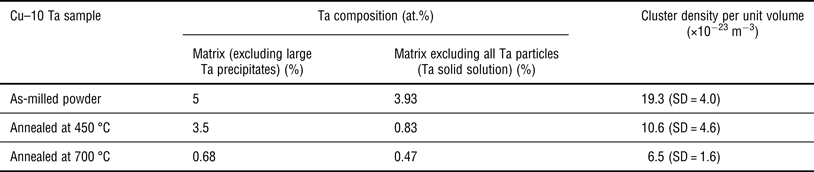
Ta concentration (at.%) and cluster density in the as-milled, 450 °C annealed, and 700 °C annealed samples .
Cluster analyses of the APT datasets verified the existence of very fine Ta particles within the Cu grains. That is, a fraction of the solid solution was found to display local Ta clustering. Figures 3(a)–3(c) are three-dimensional atom probe reconstructions of Ta clusters formed as a result of the milling process, and after isothermal annealing at 450 or 700 °C; (atoms are color coded as previously shown). The Cu matrix was analyzed using a maximum separation algorithm for cluster identification,[Reference Miller15–Reference Kolli, Seidman, Al-Kassab, Christian, de Geuser, Lefebvre, Blavette, Fultz, Howe and Goodman17] available within the framework of the IVAS 3.6.6 software. This search was first conducted on precipitates enriched in Ta. Ta ions were grouped together within a maximum (first nearest neighbor) separation distance of 0.62–0.92 nm (d max); a group of Ta ions with more than 23–62 ions (N min) was considered as a cluster. All Cu ions within an envelope distance (L) of 0.31–0.46 nm of these Ta ions were included as part of that cluster. However, any ion located at a distance greater than 0.31–0.46 nm (d erosion) of any other ion along the perimeter of this designated cluster was excluded from the cluster.
APT reconstructions showing Ta-enriched clusters observed in the Cu matrix from the (a) as-milled, (b) 450 °C annealed, (c) 700 °C annealed samples, and (d) the respective cumulative distribution functions for all three samples.
As seen in Figs. 3(a)–3(c), the Ta clusters identified from the APT analysis of the three sample types are similar in size and morphology. The Ta cluster size distributions in the Cu matrix for the atom probe experiments are presented in Fig. 3(d) and plotted as a cumulative distribution function. For statistical analysis, 233, 427, and 281 Ta clusters in the as-milled, 450 °C annealed, and 700 °C annealed samples were used to calculate the average cluster's size and composition, and a cumulative distribution function. The cluster size was adjusted to affect the true particle size due to local magnification effects using density-corrected composition profiles. The details of the corrections will be discussed in conjunction with the composition profile analysis. The average Ta cluster size of the as-milled, 450 °C annealed, and 700 °C annealed samples were 2.0 nm (SD = 1.07), 2.6 nm (SD = 1.27), and 1.6 nm (SD = 1.18), respectively. The distribution plots suggest that these Ta clusters, residing in the Cu grains, resist coarsening despite being exposed to high-temperature annealing. While the Ta cluster size distribution appears to be temperature independent, the number density of Ta clusters is not. Namely, the number density of Ta clusters was found to decrease from 19.3 × 10⁻²³ m−3 in the as-milled case to 10.6 × 10⁻²³ m−3 at 450 °C, and to 6.5 × 10⁻²³ m−3 at 700 °C, respectively (Table I).
Despite reducing the Ta cluster density by 66%, the remaining clusters are extremely well dispersed and on par with those observed in the most advanced nanostructured oxide dispersed strengthened ferritic alloys studied today.[Reference Alinger, Odette and Hoelzer18, Reference Miller, Parish and Li19] That is, such control of the dispersion, number, and size of these clusters lends itself to a potent age or precipitation hardening mechanism. Because dislocations are expected to interact with these clusters and precipitates in the same manner as with other obstacles that cause strengthening, it is believed that the presence of the small Ta clusters are largely responsible for the high-yield strength which is above and beyond that provided by grain size strengthening alone in these nanocrystalline Cu–Ta alloys.[Reference Darling, Tschopp, Guduru, Yin, Wei and Kecskes11] Moreover, while the cluster density decreases with temperature, lower magnification APT reconstructions reveal an increased volume fraction of larger Ta particles existing alongside the smaller Ta clusters. This observation supports earlier claims that the decomposition process, leads to the coarsening of existing Ta particles and clusters.
APT reconstructions from the as-milled and annealed at 450 and 700 °C samples reveal these larger Ta particles (see Fig. 4). These Ta particles were demarcated using a 5 at.% Ta isoconcentration surface (isosurface). The APT reconstruction of the as-milled sample [Fig. 4(a)] shows a random distribution of larger Ta particle sizes (shown in solid purple) within the Cu matrix (shown in orange). These spheroidal Ta particles have a size ranging from 5 to 20 nm. The annealing of the as-milled powder at 450 °C for 1 h [Fig. 4(b)] results in a higher density of these larger Ta particles within the Cu matrix. Compared with the 450 °C annealed sample, isothermal annealing at 700 °C during the ECAE consolidation process [Fig. 4(c)] results in further particle coarsening and a commensurate decrease in the particle number density. Generally, the larger Ta particles in the 700 °C annealed sample were observed to decorate the Cu grain boundaries [shown in Fig. 4(c) by the black dotted line] in contrast to smaller clusters which reside in the lattice. This reconstruction clearly shows a grain boundary decorated with larger Ta particles/clusters. Observations provide evidence that support the presence of segregated Ta solute and a preferential coarsening of grain boundary precipitates. This is consistent with recent TEM results of Darling et al.[Reference Darling, Tschopp, Guduru, Yin, Wei and Kecskes11]
APT reconstructions of (a) as-milled, (b) 450 °C annealed, and (c) 700 °C annealed samples showing large Ta particles in Cu matrix.
Previously, the authors delineated the magnitude of the various competing strengthening mechanisms operating in this particular alloy, specifically the sample ECAE processed at 700 °C.[Reference Darling, Tschopp, Guduru, Yin, Wei and Kecskes11] It was estimated that the combined rule of mixtures hardening, (larger Ta particles at grain boundaries) and Hall–Petch hardening (reduced grain size) represented only 46% of the 3.75 GPa hardness or (1.1 GPa compressive yield strength). The rest was attributed to a significant unaccounted residual strengthening effect present in the samples. It was hypothesized that this residual strengthening arose from a significant volume fraction of small Ta particles (diameter less than < 10 nm) and Ta clusters. Orowan strengthening was eliminated as this effect is often much smaller in magnitude than the strengthening due to the Hall–Petch effect at the smallest grain sizes. Additionally, the absence of both the appropriate matrix particle size required for Orowan strengthening and any strain hardening in mechanically tested samples provide evidence that, if any, Orowan strengthening had a marginal role in accounting for the increased strength of the nanocrystalline Cu–Ta alloy. Furthermore, it was reasoned that the samples ECAE processed at 700 °C would have little, if any, retained solid solution strengthening. Therefore, the additional strengthening in the Cu–Ta alloy must come from other sources, e.g., grain boundary strengthening from Ta solutes, small-scale coherent Ta particles and clusters, and composite effects related to the interaction of Ta with other strengthening mechanisms. The APT results reported here support the idea that Ta clusters and their temperature-dependent evolution play an important role in strengthening the Cu–Ta alloys.
Since it is expected that the smaller Ta clusters dramatically increase the material strength, understanding their chemistry, i.e., how the global Ta solute concentration partitions as a function of particle size is of significance. Therefore, one-dimensional (1D) cylindrical composition profiles, consisting of large Ta particles and smaller Ta clusters present within the as-milled and 700 °C annealed samples, were created to ascertain these differences and is shown in Fig. 5. Owing to a large difference in atomic density between Cu- and Ta-rich regions in the atom probe reconstructions, artifacts such as aberrations of ion trajectories and local magnification are likely to occur.[Reference Vurpillot, Bostel and Blavette20–Reference Sauvage, Renaud, Deconihout, Blavette, Ping and Hono23] These artifacts influence true particle size and the composition in their vicinities.[Reference Vurpillot, Bostel and Blavette20, Reference Vurpillot, Cerezo, Blavette and Larson21] For example, in the Cu–Ta system, if a protrusion at the tip surface develops, a higher magnification and lower atomic density within the high evaporation field can result, especially for Ta particles, ε B = 1.47 (44/30).[Reference Vurpillot, Cerezo, Blavette and Larson21] Therefore, the apparent sizes of large and small Ta particles (20 and 4 nm, respectively), used to determine the composition profiles in Fig. 5, were overestimated. Previously, Sauvage et al.[Reference Sauvage, Renaud, Deconihout, Blavette, Ping and Hono23] proposed that the local magnification has a linear relationship with the atomic density. However, lateral coordinates and atomic density are influenced as the square of the magnification. So, Gault et al.[Reference Gault, De Geuser, Bourgeois, Gabble, Ringer and Muddle22] later proposed that the distance units, in composition profiles containing n bins, need to be adjusted proportionally to the square root of the atomic density. Thus, the corrected distance, x i, can be adjusted as,  ${x_i} = \; {x_{{\rm max}}}\; \times \; \left( {\mathop \sum \nolimits_{\,j = 1}^i \sqrt {{d_j}} /\mathop \sum \nolimits_{\,j = 1}^n \sqrt {{d_j}}} \right)$, where x max is the maximum distance in the composition profile and d j is the atomic density at the jth bin.
Ta particles delineated using 5 at.% Ta isosurface and the corresponding 1D composition profiles of (a) a large Ta particle, (b) a Ta cluster from the as-milled sample, and (c) a Ta cluster from the 700 °C annealed sample.
Two methodologies were adopted to correct the composition profiles. Sauvage's method resulted in a linear shift of the composition profile; however, the particles’ size in Figs. 5(b) and 5(c) did not change (not shown). Density-corrected composition profiles using Gault's method (dotted lines) are shown in Fig. 5, along with the uncorrected (raw) composition profiles (solid lines). The error bars for these profiles were omitted for clarity. Note that the precipitate size, obtained from the density-corrected composition profile, is an estimate and can be used for a qualitative comparison between each condition. With Gault's corrections, the size of the small Ta clusters in the as-milled and annealed at 700 °C, respectively, decreased from 2.7 to 1.4 nm, and 3.4 to 1.5 nm. A significant level of mixing of Cu in the Ta particles is present in both the as-milled and annealed samples. For the as-milled condition, the large Ta particle [Fig. 5(a)] has an interior Ta concentration of ~92% and the nearby small Ta cluster [Fig. 5(b)] has an interior Ta concentration of ~60%. Annealing at either 450 or 700 °C results in a similar compositional trend for the larger Ta particles and smaller Ta clusters as that observed in the as-milled sample. For instance, the resultant composition of a Ta cluster after 700 °C annealing [Fig. 5(c)] is comparable with that in the as-milled sample [Fig. 5(b)]. Compositions of Ta clusters are also consistent with the average composition of other calculated particles/clusters (~60%–65%). The as-measured level of Cu in Ta particles and clusters is significant (~8% and ~40%, respectively), as it exceeds the equilibrium solubility of Cu in Ta or Ta in Cu, which is nominally negligible.[Reference Massalski, Okamoto, Subramanian and Kacprzak24] This effect occurs due to mechanical alloying-induced forced chemical mixing of an immiscible system.
These observations shed light on how the global Ta content in the composite partitions. That is, our measurements show that Ta either resides in the solid solution within the Cu matrix grains or is dispersed as Ta clusters and/or larger scale particles; the relative fraction depends on temperature. The composition of the Cu-rich matrix at each stage was calculated by exporting the isosurface and cluster identification analyses. Table I summarizes these effects. The nominal Ta concentration for all samples was confirmed by SEM–energy dispersive spectroscopy (EDS) to be 10 at.% Ta (not shown here). The Cu matrix, in the as-milled state, contains 5.0 % Ta after removing large Ta particles (>5 nm in diameter) from the analysis. As the temperature increases, the Ta matrix solute concentration in the Cu matrix drops to 3.5% and 0.68%, in the 450 °C annealed and 700 °C annealed samples, respectively. This decrease is directly related to the growing volume fraction of larger particles. Similarly, the residual solid solution Ta content (with all Ta clusters and particles excluded from analysis) also decreases from 3.93% in the as-milled state to 0.83% after 450 °C annealing, and 0.47% after 700 °C, respectively. The coupling of these effects can be explained as follows. In the as-milled case, Cu–Ta samples show a dispersion of Ta particles including large Ta particles and Ta clusters, in addition to the formation of a substantially supersaturated Ta solid solution. During high-temperature annealing, the as-milled alloy undergoes decomposition/phase separation and coarsening/grain growth. It was observed that the Ta concentration in the solid solution as well as the number density per unit volume of Ta clusters decrease with increasing annealing temperature. This is explained by the very strong driving force to reject Ta atoms from the Cu lattice, largely determined by the Ta equilibrium solid solubility limit, ΔH M, and large size mismatch between the Ta and Cu atomic radii. At the same time, the limited lattice diffusivity of Ta within the Cu grains[Reference Frolov, Darling, Kecskes and Mishin25] prohibits coarsening or change of chemistry of the Ta clusters that are trapped in the Cu lattice. Therefore, it is likely that only Ta particles, located at or near grain boundaries, can further coarsen as a result of fast grain boundary diffusion of Ta supplied by this decomposition process or Oswald ripening along the grain boundaries.
Conclusion
We have shown that the nanocrystalline Cu–Ta alloy exhibits a large grain boundary volume, with a large fraction of the Ta particles residing at these boundaries, either as a consequence of milling or because of arrested growth during particle-pinning interactions. It is this volume fraction of particles which grows preferentially, reducing the number density per unit volume of Ta clusters available for strengthening. Aside from the observed thermally activated coarsening, the retained fraction of Ta clusters in the Cu matrix remains extremely high. In turn, the combination of these clusters and the dissolved Ta solute concentration in the Cu matrix provides the observed highly efficient temperature-dependent precipitation strengthening mechanism of this material. Though outside the scope of this work, the data included in this report provides the means to begin and establish the basis for a computational modeling approach that can decouple the individual strengthening mechanisms governing the unprecedented strengths attained in this family of nanocrystalline Cu–Ta alloys.
Supplementary materials
For supplementary material for this article, please visit http://dx.doi.org/10.1557/mrc.2015.34
Acknowledgment
The authors would like to thanks to Baptiste Gault for his comments on local magnification effects.