At room temperature, rare earth oxides (Re2O3) are found in three structures: hexagonal, monoclinic, and cubic, denoted by GoldschmidtReference Goldschmidt, Ulrich and Barth1 as A, B, and C. The A type (P3m1) is common for large rare earths. Above 2000 °C, sesquioxides of La to Gd exhibit reversible transformations to hexagonal (P63/mmc) and cubic phases (Im3m), denotedReference Aldebert and Traverse2, Reference Foex and Traverse3 as H and X. Temperatures of phase transitions and melting of lanthanum oxide (La2O3) are known,Reference Coutures and Rand4–Reference Zinkevich5 but no measurements of enthalpies of these transitions have been reported. We report on the first determination of enthalpies of A–H and H–X polymorphic transitions and fusion of La2O3 performed using a Setsys 2400 thermal analyzer (Setaram Instrumentation, Caluire, France). This instrument is equipped with a graphite furnace and vitreous carbon protective tube. The heat flow sensor consists of a tungsten plate with cavities for sample and reference crucibles (Fig. 1). The plate hangs from the arm of microbalance on thermocouple wires. Two junctions of WRe26% wires with the sides of the sensor plate form W/WRe26 thermocouples, which generate a differential heat flow signal. The central WRe5% wire serves as a main rigid support for the sensor plate and forms the sample thermocouple with WRe26% wire wound around it close to the sensor plate. As all connections in this design are mechanical, the baseline quality and longevity of the sensor is highly dependent on the assembly process, and special care was taken to make sure that all the connections were rigid.
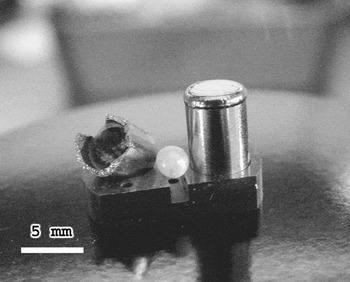
Laser-melted La2O3 sphere, welded tungsten crucible with La2O3 sample, and transparent solidified La2O3 sample after melting in thermal analyzer. The crucibles and samples are positioned on the tungsten sensor plate. Photograph is taken through the glovebox window.

Calibration with Al2O3 melting was repeated before and after every sample was run to account for aging of thermocouples. Validity of thermocouple temperature calibration up to 2350 °C was tested by fitting a viewport to the bottom of the furnace and monitoring the temperature at the bottom of the sample holder with an IR2P two-color ratio pyrometer (Omega Engineering, Stamford, CT). The difference between the pyrometer reading and the sample thermocouple reading was found to be constant within ±5 °C.
The first experiments on La2O3 were performed in He flow with unsealed tungsten crucibles. It was found that the melting temperature was significantly lower on average (2240 ± 40 °C) than the earlier reportedReference Coutures and Rand4 value (2305 ± 15 °C) and varied more from run-to-run than could be explained by instrumental uncertainties. It was also observed that the La2O3 sample after melting in an unsealed crucible became black in color, likely because of the reaction with carbon from the vitreous carbon furnace protection tube.
To prevent carbon contamination, experiments were repeated with three new samples sealed in tungsten crucibles. La2O3 (Reacton 99.999, Alfa Aesar, Ward Hill, MA) was melted in air with 100 W CO2 laser. This was performed to eliminate volatiles absorbed and to avoid any powder present on the rim of the crucible during welding. When melted with a laser beam in a copper hearth, La2O3 formed spheres of 2–3 mm in diameter (Fig. 1). Immediately after melting and solidification, the beads were transferred into an Ar-filled glovebox with <1 ppm level of moisture to prevent the reaction of La2O3 with water and CO2. The tungsten crucibles were sealed using a semiautomatic welding chamber constructed using a Miller Maxstar 150 STH welder (Miller, Appleton, WI). The crucible with sample and lid were transferred from the glovebox into the Ar-filled welding chamber and placed in the copper holder mounted on top of a variable-speed electric motor. The welder was operated at 80 A in pulsing tungsten inert gas mode using ∼7 L/min argon flow through the torch with impulse high-frequency arc starting. After the arc was started and melting pool formed, the welding was completed in a single pass of less than 10 sec. Because of the high welding temperature of tungsten (above 3390 °C), the pressure of argon in the crucible is below 1 bar for the temperature range of thermal analysis. On breaking the sealed crucible after experiment (Fig. 1), the sample was found to be transparent and no discoloration was observed on visual examination of the areas crystallized in contact with tungsten.
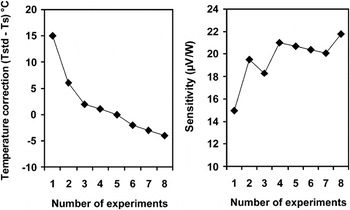
Alumina for calibration was prepared using the same procedure but without using a glovebox. A sealed empty crucible was used as a reference. All experiments were performed at heating and cooling rates of 10 °C/min at an Ar flow of 20 mL/min. A test calibration performed with both sealed and unsealed alumina revealed a difference in calibration factor of no more than 1.5% between them, which is on the order of uncertainty from baseline correction. Changes in temperature and sensitivity calibrations for the sensor used with La2O3 samples are plotted in Fig. 2. The trends of increasing apparent temperature and sensitivity due to thermocouple aging and diffusion in mechanical thermocouple junctions are typical for these sensors.
Temperature and sensitivity calibration of heat flow sensor with melting of Al2O3 standard (T m = 2054 °C, ΔH fus = 1092 J/g).Reference Coutures and Rand4

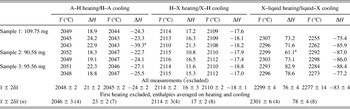
Three melting experiments were performed on the first sample (first melting was not recorded) and two melting experiments were performed on the second and third samples. Above 2000 °C, heat flow baselines varied substantially from experiment to experiment and were fitted individually for every heating and cooling segment. Baseline subtraction and peak integration were performed with Calisto software (AKTS, Siders, Switzerland). Two individual enthalpy values (marked in Table I) varied by more than three standard deviations from the average, likely because of baseline fluctuations, and were excluded from further analysis. Following common practice for calibration, temperature and enthalpy values before the first melting were not used for calculations of final values. Enthalpies of phase transitions were calculated as an average of values measured on heating and cooling. Uncertainties reported in Table I are two standard deviations of the mean and show good reproducibility. Because of limitations of single-point calibration of temperature and sensitivity, we assign higher uncertainties to our final recommended values (Table II).
Phase transition and fusion temperatures and enthalpies (kJ/mol) of La2O3 measured by scanning calorimetry on samples sealed in Ar in tungsten crucibles.

Temperatures and enthalpies of La2O3 polymorphic transitions and melting.

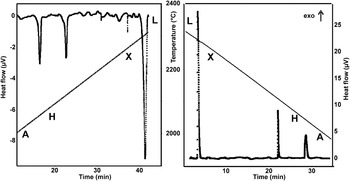
On crystallization of La2O3 melt, ∼20 °C undercooling was observed. Hysteresis for A–H and H–X transitions is within the calibration uncertainties; however, from the shape of heat flow traces (Fig. 3), the X–H transition appears to proceed faster on cooling than on heating, suggesting that ∼4 °C undercooling of X phase might be real. The temperatures for melting and phase transitions in La2O3 from our work are consistent with the reportedReference Coutures and Rand4, Reference Zinkevich5 values (Table II). Our value for fusion enthalpy (78 ± 10 kJ/mol) is in better agreement with the estimate accepted in CALPHAD modeling of the La–O systemReference Grundy, Hallstedt and Gauckler6 than with later evaluationsReference Zinkevich5; however, our enthalpies of A–H and H–X transitions better correspond to Zinkevich’sReference Zinkevich5 estimates.
Heat flow traces of La2O3 on heating and cooling at 10 °C/min with 0.1 sec collection interval (every second data point shown). Sample (90.58 mg) was sealed in tungsten crucible and baseline was subtracted. Peaks correspond to reversible A–H–X solid-state phase transformations followed by melting. The solid lines represent sample temperature.

This report is the first experimental determination of high-temperature phase transition and fusion enthalpies for La2O3. Using the reported methodology, heat flow thermal analyzers with WRe sensors can be used to study phase equilibria above 2000 °C in a number of condensed systems of interest. Sealing the crucible allows one to avoid contamination of the sample and thermocouples and, for less viscous melts, keeps the melt inside the crucible. Availability of temperature and enthalpy standards at the 2100–2400 °C range would increase accuracy of such measurements.
ACKNOWLEDGMENT
This work was supported by the U.S. Department of Energy, Grant DE-FG02-03ER46053.