


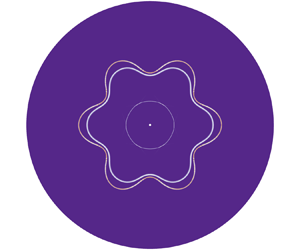


1. Introduction
The hydrodynamic instability of a shock-accelerated finite-thickness fluid layer has great significance in the dynamical characteristics of various phenomena, including inertial confinement fusion (ICF, Betti & Hurricane Reference Betti and Hurricane2016) and supernova explosions (Arnett et al. Reference Arnett, Bahcall, Kirshner and Woosley1989). Specifically, laser-generated shocks in ICF passing through layers of a capsule containing fusion fuel can lead to capsule material mixing into the fuel (Kishony & Shvarts Reference Kishony and Shvarts2001; Abu-Shawareb et al. Reference Abu-Shawareb2022; Wadas et al. Reference Wadas, Khieu, Cearley, LeFevre, Kuranz and Johnsen2023), while shocks generated from rapid energy release in core-collapse supernovae propagate outward through the layers of the collapsing stars, causing heavy core elements to jet into outer layers (Kane, Drake & Remington Reference Kane, Drake and Remington1999; Hester Reference Hester2008; Abarzhi et al. Reference Abarzhi, Bhowmick, Naveh, Pandian, Swisher, Stellingwerf and Arnett2019). Therefore, it is important for scientific and engineering communities to explore the instability evolution of a shock-accelerated finite-thickness fluid layer.
Hydrodynamic instabilities frequently occur on a perturbed interface between two fluids with different densities. They are usually referred to as the Rayleigh–Taylor (RT) instability when the heavy fluid is persistently accelerated by the light one (Rayleigh Reference Rayleigh1883; Taylor Reference Taylor1950), or the Richtmyer–Meshkov (RM) instability when the interface is subjected to an impulsive force typically by a shock wave (Richtmyer Reference Richtmyer1960; Meshkov Reference Meshkov1969). Both instabilities are induced by the baroclinic vorticity produced by the misaligned directions of density and pressure gradients (Zhou et al. Reference Zhou, Clark, Clark, Gail Glendinning, Aaron Skinner, Huntington, Hurricane, Dimits and Remington2019, Reference Zhou2021). These instabilities occurring at a shock-accelerated fluid layer in planar geometry depend not only on the fluid-layer thickness and initial layer shape but also the waves reverberated inside the fluid layer. Specifically, the interface coupling effect illustrating the perturbation feedthrough from one interface to another becomes increasingly evident as the initial fluid-layer thickness decreases (Taylor Reference Taylor1950; Mikaelian Reference Mikaelian1985, Reference Mikaelian1995; Jacobs et al. Reference Jacobs, Klein, Jenkins and Benjamin1993, Reference Jacobs, Jenkins, Klein and Benjamin1995; Mikaelian Reference Mikaelian1996). Also the morphologies of shocked fluid layers are strongly sensitive to the initial layer shape (Jacobs et al. Reference Jacobs, Klein, Jenkins and Benjamin1993, Reference Jacobs, Jenkins, Klein and Benjamin1995), such that proper perturbations initially imposed at the two interfaces can lead to the freeze out of amplitude where the amplitude growth stagnates (Mikaelian Reference Mikaelian1995, Reference Mikaelian1996). In addition, the waves reverberated inside a fluid layer can significantly affect the fluid-layer evolution via the following complicated mechanisms. First, the waves continuously accelerate or decelerate the perturbed interfaces, causing RT destabilization/stabilization effect (Liang et al. Reference Liang, Liu, Zhai, Si and Wen2020; Liang & Luo Reference Liang and Luo2021). Second, the waves passing through the perturbed interfaces lead to sudden decreases/increases of amplitudes, which are called compression/decompression effects of waves (Richtmyer Reference Richtmyer1960; Liang & Luo Reference Liang and Luo2021). Third, additional baroclinic vorticity is deposited on the interface during wave–interface collision to enhance or cancel original vorticity produced by the initial incident shock (Henry de Frahan, Movahed & Johnsen Reference Henry de Frahan, Movahed and Johnsen2015; Liang & Luo Reference Liang and Luo2022b; Chen et al. Reference Chen, Wang, Zhai and Luo2023a,Reference Chen, Xing, Wang, Zhai and Luob). In recent experiments, it was expected that the Atwood number serves as an important factor for interface coupling effect and reverberating waves (Liang & Luo Reference Liang and Luo2022a, Reference Liang and Luo2023). However, the quantitative effect of arbitrary Atwood number on the instability evolution is still not fully understood.
The researches mentioned above have primarily focused on the planar geometry of fluid layers. However, in practical applications such as ICF (Betti & Hurricane Reference Betti and Hurricane2016) and supernovae (Kane et al. Reference Kane, Drake and Remington1999), convergent counterparts are more commonly encountered and are of greater practical interest (Mikaelian Reference Mikaelian1990, Reference Mikaelian2005; Ding et al. Reference Ding, Li, Sun, Zhai and Luo2019; Sun et al. Reference Sun, Ding, Zhai, Si and Luo2020; Li et al. Reference Li, Ding, Luo and Zou2022; Yuan et al. Reference Yuan, Zhao, Liu, Wang, Liu and Lu2023; Zhang et al. Reference Zhang, Ding, Si and Luo2023). The instability evolution of a shock-accelerated cylindrical fluid layer with initial perturbations imposed at outer and inner interfaces was investigated by experiments (Ding et al. Reference Ding, Li, Sun, Zhai and Luo2019; Sun et al. Reference Sun, Ding, Zhai, Si and Luo2020; Li et al. Reference Li, Ding, Luo and Zou2022). These observations have shown that several factors, including RM instability, RT effect, compressibility effect (Bell Reference Bell1951; Epstein Reference Epstein2004), Bell–Plesset (BP) effect (Bell Reference Bell1951; Plesset Reference Plesset1954) and waves reverberated inside the fluid layer, significantly influence the growth characteristics of the perturbations at shocked cylindrical fluid layers. Zhang et al. (Reference Zhang, Liu, Kang, Xiao, Tao, Zhang, Zhang and He2020) modelled the instability evolution of a cylindrical fluid shell in vacuum and found that effects of thin-shell correction and the interface coupling effect are significant to the perturbation growths at thin fluid layers. Recently, Yuan et al. (Reference Yuan, Zhao, Liu, Wang, Liu and Lu2023) identified various contributions to the perturbation growth at a shock-accelerated cylindrical fluid layer, including RM instability, RT effect, compressibility effect, thin-shell correction, interface coupling effect, compression/decompression effects of reverberated waves and BP effect. Yuan et al. (Reference Yuan, Zhao, Liu, Wang, Liu and Lu2023) also proposed an improved model by linear combination of the model of Zhang et al. (Reference Zhang, Liu, Kang, Xiao, Tao, Zhang, Zhang and He2020) and the compressible Bell model (Bell Reference Bell1951; Epstein Reference Epstein2004) describing the single interface to quantify all above contributions. Since the interface coupling effect and thin-shell correction in this improved model are formulated based on the assumption of a cylindrical fluid shell in vacuum, the model is only applicable for a shock-accelerated cylindrical fluid layer with high Atwood numbers. However, the Atwood number in applications has a wide range and its effect on the perturbation growth is critical (Amendt et al. Reference Amendt, Colvin, Tipton, Hinkel, Edwards, Landen, Ramshaw, Suter, Varnum and Watt2002; Betti & Hurricane Reference Betti and Hurricane2016; Abu-Shawareb et al. Reference Abu-Shawareb2022). As a result, the underlying mechanisms of Atwood number effects on instability evolution of a shock-accelerated cylindrical fluid layer remains unclear.
In the present work a model is derived theoretically to predict the instability evolution of a shock-accelerated cylindrical fluid layer with arbitrary Atwood numbers. The verification of the model is accomplished by conducting a comparison with direct numerical simulations (DNS) of three fluid-layer configurations in which the outer and intermediate fluids are kept fixed and the density of the inner fluid is reduced. Via the derived model, the mechanisms underlying the effect of the Atwood number at the inner interface on the perturbation growth are elucidated. The remainder of this paper is organized as follows. The derivation of the model is detailed in § 2. The numerical strategy used to simulate the instability evolution is described in § 3. The model validation and the effect of Atwood number are discussed in § 4. The conclusions are addressed in § 5. Furthermore, two additional verification simulations are provided in the Appendix.
2. Modelling of instability evolution
A linear stability analysis is employed here to derive the model describing the perturbation growth at the inner and outer interfaces of a cylindrical fluid layer. As shown in figure 1, a general cylindrical fluid-layer system where two interfaces separate three arbitrary-density fluids  $j=A$,
 $B$ and
 $C$ at
 $r>r_1$,
 $r_1>r>r_2$ and
 $r< r_2$, respectively, is considered. Here,
 $r_1$ and
 $r_2$ represent the radii of unperturbed outer and inner interfaces, respectively. The flow is assumed as potential and, thus, the velocity of fluid
 $j$ is given as the gradient of the velocity potential
 $\phi _j$. The flow is further assumed as incompressible, such that
 $\phi _j$ can be determined by the solution of the Laplace equation
 \begin{equation} \nabla^2\phi_j=0.\end{equation}
Schematic illustration of a general fluid-layer system including three arbitrary-density fluids  $A$,
 $B$ and
 $C$. Here,
 $r_1$ and
 $r_2$ are the radial locations of unperturbed outer and inner interfaces, respectively.

Similar to Bell (Reference Bell1951) and Zhang et al. (Reference Zhang, Liu, Kang, Xiao, Tao, Zhang, Zhang and He2020), a cosinoidal perturbation is introduced at each interface as
 \begin{equation} r=r_i(t)+\varepsilon\eta_i(t)\cos(n\theta),\end{equation}
where  $\eta _i(t)$ and
 $n$ denote the perturbation amplitude and wavenumber, respectively. Note that
 $\varepsilon$ is only a formal parameter used to keep the order of the perturbations. Subscripts
 $i=1$ and
 $2$ correspond to the quantities at the outer and inner interfaces, respectively. To the first order of
 $\varepsilon$, the velocity potential
 $\phi _j$ can be derived from (2.1) as
 \begin{gather} \phi_A=r_1\dot{r}_1\ln r+\varepsilon a(t)r^{{-}n}\cos(n\theta), \end{gather}
 \begin{gather}\phi_B=r_i\dot{r}_i\ln r+\varepsilon b(t)r^n\cos(n\theta)+\varepsilon c(t)r^{{-}n}\cos(n\theta), \end{gather}
 \begin{gather}\phi_C=r_2\dot{r}_2\ln r+\varepsilon d(t)r^n\cos(n\theta), \end{gather}
where  $a(t)$,
 $b(t)$,
 $c(t)$ and
 $d(t)$ are time-dependent functions and the dots represent time derivatives. Note that
 $i=1$ or
 $2$ in (2.4). Because the flow is assumed to be incompressible, there is
 $r_1\dot r_1=r_2\dot r_2$ (Zhang et al. Reference Zhang, Liu, Kang, Xiao, Tao, Zhang, Zhang and He2020). At the interface (2.2), the kinematic condition representing the continuity of the velocity component normal to the interface (Mikaelian Reference Mikaelian1990, Reference Mikaelian2005) must be satisfied and its linearized formation is as follows:
 \begin{equation} \dot r_i+\varepsilon\dot\eta_i\cos(n\theta)=\frac{\partial \phi_j}{\partial r}. \end{equation}
Here, if  $i=1$ then
 $j=A$ or
 $B$, and if
 $i=2$ then
 $j=B$ or
 $C$. Substituting (2.3)–(2.5) into (2.6) yields the formulas of
 $a(t)$,
 $b(t)$,
 $c(t)$ and
 $d(t)$ as follows:
 \begin{gather} a(t) ={-}\frac{r_1\dot\eta_1+\dot r_1\eta_1}{nr_1^{{-}n}}, \end{gather}
 \begin{gather}b(t) =\frac{\dot\eta_1r_1^{n+1}+\dot r_1r_1^n\eta_1- \dot\eta_2r_2^{n+1}-\dot r_2r_2^n\eta_2}{n(r_1^{2n}-r_2^{2n})}, \end{gather}
 \begin{gather}c(t) =\frac{\dot\eta_2r_2^{{-}n+1}+\dot r_2r_2^{{-}n}\eta_2- \dot\eta_1r_1^{{-}n+1}-\dot r_1r_1^{{-}n}\eta_1}{n(r_1^{{-}2n}-r_2^{{-}2n})}, \end{gather}
 \begin{gather}d(t) =\frac{r_2\dot\eta_2+\dot r_2\eta_2}{nr_2^{n}}. \end{gather}
Furthermore, the pressure of each fluid can be determined by applying the Bernoulli equation for unsteady potential flow. Thus, the dynamic conditions representing the continuity of the pressure at the outer and inner interfaces can be expressed as
 \begin{equation} (1-A_{T,1})\left(\frac{\partial \phi_A}{\partial t}+\frac{1}{2}\boldsymbol{\nabla}\phi_A\boldsymbol{{{\cdot}}}\boldsymbol{\nabla}\phi_A\right)- (1+A_{T,1})\left(\frac{\partial \phi_B}{\partial t}+\frac{1}{2}\boldsymbol{\nabla}\phi_B\boldsymbol{{{\cdot}}}\boldsymbol{\nabla}\phi_B\right)=f_1(t)\end{equation}
and
 \begin{align} (1-A_{T,2})\left(\frac{\partial \phi_B}{\partial t}+\frac{1}{2}\boldsymbol{\nabla}\phi_B\boldsymbol{{{\cdot}}}\boldsymbol{\nabla}\phi_B\right)- (1+A_{T,2})\left(\frac{\partial \phi_C}{\partial t}+\frac{1}{2}\boldsymbol{\nabla}\phi_C\boldsymbol{{{\cdot}}}\boldsymbol{\nabla}\phi_C\right)=f_2(t),\end{align}
respectively, where the Atwood number is defined as  $A_{T,i}=(\rho _{i,in}-\rho _{i,out})/(\rho _{i,in}+\rho _{i,out})$ with
 $\rho _{i,in}$ and
 $\rho _{i,out}$ representing the inner and outer fluid densities of the
 $i$th interface, respectively, and
 $f_1(t)$ and
 $f_2(t)$ are the time-dependent functions. By substituting (2.3) and (2.4) into (2.8) and substituting (2.4) and (2.5) into (2.9), and then equalizing the coefficients of zeroth-order and first-order terms of
 $\varepsilon$ on both sides of (2.8) and (2.9),
 $f_1$,
 $f_2$,
 $\eta _1$ and
 $\eta _2$ can be determined. Specifically,
 $f_1(t)$ and
 $f_2(t)$ are determined by the coefficients of the zeroth-order terms of
 $\varepsilon$ as
 $f_1(t)=-2 A_{T,1}[(\ddot r_1 r_1+\dot r_1^2)\ln r_1+\dot r_1^2/2]$ and
 $f_2(t)=-2 A_{T,2}[(\ddot r_2 r_2+\dot r_2^2)\ln r_2+\dot r_2^2/2]$, respectively. The governing equations for
 $\eta _1$ and
 $\eta _2$ are derived from the coefficients of the first-order terms of
 $\varepsilon$ as
 \begin{align}
&\frac{(\alpha^{2n}+A_{T,1})(\ddot r_1\eta_1+2\dot
r_1\dot\eta_1+r_1\ddot\eta_1)-\alpha^n(1+A_{T,1})(r_2\ddot\eta_2+2\dot
r_2\dot\eta_2+\ddot
r_2\eta_2)}{n(\alpha^{2n}-1)}\nonumber\\ &\quad
+(1+A_{T,1})\nonumber\\ &\qquad\frac{(\alpha^{{-}2}-1)(\alpha^{3n}+\alpha^{n})(\dot
r_2\dot\eta_2+r_2^{{-}1}\dot
r_2^2\eta_2)-(\alpha^{4n}-2\alpha^{2n+2}+1)(\dot
r_1\dot\eta_1+\dot
r_1^2r_1^{{-}1}\eta_1)}{(\alpha^{2n}-1)^2}\nonumber\\
&\quad +A_{T,1}\ddot{r}_1\eta_1+(1+A_{T,1})\dot
r_1\dot\eta_1+(1+A_{T,1})\dot
r_1^2r_1^{{-}1}\eta_1=0
\end{align}
and
 \begin{align}
&\frac{\alpha^{n}(1-A_{T,2})(r_1\ddot\eta_1+2\dot
r_1\dot\eta_1+\ddot r_1\eta_1)-(\alpha^{2n}-A_{T,2})(\ddot
r_2\eta_2+2\dot
r_2\dot\eta_2+r_2\ddot\eta_2)}{n(\alpha^{2n}-1)}\nonumber\\
&\quad
+(1-A_{T,2})\nonumber\\ &\qquad \frac{(\alpha^{3n}+\alpha^{n})(\alpha^{2}-1)(\dot
r_1\dot\eta_1+r_1^{{-}1}\dot
r_1^2\eta_1)-(\alpha^{4n}-2\alpha^{2n-2}+1)(\dot
r_2\dot\eta_2+r_2^{{-}1}\dot
r_2^2\eta_2)}{(\alpha^{2n}-1)^2}\nonumber\\ &\quad
-A_{T,2}\ddot{r}_2\eta_2+(1-A_{T,2})\dot
r_2\dot\eta_2+(1-A_{T,2})\dot r_2^2r_2^{{-}1}\eta_2=0,
\end{align}
where  $\alpha =r_1/r_2$ is the radius ratio. Note that both (2.10) and (2.11) include
 $\ddot {\eta }_1$ and
 $\ddot {\eta }_2$, and thus, cannot individually describe the perturbation growths of the outer and inner interfaces. In order to provide separate descriptions of the perturbation growths of the outer and inner interfaces,
 $\ddot \eta _2$ in (2.10) and
 $\ddot \eta _1$ in (2.11) are eliminated by the linear combinations of (2.10) and (2.11), i.e.
 $(\alpha ^{2n}-A_{T,2})$ (2.10)
 $-\alpha ^{n}(1+A_{T,1})$ (2.11) and
 $\alpha ^{n}(1-A_{T,2})$ (2.10)
 $-(\alpha ^{2n}+A_{T,1})$ (2.11), respectively. Then the governing equations for
 $\eta _1$ and
 $\eta _2$ can be further written as
 \begin{align} &\frac{\mathrm{d}(r_1^2\dot\eta_1)}{\mathrm{d}t}+(nA_{T,1}+1)r_1\ddot r_1\eta_1-\frac{nA_{T,1}A_{T,2}(1+A_{T,1})}{(\alpha^{2n}+A_{T,1}A_{T,2})}r_1\ddot r_1\eta_1\nonumber\\ &\qquad +\frac{n\alpha^{2n}(\alpha^{2}-1)(1+A_{T,1})(1+A_{T,2})(r_1\dot r_1\dot\eta_1+\dot r_1^2\eta_1)}{(\alpha^{2n}-1)(\alpha^{2n}+A_{T,1}A_{T,2})}\nonumber\\ &\quad =\frac{n\alpha^{3n+1}(\alpha^2-1)(1+A_{T,1})(1+A_{T,2})\dot r_1^2\eta_2}{(\alpha^{2n}-1)(\alpha^{2n}+A_{T,1}A_{T,2})}\nonumber\\ &\qquad-\frac{n\alpha^{n+1}(1+A_{T,1})A_{T,2}r_1\ddot r_1\eta_2}{(\alpha^{2n}+A_{T,1}A_{T,2})}+\frac{n\alpha^{n-1}(\alpha^{2}-1)(1+A_{T,1})(\alpha^{2n}+A_{T,2})r_1\dot r_1\dot\eta_2}{(\alpha^{2n}-1)(\alpha^{2n}+A_{T,1}A_{T,2})} \end{align}
and
 \begin{align} &\frac{\mathrm{d}(r_2^2\dot\eta_2)}{\mathrm{d}t}+(nA_{T,2}+1)r_2\ddot r_2\eta_2+\frac{nA_{T,1}A_{T,2}(1-A_{T,2})}{(\alpha^{2n}+A_{T,1}A_{T,2})}r_2\ddot r_2\eta_2\nonumber\\ &\qquad +\frac{n\alpha^{2n-2}(\alpha^2-1)(1-A_{T,1})(1-A_{T,2})(r_2\dot r_2\dot\eta_2+\dot r_2^2\eta_2)}{(\alpha^{2n}-1)(\alpha^{2n}+A_{T,1}A_{T,2})}\nonumber\\ &\quad=\frac{n\alpha^{3n-3}(\alpha^{2}-1)(1-A_{T,1})(1-A_{T,2})\dot r_2^2\eta_1}{(\alpha^{2n}-1)(\alpha^{2n}+A_{T,1}A_{T,2})}\nonumber\\ &\qquad-\frac{n\alpha^{n-1}A_{T,1}(1-A_{T,2})r_2\ddot r_2\eta_1}{(\alpha^{2n}+A_{T,1}A_{T,2})}+\frac{n\alpha^{n-1}(\alpha^2-1)(1-A_{T,2})(\alpha^{2n}-A_{T,1})r_2\dot r_2\dot\eta_1}{(\alpha^{2n}-1)(\alpha^{2n}+A_{T,1}A_{T,2})}, \end{align}
respectively. The second terms on the left-hand side of (2.12) and (2.13) correspond to the RT effect caused by non-uniform motion of the interface. The third and fourth terms on the left-hand side represent the thin-shell correction. All three terms on the right-hand side of (2.12) and (2.13) are interface coupling effects describing the influences of the perturbation at one interface on that at another. Both the thin-shell correction and interface coupling effect will be insignificant when the thickness increases (i.e.  $\alpha \rightarrow \infty$). However, it is crucial to consider these two effects in thin fluid layers. When
 $A_{T,1}=1$ and
 $A_{T,2}=-1$, (2.12) and (2.13) are reduced to the model of Zhang et al. (Reference Zhang, Liu, Kang, Xiao, Tao, Zhang, Zhang and He2020) describing the instability evolution of a cylindrical fluid shell in vacuum. Therefore, the present model extends the model of Zhang et al. (Reference Zhang, Liu, Kang, Xiao, Tao, Zhang, Zhang and He2020) and analytically describes the perturbation growth of an incompressible cylindrical fluid layer with arbitrary Atwood numbers.
Following Ding et al. (Reference Ding, Si, Yang, Lu, Zhai and Luo2017) and Luo et al. (Reference Luo, Li, Ding, Zhai and Si2019), the perturbation amplitude can be obtained by integrating (2.12) and (2.13) from  $t_0$ to
 $t$ twice as
 \begin{equation} \eta_i=\eta_{i,RM}+\eta_{i,RT}+\eta_{i,Thin}+\eta_{i,Cou}.\end{equation}
Here,  $\eta _{i,RM}$ represents the perturbation growth due to RM instability,
 $\eta _{i,RT}$ is the contribution of the RT effect to the perturbation growth,
 $\eta _{i,Thin}$ denotes the growth induced by the thin-shell correction and
 $\eta _{i,Cou}$ represents the contribution of the interface coupling effect. Specifically,
 \begin{equation} \eta_{i,RM} = \int_{t_{0}}^{t} \frac{r_{i,t_j^+}^2\dot\eta_{i,t_j^+}}{r_i^2(\tau)} \,\mathrm{d} \tau,\end{equation}
where  $r_{i,t_j^+}$ and
 $\dot \eta _{i,t_j^+}$ in (2.15) represent the position and growth rate of the
 $i$th interface at the end moment
 $t_j^+$ of the
 $j$th wave passing through the interface, and
 \begin{equation} \eta_{i,RT} = \int_{t_{0}}^{t} -\frac{nA_{T,i}+1}{r_i^2(t^{\prime})}\int_{t_{0}}^{t^{\prime}} r_i(\tau)\ddot r_i(\tau)\eta_i(\tau)\, \mathrm{d}\tau \, \mathrm{d} t^{\prime}.\end{equation}
Terms  $\eta _{1,Thin}$ and
 $\eta _{2,Thin}$ take forms as
 \begin{align} \eta_{1,Thin} &=\int_{t_{0}}^{t}\frac{1}{r_1^2(t^{\prime})}\left\{ {\int_{t_{0}}^{t^{\prime}}\frac{nA_{T,1}A_{T,2}(1+A_{T,1})}{\alpha^{2n}(\tau)+A_{T,1}A_{T,2}}r_1(\tau)\ddot{r}_1(\tau)\eta_1(\tau) \, \mathrm{d}\tau} \right. \nonumber\\ &\quad {-\int_{t_{0}}^{t^{\prime}}\frac{n\alpha^{2n}(\tau)[\alpha^{2}(\tau)-1](1+A_{T,1})(1+A_{T,2})}{[\alpha^{2n}(\tau)-1][\alpha^{2n}(\tau)+A_{T,1}A_{T,2}]}r_1(\tau)\dot r_1(\tau)\dot\eta_1(\tau)\, \mathrm{d}\tau} \nonumber\\ &\quad\left. {-\int_{t_{0}}^{t^{\prime}}\frac{n\alpha^{2n}(\tau)[\alpha^{2}(\tau)-1](1+A_{T,1})(1+A_{T,2})}{[\alpha^{2n}(\tau)-1][\alpha^{2n}(\tau)+A_{T,1}A_{T,2}]}\dot r_1^2(\tau)\eta_1(\tau)\, \mathrm{d}\tau} \right\} \, \mathrm{d} t^{\prime} \end{align}
and
 \begin{align} \eta_{2,Thin} &=\int_{t_{0}}^{t}\frac{1}{r_2^2(t^{\prime})}\left\{ {-\int_{t_{0}}^{t^{\prime}}\frac{nA_{T,1}A_{T,2}(1-A_{T,2})}{\alpha^{2n}(\tau)+A_{T,1}A_{T,2}}r_2(\tau)\ddot{r}_2(\tau)\eta_2(\tau) \, \mathrm{d}\tau} \right. \nonumber\\ &\quad \left.{-\int_{t_{0}}^{t^{\prime}}\frac{n\alpha^{2n-2}(\tau)[\alpha^{2}(\tau)-1](1-A_{T,1})(1-A_{T,2})}{[\alpha^{2n}(\tau)-1][\alpha^{2n}(\tau)+A_{T,1}A_{T,2}]}r_2(\tau)\dot r_2(\tau)\dot\eta_2(\tau)\, \mathrm{d}\tau} \right. \nonumber\\ &\quad \left.{-\int_{t_{0}}^{t^{\prime}}\frac{n\alpha^{2n-2}(\tau)[\alpha^{2}(\tau)-1](1-A_{T,1})(1-A_{T,2})}{[\alpha^{2n}(\tau)-1][\alpha^{2n}(\tau)+A_{T,1}A_{T,2}]}\dot r_2^2(\tau)\eta_2(\tau)\, \mathrm{d}\tau} \right\} \, \mathrm{d} t^{\prime}, \end{align}
respectively. Terms  $\eta _{1,Cou}$ and
 $\eta _{2,Cou}$ are read as
 \begin{align} \eta_{1,Cou} &=\int_{t_{0}}^{t}\frac{1}{r_1^2(t^{\prime})}\left\{ {-\int_{t_{0}}^{t^{\prime}}\frac{n\alpha^{n+1}(\tau)(1+A_{T,1})A_{T,2}}{\alpha^{2n}(\tau)+A_{T,1}A_{T,2}}r_1(\tau)\ddot r_1(\tau)\eta_2(\tau)\, \mathrm{d}\tau} \right.\nonumber\\ &\quad{+\int_{t_{0}}^{t^{\prime}}\frac{n\alpha^{n-1}(\tau)[\alpha^{2}(\tau)-1](1+A_{T,1})[\alpha^{2n}(\tau)+A_{T,2}]}{[\alpha^{2n}(\tau)-1][\alpha^{2n}(\tau)+A_{T,1}A_{T,2}]}r_1(\tau)\dot r_1(\tau)\dot\eta_2(\tau)\, \mathrm{d}\tau}\nonumber\\ &\quad\left.{+\int_{t_{0}}^{t^{\prime}}\frac{n\alpha^{3n+1}(\tau)[\alpha^2(\tau)-1](1+A_{T,1})(1+A_{T,2})}{[\alpha^{2n}(\tau)-1][\alpha^{2n}(\tau)+A_{T,1}A_{T,2}]}\dot r_1^2(\tau)\eta_2(\tau)\, \mathrm{d}\tau} \right\} \, \mathrm{d} t^{\prime} \end{align}
and
 \begin{align} \eta_{2,Cou} &=\int_{t_{0}}^{t}\frac{1}{r_2^2(t^{\prime})}\left\{ {-\int_{t_{0}}^{t^{\prime}}\frac{n\alpha^{n-1}(\tau)A_{T,1}(1-A_{T,2})}{\alpha^{2n}(\tau)+A_{T,1}A_{T,2}}r_2(\tau)\ddot r_2(\tau)\eta_1(\tau)\, \mathrm{d}\tau} \right.\nonumber\\ &\quad {+\int_{t_{0}}^{t^{\prime}}\frac{n\alpha^{n-1}(\tau)[\alpha^{2}(\tau)-1](1-A_{T,2})[\alpha^{2n}(\tau)-A_{T,1}]}{[\alpha^{2n}(\tau)-1][\alpha^{2n}(\tau)+A_{T,1}A_{T,2}]}r_2(\tau)\dot r_2(\tau)\dot\eta_1(\tau)\, \mathrm{d}\tau} \nonumber\\ &\quad \left.{+\int_{t_{0}}^{t^{\prime}}\frac{n\alpha^{3n-3}(\tau)[\alpha^2(\tau)-1](1-A_{T,1})(1-A_{T,2})}{[\alpha^{2n}(\tau)-1][\alpha^{2n}(\tau)+A_{T,1}A_{T,2}]}\dot r_2^2(\tau)\eta_1(\tau)\, \mathrm{d}\tau} \right\} \, \mathrm{d} t^{\prime}, \end{align}
respectively.
It is worth noting that (2.14) derived within the framework of the incompressible potential flow inherently disregards the compressibility effect and the compression and/or decompression effect of waves. Here, the compressibility effect refers to the effect of fluid compression caused by the basic flow to the centre of cylindrical geometry (Bell Reference Bell1951; Epstein Reference Epstein2004). Moreover, the compression or decompression effect of waves denotes the sudden decrease/increase in the perturbation amplitude during the wave passing through the interface (Richtmyer Reference Richtmyer1960; Liang & Luo Reference Liang and Luo2021). Evidently, these two effects describe distinct physical processes compared with the incompressible model and make noteworthy contributions to perturbation growth on the cylindrical interface (Luo et al. Reference Luo, Li, Ding, Zhai and Si2019; Yuan et al. Reference Yuan, Zhao, Liu, Wang, Liu and Lu2023; Zhang et al. Reference Zhang, Ding, Si and Luo2023). These two effects can be modelled as following two terms. Specifically, according to Bell (Reference Bell1951) and Epstein (Reference Epstein2004), the compressibility effect caused by the base flow to the centre after the impact of the incident shock can be modelled as
 \begin{equation} \eta_{i,Com} = \int_{t_{0}}^{t} \frac{c_i}{r_i^2(t^{\prime})}\left[\int_{t_{0}}^{t^{\prime}} r_i(\tau)\dot r_i(\tau)\eta_i(\tau)\, \mathrm{d}\tau +\int_{t_{0}}^{t^{\prime}} r_i^2(\tau)\dot\eta_i(\tau)\, \mathrm{d}\tau\right] \, \mathrm{d} t^{\prime},\end{equation}
where the parameter  $c_i=-\dot {\rho }_{i,in}/\rho _{i,in}=-\dot {\rho }_{i,out}/\rho _{i,out}$ is the expansion rate of the species at the
 $i$th interface. The expansion rate can be approximated as a constant value,
 $c_i\approx [(r_{i,min}/r_{i,0})^2-1]/t_{res}$ (Luo et al. Reference Luo, Li, Ding, Zhai and Si2019; Wu, Liu & Xiao Reference Wu, Liu and Xiao2021), where
 $r_{i,min}$ denotes the smallest radius of the
 $i$th interface during its motion,
 $r_{i,0}$ is the initial position of the
 $i$th interface and
 $t_{res}$ represents the time when the reshock happens. Moreover, the compression/decompression effect represents the sudden decrease/increase of the perturbation amplitude of the interface impacted by one known wave (Richtmyer Reference Richtmyer1960; Liang & Luo Reference Liang and Luo2021). For a shock-accelerated fluid layer, the inner and outer interfaces are successively impacted by several waves as a result of reverberations inside the layer. The overall variations of the perturbation amplitudes on the interfaces caused by the compression/decompression effects of the successive waves can be modelled by accumulating every rapid decrease/increase of the amplitude induced by each wave (Yuan et al. Reference Yuan, Zhao, Liu, Wang, Liu and Lu2023),
 \begin{equation} \eta_{i,CD}=\eta_{i,t_0}+\int_{t_0}^{t}\frac{\Delta V(\tau)}{2} \, \mathrm{d}\tau, \end{equation}
where  $\eta _{i,t_0}$ is the initial amplitude of the
 $i$th interface at
 $t_0$. The function
 $\Delta V(\tau )$ defined in (2.22) represents the radial velocity jump of the unperturbed interface at the moment
 $\tau$, namely if
 $t_j^-<\tau < t_j^+$,
 $\Delta V(\tau )=\pm |\Delta V_j|$, otherwise
 $\Delta V(\tau )=0$. Here,
 $\Delta V_j$ is the
 $j$th radial velocity jump of the interface impacted by the
 $j$th wave reverberated inside the fluid layer,
 $t_j^-$ and
 $t_j^+$ are the beginning and end moments of the
 $j$th wave passing through the interface and the operators ‘
 $+$’ and ‘
 $-$’ before the term
 $|\Delta V_j|$ represent decompression and compression effects.
Typically, the terms describing the above two effects are linearly superimposed on incompressible models, and it has been demonstrated that the resulting superimposed model effectively describes the instability evolution on cylindrical interfaces. Specifically, via a comparative analysis of compressible and incompressible models of instability evolution for the cylindrical interface (Bell Reference Bell1951; Epstein Reference Epstein2004; Luo et al. Reference Luo, Li, Ding, Zhai and Si2019; Zhang et al. Reference Zhang, Ding, Si and Luo2023), the term (2.21) describing the compressibility effect resulting from the base flow towards the centre can be linearly superimposed on the incompressible model. Moreover, the term (2.22) modelling the compression/decompression effect of waves has been linearly superimposed on the incompressible model by Zhang et al. (Reference Zhang, Ding, Si and Luo2023) to effectively describe instability evolution in the heavy fluid layer impacted by a divergent shock. To this end, the terms (2.21) and (2.22) are linearly superimposed on (2.14) as
 \begin{equation} \eta_i=\eta_{i,RM}+\eta_{i,RT}+\eta_{i,Thin}+\eta_{i,Cou}+\eta_{i,Com}+\eta_{i,CD}, \end{equation}
thereby improving the incompressible model to predict the perturbation growth on a shock-accelerated cylindrical fluid layer with arbitrary Atwood numbers. It is possible to model the perturbation growth in this linear superposition because each contribution in the model (2.23) represents an independent physical mechanism responsible for the perturbation growth (Bell Reference Bell1951; Epstein Reference Epstein2004; Zhang et al. Reference Zhang, Liu, Kang, Xiao, Tao, Zhang, Zhang and He2020). Moreover, the incompressible terms (2.14) are derived from the linear stability analysis, which assumes the perturbation amplitudes to be small ( $\eta _i/\lambda _i\lesssim 0.1$) (Bell Reference Bell1951; Epstein Reference Epstein2004). Therefore, the nonlinear effects associated with the higher-order terms of amplitude can be disregarded and are not considered in the contributions at the linear stage of the perturbation growth.
It is important to note that the use of the present model (2.23) requires obtaining the  $i$th interface's trajectory
 $r_i (t)$, post-shock Atwood number
 $A_{T,i}$, expansion rate
 $c_i$ and the velocity jump induced by the
 $j$th wave
 $\Delta V_j$ from the base flow, i.e. shock-accelerated unperturbed cylindrical fluid layer (Wu et al. Reference Wu, Liu and Xiao2021). Moreover, the beginning
 $t_j^-$ and end
 $t_j^+$ moments of the
 $j$th wave passing through the perturbed interface and the growth rate
 $\dot \eta _{i,t_j^+}$ of the perturbation on the
 $i$th interface at
 $t_j^+$ need to be obtained from numerical or experimental data (Ding et al. Reference Ding, Si, Yang, Lu, Zhai and Luo2017; Wu et al. Reference Wu, Liu and Xiao2021; Yuan et al. Reference Yuan, Zhao, Liu, Wang, Liu and Lu2023; Zhang et al. Reference Zhang, Ding, Si and Luo2023). According to previous work (Luo et al. Reference Luo, Li, Ding, Zhai and Si2019; Zou et al. Reference Zou, Al-Marouf, Cheng, Samtaney, Ding and Luo2019; Wu et al. Reference Wu, Liu and Xiao2021), the impact of shock waves on the interface causes rapid changes in the amplitude and growth rate of the perturbation at the interface. To include the effect of shock wave interaction on the growth rate, the integrals in the model are performed piecewise in the time between wave interactions and the growth rate in the RM term
 $\eta _{i,RM}$ is updated from the DNS results at time
 $t_j^+$. The change in perturbation amplitude caused by the impact of a shock wave is modelled by the compression/decompression term
 $\eta _{i,CD}$. Consequently, the present model (2.23) is capable of describing the entire process of the instability evolution in a shock-accelerated cylindrical fluid layer.
3. Numerical methods
3.1. Governing equations
Direct numerical simulation has been performed to obtain the instability evolution of the shock-accelerated fluid layer in cylindrical geometry and then to validate the present model (2.23). The pressure  $p^*_A$ and density
 $\rho ^*_A$ of unshocked outer fluid
 $A$, as shown in figure 1, are chosen as the characteristic scales. Here, the characteristic velocity and temperature are described, respectively, as
 $u^*_A=\sqrt {p^*_A/\rho ^*_A}$ and
 $T^*_A=p^*_A M^*_A/(R^* \rho ^*_A)$ with the universal gas constant
 $R^*$ and fluid
 $A$'s molar mass
 $M^*_A$. Hereafter, the superscript ‘
 $*$’ denotes the dimensional physical quantity and the subscript ‘
 $A$’ corresponds to the quantity of unshocked fluid
 $A$. The radius of the unperturbed outer interface
 $r^*_1$ has been used as the characteristic length. Thus, the non-dimensionalized governing equations in cylindrical coordinates
 $(r,\theta )$ are
 \begin{gather} \frac{\partial \rho}{\partial t}+\boldsymbol{\nabla}\boldsymbol{{{\cdot}}}(\rho \boldsymbol{u})=0, \end{gather}
 \begin{gather}\frac{\partial (\rho \boldsymbol{u})}{\partial t}+\boldsymbol{\nabla}\boldsymbol{{{\cdot}}}(\rho \boldsymbol{uu})={-}\boldsymbol{\nabla} p+\frac{1}{Re}\boldsymbol{\nabla}\boldsymbol{{{\cdot}}}\boldsymbol{\tau}, \end{gather}
 \begin{gather}\frac{\partial (\rho E)}{\partial t}+\boldsymbol{\nabla}\boldsymbol{{{\cdot}}}[(\rho E+p)\boldsymbol{u}]= \frac{1}{Re}\boldsymbol{\nabla}\boldsymbol{{{\cdot}}}(\boldsymbol{\tau\boldsymbol{{{\cdot}}} u})-\frac{1}{RePr}\boldsymbol{\nabla}\boldsymbol{{{\cdot}}}\boldsymbol{q}_c -\frac{1}{ReSc}\boldsymbol{\nabla}\boldsymbol{{{\cdot}}}\boldsymbol{q}_d, \end{gather}
 \begin{gather}\frac{\partial (\rho Y_i)}{\partial t}+\boldsymbol{\nabla}\boldsymbol{{{\cdot}}}(\rho Y_i \boldsymbol{u})={-}\frac{1}{Re Sc}\boldsymbol{\nabla}\boldsymbol{{{\cdot}}}\boldsymbol{J}_i, \quad i=A,B, \end{gather}
where  $\rho$ is the fluid density;
 $\boldsymbol {u}=(u_r,u_\theta )$ denotes the velocity vector;
 $p$ is the pressure;
 $E=C_vT+\boldsymbol {u}\boldsymbol {{{\cdot }}}\boldsymbol {u}/2$ denotes the specific total energy with the specific heat at constant volume
 $C_v$ and the temperature
 $T$;
 $Y_A=\rho _A/\rho$ and
 $Y_B=\rho _B/\rho$ are the species mass fractions of fluids
 $A$ and
 $B$, respectively, and
 $Y_C=1-Y_A-Y_B$ is the species mass fraction of fluid
 $C$; and the symbol
 $\boldsymbol {\nabla }$ denotes the vector-differentiation operator. The stress tensor is obtained as
 $\boldsymbol \tau =2\mu \boldsymbol {S}-2\mu /3(\boldsymbol {\nabla }\boldsymbol {{{\cdot }}}\boldsymbol {u})\boldsymbol \delta$, where
 $\mu$ is the dynamic viscosity,
 $\boldsymbol {S}=(\boldsymbol {\nabla }\boldsymbol {u}+(\boldsymbol {\nabla }\boldsymbol {u}) ^{T})/2$ is the strain-rate tensor and
 $\boldsymbol \delta$ represents the unit tensor. The heat fluxes due to heat conduction (
 $\boldsymbol {q}_c$) and interspecies enthalpy diffusion (
 $\boldsymbol {q}_d$) are given by
 $\boldsymbol {q}_c=-\gamma _A/[ M_A(\gamma _A-1)] \kappa \boldsymbol {\nabla } T$ and
 $\boldsymbol {q}_d=\sum _{i} h_i\boldsymbol {J}_i (i=A, B, C)$, respectively, where
 $\gamma _A$ is the ratio of specific heats of fluid
 $A$,
 $M_A$ is the molar mass of fluid
 $A$,
 $\kappa$ is the heat conduction coefficient,
 $h_i$ is the enthalpy,
 $\boldsymbol {J}_i=-\rho D \boldsymbol {\nabla } Y_i$ is the diffusive mass flux obtained by the Fick law and
 $D$ is the diffusion coefficient. The above governing equations are closed with the non-dimensionalized ideal gas equation of state, i.e.
 $p=\rho T /M$, where
 $M$ is the molar mass. Based on
 $\sum _{i}Y_i=1$, the summation of the species mass fraction transport equations of all species given by (3.4) can be reasonably recovered as the continuity equation (3.1) for the mixture density. Moreover, the same difference scheme should be used to approximate
 $\boldsymbol {\nabla } Y_i$ for each species, ensuring that the numerical simulation satisfies
 $\sum _{i}(\boldsymbol {\nabla }\boldsymbol {{{\cdot }}}{J}_i)=0$.
Following Ge et al. (Reference Ge, Li, Zhang and Tian2022), the density and pressure of the mixture are obtained by the summation of each species, while the temperature is equal for each species of the mixture. Therefore, the molecular mass of the mixture is given by  $M=(\sum Y_i/M_i)^{-1}$, where
 $M_i$ is the molecular mass of the
 $i$th species. The quantities describing the physical properties of the mixture, such as the dynamic viscosity
 $\mu$, the diffusion coefficient
 $D$, the heat conduction coefficient
 $\kappa$, the specific heat at constant pressure
 $C_{p}$ and the specific heat at constant volume
 $C_{v}$, are calculated by the linear combinations of each species weighted with their mass fractions. The dynamic viscosity of the
 $i$th species
 $\mu _i$ is computed by the Sutherland law as
 \begin{equation} \mu_i=\frac{\mu_{0,i}^*}{\mu_{A}^*}\left( \frac{T_A^* T}{T_0^*}\right)^{3/2}\frac{T_0^*+T_s^*}{T_A^* T+T_s^*}, \end{equation}
where  $T_s^*=124\ \rm {K}$ and
 $\mu _{0,i}^*$ is the dynamic viscosity at the reference temperature
 $T_0^*=273.15\ \rm {K}$. The heat conduction coefficient
 $\kappa _i$ and diffusion coefficient
 $D_i$ of the
 $i$th species can be obtained by the constant Prandtl number,
 $Pr_i=C_{p,i}^* \mu _{i}^*/\kappa _i^*$, and the constant Schmidt number,
 $Sc_i=\mu _{i}^*/(\rho _i^* D_i^*)$, respectively. The specific heat at constant pressure can be calculated by
 $C_{p,i}^*=\gamma _i R^*/[(\gamma _i-1)M_i^*]$. Moreover, the parameters of fluids to obtain the quantities describing the mixture properties are listed in table 1. Note that the present model (2.23) based on the potential flow assumption is suitable for describing the instability evolutions of shock-accelerated fluid layers without viscosity or with high Reynolds number. However, to get closer to the interfacial instability in real applications or experiments, the gases with real parameters are selected for the simulation and the viscosity of gas is included.
Initial unshocked parameters of the species. Here the subscript  $i=N$,
 $A$,
 $C$,
 $K$ and
 $S$ represents the species Ne (Neon), air, CO
 $_2$ (Carbon Dioxide), Kr (Krypton) and SF
 $_6$ (Sulphur hexafluoride), respectively.

The non-dimensional parameters in (3.1)–(3.4) are the Reynolds, Prandtl and Schmidt numbers defined, respectively, as
 \begin{equation} Re=\frac{\rho_A^* u_A^* r_1^*}{\mu_A^*}, \quad Pr=\frac{C_{p,A}^* \mu_A^*}{\kappa_A^*}, \quad Sc=\frac{\mu_A^*}{\rho_A^* D_A^*}.\end{equation}
In the present study the outer fluid  $A$ and intermediate fluid
 $B$ in figure 1 are fixed to air and SF
 $_6$, respectively, to keep the same strength of incident shock wave and Atwood number at the outer interface
 $A_{T,1}$. Therefore, the physical quantities of unshocked air are chosen as the characteristic scales. Thus, the Prandtl and Schmidt numbers in governing equations are 0.72 and 0.757, respectively. A sufficiently high Reynolds number is set as
 $10^{5}$ to avoid the effects of viscosity, heat conduction and interfacial diffusion on the instability evolution (Walchli & Thornber Reference Walchli and Thornber2017).
A numerical algorithm of high-order finite difference schemes is used to solve the governing equations (3.1)–(3.4) in cylindrical coordinates. Specifically, the seventh-order weighted essentially non-oscillatory scheme is implemented to discretize the convective terms. The eighth-order central difference scheme is performed to discretize the viscous terms. The time derivative is approximated by the classical third-order Runge–Kutta method. To validate the present numerical algorithm, the RM instability of the cylindrical air/SF $_6$ interface accelerated by an incident shock with the shock Mach number
 $Ma=1.25$ is simulated and compared with the DNS results from Wu et al. (Reference Wu, Liu and Xiao2021). The initial perturbation amplitude
 $a_0=0.025$ and the premixed thickness of the interface
 $\delta =0.025$ are consistent with the parameters used by Wu et al. (Reference Wu, Liu and Xiao2021). Figure 2 clearly demonstrates that the evolution of the perturbation amplitude in the present study is in excellent agreement with the DNS results reported by Wu et al. (Reference Wu, Liu and Xiao2021). This agreement serves as validation, indicating that the DNS utilized in the current work effectively captures the perturbation growth in a shock-accelerated cylindrical interface. The above numerical algorithm to simulate the instability evolution has also been well validated in previous studies (Zhao et al. Reference Zhao, Wang, Liu and Lu2020; Fu et al. Reference Fu, Zhao, Xu, Wang, Liu, Wan and Lu2022; Yuan et al. Reference Yuan, Zhao, Liu, Wang, Liu and Lu2023).
Evolution of the perturbation amplitude (red solid line) for the single-mode cylindrical RM instability at the initial perturbation amplitude  $a_0=0.025$ and the premixed thickness of the interface
 $\delta =0.025$ in comparison with the numerical data (blue squares) (Wu et al. Reference Wu, Liu and Xiao2021).

3.2. Problem set-up
The shape function of a cosinoidally perturbed interface is defined as  $\zeta _i(\theta )=r_i+a_i \cos (n \theta )$ (
 $i=1, 2$), where
 $a_i$ and
 $n$ are the initial amplitude and wavenumber, respectively. Notably, the amplitude is set as
 $a_i=0$ for an unperturbed interface. By introducing the error function to smooth the interfaces, the mass fraction fields of fluids
 $A$ and
 $B$ are initialized as
 \begin{gather} Y_A(r,\theta; t=0)=\frac{1}{2}\left[1+{erf}\left( \frac{{r}-\zeta_1(\theta)}{\delta}\right)\right], \end{gather}
 \begin{gather}Y_B(r,\theta; t=0)= \frac{1}{2}\left[{erf}\left( \frac{{r}-\zeta_2(\theta)}{\delta}\right) -{erf}\left( \frac{{r}-\zeta_1(\theta)}{\delta}\right) \right], \end{gather}
respectively, where  $\delta =0.005$ is the initial premixed thickness of the interface, which is low enough to ignore the interfacial diffusion (Walchli & Thornber Reference Walchli and Thornber2017). The incident shock with shock Mach number
 $Ma=1.25$ is initially at
 $r_s=1.25$ for consistency with the experiments (Ding et al. Reference Ding, Li, Sun, Zhai and Luo2019; Sun et al. Reference Sun, Ding, Zhai, Si and Luo2020) and simulations (Wu et al. Reference Wu, Liu and Xiao2021; Li et al. Reference Li, Ding, Luo and Zou2022). The present work assumes a uniform pressure
 $p=1$ and temperature
 $T=1$ in unshocked regions. The initialization of the post-shock fluid is supposed to be uniform and calculated using the Rankine–Hugoniot conditions (Wu et al. Reference Wu, Liu and Xiao2021; Li et al. Reference Li, Ding, Luo and Zou2022; Yan et al. Reference Yan, Fu, Wang, Yu and Li2022).
The shocked fluid layer is numerically investigated within a two-dimensional circular domain  $D = \{(r,\theta ) | r_{in}\leqslant r\leqslant r_{out}, 0\leqslant \theta < 2{\rm \pi} \}$. To avoid a pole singularity at the centre of the cylindrical coordinates, a micro-hole with a radius
 $r_{in}=0.01$ is dug out. This strategy has been commonly verified to have little influence on the interfacial instability evolution (Zhao et al. Reference Zhao, Wang, Liu and Lu2020; Wu et al. Reference Wu, Liu and Xiao2021). In addition, in order to eliminate effects of reflected waves from the exterior boundary, a sufficiently long sponge layer with a radial width of approximately
 $19r_{out}$ is added at
 $r > r_{out}=1.5$. Following previous work (Lombardini, Pullin & Meiron Reference Lombardini, Pullin and Meiron2014; Wu et al. Reference Wu, Liu and Xiao2021), a reflective wall boundary condition is applied to the interior boundary at
 $r=r_{in}$, where the velocity and the gradients of the density, temperature and species mass fractions are set to zero. A type of non-reflecting boundary condition is prescribed on the exterior boundary at
 $r=20r_{out}$, where the numerical fluxes of the waves propagating out of the domain are extrapolated from the solution within the domain while those propagating into the domain are set to zero. In fact, the outward-moving reflected shocks formed by the collision of the incident shock on the fluid layer do not reach the exterior boundary at
 $r=20r_{out}$ until the end of the simulation. Hence, the boundary conditions at the exterior side have a negligible impact on the current numerical results. In the present study the initial ratio
 $\alpha _0$ has been set as
 $1.1$ and the fluid layer is thin enough to have an obvious interface coupling effect (Zhang et al. Reference Zhang, Liu, Kang, Xiao, Tao, Zhang, Zhang and He2020). It is noted that all the simulations are performed on the grid resolution of
 $1200^2$, which has been confirmed to well capture the essential flow dynamics in instability evolution on shocked heavy fluid layers (Yuan et al. Reference Yuan, Zhao, Liu, Wang, Liu and Lu2023).
4. Validation and discussion
To validate the model (2.23), three cylindrical fluid-layer configurations, i.e. air/SF $_6$/Kr (ASK) layer, air/SF
 $_6$/CO
 $_2$ (ASC) layer and air/SF
 $_6$/Ne (ASN) layer have been simulated. For these three configurations, the outer fluid
 $A$ and intermediate fluid
 $B$ in figure 1 are fixed to air and SF
 $_6$, respectively, to ensure that the strength of the incident shock wave and Atwood number at the outer interface
 $A_{T,1}$ are the same in each simulated case. The inner fluid
 $C$ in figure 1 is set to Kr, CO
 $_2$ and Ne, to verify the applicability of model (2.23) to various Atwood numbers at the inner interface and to further investigate the effect of Atwood number on the shock-accelerated cylindrical fluid layer. Moreover, the validations of the model's applicability to various Atwood numbers at the outer interface are presented in the Appendix.
4.1. Base flow
The flow field behind a converging shock is non-uniform as the converging shock travels to the geometry centre (Chisnell Reference Chisnell1998), and hence, no analytical solution exists for the base flow of a shock-accelerated cylindrical fluid layer (Luo et al. Reference Luo, Li, Ding, Zhai and Si2019). Therefore, an initially unperturbed fluid layer impacted by a concentric shock must be firstly examined to provide a base flow. The parameters of the ASK, ASC and ASN layers are listed in table 2. For these three layers,  $A_{T,1}$ is fixed at
 $0.706$ and
 $A_{T,2}$ decreases from
 $-0.375$ to
 $-0.572$ and
 $-0.789$. Since the evolutions of interfaces and waves are qualitatively the same in the three layers, the ASC layer is taken as an example to detail the wave patterns and interface motions of the shock-accelerated cylindrical fluid layer.
Detailed parameters corresponding to the base flow of different fluid layers. Here  $A_{T,i}$ is the post-shock Atwood number,
 $c_i$ denotes the expansion rate of the species,
 $\Delta V_j$ represents the
 $j$th jump of interfacial inward velocity before reshock and
 $\Delta V_r$ denotes the jump induced by the reshock.

The quantitative descriptions for positions of waves and interfaces and for radial velocities ( $u_r$) of interfaces are displayed in figure 3. Note that the temporal origin is defined as the moment when the incident shock (IS
 $_0$) meets the outer interface (II
 $_1$). As the IS
 $_0$ travels inwards and collides with II
 $_1$, it bifurcates into an inward-moving transmitted shock (TS
 $_1$) and an outward-moving reflected shock (RS
 $_1$). Impacted by IS
 $_0$, II
 $_1$ speeds up rapidly and then starts to move inwards at a nearly constant speed. Then, TS
 $_1$ colliding with the inner interface (II
 $_2$) generates a second inward-moving transmitted shock (TS
 $_2$) and an outward-moving rarefaction wave (RW) since II
 $_2$ is a heavy/light interface relative to the motion of TS
 $_1$. Accelerated by TS
 $_1$, II
 $_2$ has a rapid decrease of velocity and starts to move inwards as shown in figure 3(b). The outward-moving RW impacts upon II
 $_1$, leading to a velocity jump of II
 $_1$ due to the fact that the pressure behind the RW front is lower than that before the RW front (Liang et al. Reference Liang, Liu, Zhai, Si and Wen2020). Meanwhile, since II
 $_1$ is a heavy/light interface relative to the motion of RW, a transmitted rarefaction wave (TRW) is refracted outside the fluid layer and an inward-moving compression wave (CW) is reflected to collide with II
 $_2$, resulting in a velocity increase of II
 $_2$. Theoretically, the above wave propagation will be reverberated many times inside the fluid layer. However, after the CW collides with II
 $_2$, the waves reverberated inside the fluid layer are too weak to influence the interface velocity and can be ignored. Later, an outward-moving shock (RS
 $_2$) is reflected to expand outwards when TS
 $_2$ focuses at the geometry centre. At the same time, two interfaces slow down gradually due to the compressibility of the inner species and the effect of the RS
 $_2$ (Wu et al. Reference Wu, Liu and Xiao2021). Impacting with II
 $_2$, RS
 $_2$ bifurcates into an outward-moving transmitted shock (TS
 $_3$) and an inward-moving reflected shock (RS
 $_3$). Soon, TS
 $_3$ colliding with II
 $_1$ generates an outward-moving transmitted shock (TS
 $_4$) and reflects an inward-moving rarefaction wave (IRW). As indicated by figure 3(b), RS
 $_2$ impacting upon II
 $_2$ and TS
 $_3$ colliding with II
 $_1$ cause another velocity jump at II
 $_2$ and II
 $_1$, respectively.
Temporal variations of (a) radial positions of interfaces and waves and of (b) radial velocities of interfaces at which the circular IS $_0$ impacts upon the unperturbed ASC layer with
 $\alpha _0=1.1$. Notation: IS
 $_0$, incident shock; II
 $_1$, outer interface; II
 $_2$, inner interface; RS
 $_i$,
 $i$th reflected shock; TS
 $_i$,
 $i$th transmitted shock; RW, rarefaction wave; TRW, transmitted rarefaction wave; CW, compression wave; IRW, inward-moving rarefaction wave.

The necessary physical quantities to employ the model (2.23) to predict the perturbation growth can be obtained via the base flow, including the interfacial trajectory  $r_i(t)$, the post-shock Atwood number
 $A_{T,i}$, the expansion rate
 $c_i$ and the value of the interface's
 $j$th velocity jump
 $\Delta V_j$ induced by the
 $j$th wave, which are listed in table 2. Note that the Atwood number at the inner interface
 $A_{T,2}$ has significant effects on the velocity jumps. Specifically, as
 $A_{T,2}$ decreases, the increase of density difference at II
 $_2$ leads to a corresponding increase in the absolute value
 $|\Delta V_1|$ of II
 $_2$ impacted by TS
 $_1$. Moreover, the absolute values
 $|\Delta V_2|$ of II
 $_1$ induced by the RW and of II
 $_2$ induced by the CW are also more prominent. This is due to the fact that the RW and CW are enhanced as
 $A_{T,2}$ decreases and the density difference at II
 $_2$ increases.
4.2. Validation of the model
Following the experiments of Liang & Luo (Reference Liang and Luo2022a), two typical cases in which the phase differences between two perturbed interfaces are  $0$ and
 ${\rm \pi}$, corresponding to in-phase (IP) cases and anti-phase (AP) cases, respectively, are performed to examine the instability evolutions of the three layers. The ratio of initial perturbation amplitude to wavelength is fixed at
 $0.02$ to satisfy the small-perturbation assumption, and two wavenumbers are chosen as
 $n=6$ and
 $12$ to verify the applicability of the model to various wavenumbers. The perturbation amplitude
 $\eta _i$ is defined as
 $\eta _i=(r_{\theta =0}-r_{\theta ={\rm \pi} /n})/2 (i=1,2)$ with
 $r_{\theta =0}$ and
 $r_{\theta ={\rm \pi} /n}$ representing the radial locations where
 $Y_{SF_6}=0.5$ along
 $\theta =0$ and
 $\theta ={\rm \pi} /n$ lines, respectively. Further details of the IP cases and AP cases used in this work are listed in tables 3 and 4, respectively, including the beginning
 $t_j^-$ and end
 $t_j^+$ moments of the
 $j$th wave passing through the interface and the perturbation growth rate at
 $t_j^+$, which are necessary for the employment of the model.
Detailed parameters corresponding to the IP cases. Here,  $a_i$ is initial amplitude,
 $\lambda _i$ is initial wavelength,
 $n$ is the wavenumber of the perturbed interface,
 $t_j^-$ and
 $t_j^+$ are the beginning and end moments of the
 $j$th wave passing through the interface,
 $\dot \eta _{i,t_j^+}$ represents the growth rate of the II
 $_i$ at
 $t_j^+$.

Detailed parameters corresponding to the AP cases. Notations can be found in table 3.

As shown in figure 4, the present model (2.23) well captures the perturbation growths of the IP cases with three fluid layers before reshock, which proves the rationality and validity of the model. Note that the present model based on the linear stability analysis is primarily applicable to the linear stage of the perturbation growth. Previous studies (Ding et al. Reference Ding, Li, Sun, Zhai and Luo2019; Sun et al. Reference Sun, Ding, Zhai, Si and Luo2020) have demonstrated that the nonlinear effect of the perturbation growth of a shock-accelerated cylindrical fluid layer becomes significant after the collision of reshock on the interface. Therefore, the end time of the present model is chosen as the moment when the reshock meets the perturbed inner interface. It is obvious that the  $\eta _1$ of the three layers in the IP cases with
 $n=6$ almost collapses together until the RW passes through II
 $_1$. After the RW collides with II
 $_1$,
 $\eta _1$ has almost the same growth in the ASK6 and ASC6 layers that have different
 $A_{T,2}$. In the ASN6 layer in which
 $A_{T,2}$ is smallest,
 $\eta _1$ grows more slowly than that in the ASK6 and ASC6 layers. Moreover, the growth rate of
 $\eta _2$ after the impact of TS
 $_1$ on II
 $_2$ decreases from positive to negative with decreasing
 $A_{T,2}$. As a result,
 $\eta _2$ in the IP cases changes from increasing to decreasing with time with decreasing
 $A_{T,2}$ before reshock.
Temporal variations of the amplitudes of the outer ( $\eta _1$) and inner (
 $\eta _2$) interfaces for the IP cases. The simulation data are marked by symbols and the model results are denoted by lines.

It is shown in figure 5 that the model (2.23) is also verified to show excellent consistency with the DNS results of the perturbation growths of the AP cases with various Atwood numbers and wavenumbers. The effect of  $A_{T,2}$ on the perturbation growths in the AP cases is different from that in the IP cases. Specifically, the growth rates of
 $\eta _1$ after the RW passes through II
 $_1$ and of
 $\eta _2$ after TS
 $_1$ collides with II
 $_2$ increase with decreasing
 $A_{T,2}$. Consequently,
 $\eta _1$ and
 $\eta _2$ in the AP cases have a faster growth as
 $A_{T,2}$ decreases before reshock. Moreover, figure 6 is plotted to show the difference between the previous model (Yuan et al. Reference Yuan, Zhao, Liu, Wang, Liu and Lu2023) and the current one in predicting the perturbation growth of the ASK layer with
 $A_{T,1}=0.706$ and
 $A_{T,2}=-0.375$. It is evident that the previous model deviates from the DNS results and, thus, is inadequate when
 $|A_{T,i}|\neq 1$. In contrast, the present model exhibits a much better agreement with the DNS results. This shows that it is necessary to extend the previous model for the fluid layer in a vacuum to the current one for the cases with arbitrary
 $A_{T,i}$. The above results of the IP and AP cases also indicate that the Atwood number at the inner interface plays an important role in instability evolution of the shock-accelerated cylindrical fluid layer. To this end, the effect of Atwood number at the inner interface is further investigated in the following subsection.
Temporal variations of the amplitudes of the outer ( $\eta _1$) and inner (
 $\eta _2$) interfaces for the AP cases. The simulation data are marked by symbols and the model results are denoted by lines.

Temporal variations of the amplitudes at the outer ( $\eta _1$) and inner (
 $\eta _2$) interfaces of the ASK layer with
 $A_{T,1}=0.706$ and
 $A_{T,2}=-0.375$ for the IP and AP cases before reshock. The simulation data are marked by symbols. The results calculated by the previous model (Yuan et al. Reference Yuan, Zhao, Liu, Wang, Liu and Lu2023) and the current one are marked by the solid and dashed lines, respectively.

4.3. Effect of Atwood number at the inner interface
To elucidate the underlying mechanisms of the effect of Atwood number at the inner interface, various effects that contribute to the perturbation growth of three IP cases with  $n=6$ are specified via the model (2.23) as plotted in figure 7. It is clearly seen that with the decrease of
 $A_{T,2}$, the contribution of the RM instability to
 $\eta _1$ weakens after the RW collides with II
 $_1$. This is due to the fact that the strength of the RW increases with the decrease of
 $A_{T,2}$. Specifically, as observed from schlieren images in figure 8(a), the collision of IS
 $_0$ with II
 $_1$ is a standard RM instability in which an unperturbed shock impacts upon a perturbed interface (Richtmyer Reference Richtmyer1960; Meshkov Reference Meshkov1969). Since the strength of IS
 $_0$ and
 $A_{T,1}$ are the same in the three layers,
 $\eta _1$ first suffers the same quick drop at
 $t=0$ under the compression effect of IS
 $_0$ and then increases due to the RM instability by the vorticity deposited by IS
 $_0$ on II
 $_1$. However, decreasing
 $A_{T,2}$ leads to a greater density difference at the inner interface and then to a stronger RW. The stronger RW impinging on II
 $_1$ results in a stronger RM instability. Figure 8(c) shows that the RW has the same phase as II
 $_1$ and a greater amplitude than II
 $_1$. Therefore, the RW first encounters the crest of II
 $_1$ whose inward radial velocity is accelerated to a greater value than the trough. This radial velocity difference produces a quick drop in
 $\eta _1$ at
 $t\approx 0.25$. As
 $A_{T,2}$ decreases, this drop is increasingly prominent due to the increasing strength of the RW. Note that the RW deposits vorticity on II
 $_1$ opposite to the IS
 $_0$. Consequently, with decreasing
 $A_{T,2}$ and an increasing strength of the RW, the greater cancellation on the original vorticity results in the fact that the contribution of the RM instability to
 $\eta _1$ weakens after the passage of the RW. For the contribution of the RT effect to
 $\eta _1$, the RW accelerates the inward movement of II
 $_1$ and the II
 $_1$ is RT unstable. Therefore, after the RW impinges on II
 $_1$, the
 $\eta _{RT}$ has a positive value that is more significant with the decrease of
 $A_{T,2}$ shown in figure 7(a,c,e). Moreover, the contributions of the thin-shell correction and the interface coupling effect, especially in the ASN layer, are gradually significant after the RW accelerates II
 $_1$ inwards. This is attributed to the fact that the terms of
 $\eta _{Thin}$ and
 $\eta _{Cou}$ are sensitive to the acceleration of the interface. When
 $A_{T,2}$ decreases, the interfacial acceleration of II
 $_1$ increases, thus leading to the increasing contributions of
 $\eta _{Thin}$ and
 $\eta _{Cou}$. In addition, the compressibility effect is not significant for
 $\eta _1$ of the IP cases under the present incident shock strength. The compression/decompression effect contributes to
 $\eta _1$ only when the waves pass through II
 $_1$. The above analysis about various contributions to
 $\eta _1$ shows that the decrease of
 $A_{T,2}$ and enhancement of the RW weaken the contribution of the RM instability, thus, the
 $\eta _1$ of the ASN layer grows slower than that of the ASK and ASC layers.
Temporal variations of total amplitudes along with their decomposed contribution terms of the outer ( $\eta _1$) and inner (
 $\eta _2$) interfaces for the IP cases with (a,b) ASK layer, (c,d) ASC layer and (e,f) ASN layer. The simulation data are marked by symbols and the model results are denoted by lines.

Schlieren images showing the development of wave patterns and interfacial morphologies visualized by the  $|\boldsymbol {\nabla }\rho |$ contours for the ASC layer with
 $n=6$. The top rows (a–d) represent the IP case and the bottom rows (e–h) denote the AP case.

It is expected that with decreasing  $A_{T,2}$, the strength of the CW generated by the collision of the RW with II
 $_1$ increases, which has an influence on the growth of
 $\eta _2$. As depicted in figure 7, the growth of
 $\eta _2$ mainly relies on the RM instability whose contribution to
 $\eta _2$ decreases from positive to negative with decreasing
 $A_{T,2}$. It is clearly seen in figure 8(b) that TS
 $_1$ has the same phase as II
 $_2$ and a smaller amplitude than II
 $_2$. As a result, the TS
 $_1$ colliding with II
 $_2$ leads to a sudden decrease of
 $\eta _2$ at
 $t\approx 0.12$, and introduces an IP perturbation growth rate at
 $\eta _2$ under the domination of the cylindrical BP effect (Yuan et al. Reference Yuan, Zhao, Liu, Wang, Liu and Lu2023). The
 $\eta _{RM}$ has a slight increase with time until the CW collides with II
 $_2$. As depicted in figure 8(d), the CW has the same phase as II
 $_2$ and deposits vorticity on II
 $_2$ by baroclinic processes to affect the growth of
 $\eta _{RM}$. With decreasing
 $A_{T,2}$ and an increasing strength of the CW, the contribution of the RM instability to
 $\eta _2$ after the passage of the CW decreases from positive to negative. The RT effect is also influenced by the
 $A_{T,2}$. Since the stronger CW leads to greater inward acceleration at the heavy/light interface II
 $_2$, the RT-stable II
 $_2$ has a more significant negative contribution from the RT effect as
 $A_{T,2}$ decreases. Furthermore, as the strength of the CW increases, the contribution of the thin-shell correction
 $\eta _{Thin}$, sensitive to the acceleration of II
 $_2$, decreases from positive in the ASK layer to negative in the ASN layer, and the contribution of the interface coupling effect
 $\eta _{Cou}$, also sensitive to the acceleration of II
 $_2$, increases from negative in the ASK layer to positive in the ASN layer. Additionally, the inner fluid of II
 $_2$ is lighter and more increasingly compressible as
 $A_{T,2}$ decreases and, thus, the compressibility effect
 $\eta _{Com}$ has an increasing contribution to promote the growth of
 $\eta _2$. The above analysis indicates the decrease of
 $A_{T,2}$ and enhancement of the CW significantly affect various contributions to the growth of
 $\eta _2$ in the IP cases, and the decreasing contribution of the RM instability mainly determining the growth of
 $\eta _2$ results in the change of the growth of
 $\eta _2$ from increasing to decreasing with time.
The effect of the Atwood number at the inner interface on the instability evolutions in the AP cases is also investigated. Figure 9 shows various contributions to the perturbation growths of the outer and inner interfaces. For the outer interface in the AP cases, the contribution of the RM instability is enhanced by decreasing  $A_{T,2}$, which is different from the diminished RM contribution in the IP cases. This is due to the fact that the AP collision between TS
 $_1$ and II
 $_2$ causes the AP impact of the generated RW with II
 $_1$ as shown in figure 8(f,g). On the one hand, the RW firstly impacts upon the trough of II
 $_1$ that consequently obtains a greater inward radial velocity than the crest. This radial velocity difference produces the quick increase of
 $\eta _1$ at
 $t\approx 0.2$, which is the decompression effect of the RW. The strength of the RW increases with decreasing
 $A_{T,2}$ and, thus, the decompression effect of the RW is more significant at lower
 $A_{T,2}$, as shown in figure 9(c,e). On the other hand, the RW produces vorticity deposition with the same direction as the vorticity deposited by the initial IS
 $_0$ on II
 $_1$. With decreasing
 $A_{T,2}$ and an increasing strength of the RW, more vorticity is deposited on II
 $_1$ and the contribution of the RM instability
 $\eta _{RM}$ is enhanced. Sharing the same base flow with the IP cases, the AP cases have the same time-varying trends of
 $\eta _{RT}$ and
 $\eta _{Thin}$ as the corresponding IP cases. Note that the interface coupling effect depends on not only the motion of the interface itself but also the perturbation at another interface. These complex factors make
 $\eta _{Cou}$ always decrease to suppress the growth of
 $\eta _1$ for the AP cases and the negative contribution of
 $\eta _{Cou}$ is enhanced with decreasing
 $A_{T,2}$. Additionally, the compressibility effect
 $\eta _{Com}$ always has a negative contribution to the growth of
 $\eta _1$ and is less affected by
 $A_{T,2}$. According to the effect of
 $A_{T,2}$ to various contributions, the reason for increasing growth of
 $\eta _1$ with decreasing
 $A_{T,2}$ is that the main contribution to
 $\eta _1$ is the enhanced RM instability as
 $A_{T,2}$ decreases.
Temporal variations of total amplitudes along with their decomposed contribution terms of the outer ( $\eta _1$) and inner (
 $\eta _2$) interfaces for the AP cases with (a,b) the ASK layer, (c,d) the ASC layer and (e,f) the ASN layer. The simulation data are marked by symbols and the model results are denoted by lines.

For the inner interface of the AP cases, due to the compression effect of TS $_1$,
 $\eta _2$ increases quickly to 0 at
 $t\approx 0.12$ and then grows towards the opposite direction compared with its initial phase. This phenomenon, induced by the vorticity deposited by TS
 $_1$ on II
 $_2$, is known as phase reversal (Brouillette Reference Brouillette2002). This phase reversal is followed by collision of the CW with II
 $_2$. As shown in figure 8(g), the CW reflecting from the trough of II
 $_1$ collides with II
 $_2$ whose corresponding part is accelerated to move inwards while the rest of II
 $_2$ still keeps its original radial velocity. Thus, this radial velocity difference leads to a slight AP growth rate of
 $\eta _2$ at
 $t\approx 0.25$. Besides, the CW also deposits vorticity with the same direction as the vorticity deposited by TS
 $_1$ on II
 $_2$. With decreasing
 $A_{T,2}$ and an increasing strength of the CW, more vorticity is produced on II
 $_2$ and, thus, the RM instability has a stronger contribution to
 $\eta _2$. Moreover, the contributions of the RT effect and thin-shell correction can be neglected and are less affected by
 $A_{T,2}$, as shown in figure 9(b,d,f). The interface coupling effect has a negative contribution to the growth of
 $\eta _2$ and is enhanced by decreasing
 $A_{T,2}$. Like the growth of the outer interface, the faster growth of the inner interface in the AP cases with decreasing
 $A_{T,2}$ is caused by the stronger RM instability.
5. Concluding remarks
Instability evolution of a shock-accelerated cylindrical fluid layer with two interfaces separating three arbitrary-density fluids is theoretically and numerically investigated. A novel model to describe the instability evolution of a shock-accelerated cylindrical fluid layer with arbitrary Atwood numbers is established. Specifically, a linear stability analysis for the incompressible fluid layer is employed to obtain the contributions, including RM instability, RT effect, thin-shell correction and interface coupling effect at two interfaces with arbitrary Atwood numbers. Then the compressibility effect and compression/decompression effects of waves reverberated inside the fluid layer are linearly superimposed on the incompressible model, which makes the novel model able to predict the instability evolution of a shock-accelerated cylindrical fluid layer with arbitrary Atwood numbers. The present model's validity has been established by comparing its results with the DNS of three different fluid-layer configurations. In these configurations the outer and intermediate fluids remain fixed (i.e.  $A_{T,1}$ is fixed) and the density of the inner fluid is reduced. The results demonstrate that the model effectively captures the temporal evolutions of the perturbation amplitudes.
The influence of the Atwood number at the inner interface on the instability evolution of the shock-accelerated cylindrical fluid layer has also been examined. In IP cases where the initial IP perturbations are applied to the inner and outer interfaces, it has been observed that the growth rate of  $\eta _1$ decreases with decreasing
 $A_{T,2}$. Additionally, the growth of
 $\eta _2$ exhibits a transition from increasing to decreasing with time as
 $A_{T,2}$ decreases. For AP cases with initial AP perturbations at the inner and outer interfaces, both the increasing growths of
 $\eta _1$ and
 $\eta _2$ with time are enhanced with decreasing
 $A_{T,2}$. By utilizing the model to analyse the effect of
 $A_{T,2}$ on each contribution to the instability evolution, it has been discovered that the dominant contribution from the RM instability is greatly influenced by
 $A_{T,2}$, resulting in the above observations. As
 $A_{T,2}$ decreases, the density difference at the inner interface increases. This increased density difference leads to the stronger waves reverberated inside the layer, i.e. the CW and RW. The stronger RW and CW produce more vorticity deposition in the opposite direction compared with the vorticity deposited by the incident shock on II
 $_1$ and II
 $_2$ in the IP cases, and more vorticity deposition in the same direction as the vorticity deposited by the incident shock on II
 $_1$ and II
 $_2$ in the AP cases. Consequently, as
 $A_{T,2}$ decreases, the increasing perturbation growth with time is weakened in the IP cases and enhanced in the AP cases.
The current model is capable of describing the instability evolution of a shock-accelerated cylindrical fluid layer with arbitrary Atwood numbers. In the future, the model can be employed to reveal the underlying mechanism behind more parametric effects on the instability evolutions of shock-accelerated cylindrical fluid layers. Moreover, the present model still relies on the numerical or experimental data to obtain the post-wave growth rate of the perturbation. Quantifying the relationship between the post-wave perturbation growth rate and the intensity of each type of wave based on numerical simulations or experiments to further improve the present model would be an intriguing and worthwhile topic for future investigation.
Acknowledgements
The authors are very grateful to Dr Y.-S. Zhang at the Institute of Applied Physics and Computational Mathematics for useful discussions on the algorithm and code.
Funding
This work was supported by the National Natural Science Foundation of China (Nos. 12202436, 12388101, 92052301, 12272371, 92252202, 12293000 and 12293002), by Science Challenge Project, by LCP Fund for Young Scholar (No. 6142A05QN22002) and by the Strategic Priority Research Program of the Chinese Academy of Sciences (No. XDB0500301).
Declaration of interests
The authors report no conflict of interest.
Appendix. Further validation of the present model
It has been verified in § 4 that the current model (2.23) is capable of accurately describing the perturbation growth of a shock-accelerated cylindrical fluid layer with a fixed outer interface characterized by a light/heavy configuration. To further validate that the current model is suitable for layers with arbitrary configurations (or arbitrary  $A_{T,i}$), DNS has also been conducted for two cases with the outer interface characterized by a heavy/light configuration. Specifically, these two cases, namely SF
 $_6$/air/Kr (SAK) and SF
 $_6$/Kr/air (SKA), are characterized by the outer interfaces with the post-shock Atwood numbers of
 $-0.688$ and
 $-0.343$, respectively. The perturbed interfaces of the layer for these two cases are IP. Detailed parameters for the base flow are listed in table 5 and the parameters for the perturbed SAK and SKA layers are shown in table 6. The remarkable agreement depicted in figure 10 indicates that the present model (2.23) can describe the perturbation growth of a fluid layer with an outer interface characterized by a heavy/light configuration. Moreover, the present model is able to successfully capture the phase inversion of the outer interface as demonstrated in figure 10(a,c), and accurately describes the various contributions to the perturbation growths at both the outer and inner interfaces.
Detailed parameters corresponding to the base flow of SAK and SKA layers with  $\alpha _0=1.111$. Notations can be found in table 2.

Detailed parameters corresponding to perturbed SAK and SKA layers. Notations can be found in table 3.

The perturbation amplitudes of the outer ( $\eta _1$) and inner (
 $\eta _2$) interfaces on the (a,b) SAK layer, (c,d) SKA layer along with their decomposed contribution terms versus time for the IP case before reshock. The simulation data marked by symbols are added for comparison.



