

TO maximize their soft power, governments have an interest in maintaining good relations with foreign publics.Footnote 1 Their ability to achieve this goal depends in part on effective diplomatic communication and, more generally, engaging in successful public diplomacy.Footnote 2 This article examines one facet of this larger phenomenon of public diplomacy: the use of political apologies. To what extent do they help to garner public approval, and why?
Leaders have long used apologies as part of their arsenal of public diplomatic communication.Footnote 3 In the East Asian context, “apology diplomacy” over wartime legacies is a salient feature of contemporary interstate relations.Footnote 4 Prime Minister Junichiro Koizumi observed the sixtieth anniversary of Japan’s World War II surrender by issuing an apology for Japan’s past militarism in the region, with the aim of placating China and South Korea.Footnote 5 And in 2016, President Barack Obama’s announcement of his plan to visit Hiroshima revived public debates over apologizing for deploying atomic weapons in Hiroshima and Nagasaki.Footnote 6
Although broad agreement exists about the rise in the use of apologies in the 1990s—dubbed by scholars the “age of apology”Footnote 7—the effectiveness of apologies in winning public goodwill across different audiences remains unclear. Conventional scholarly accounts tout the political apology’s ability, or at least its potential, to mend interstate or intergroup relations by signaling peaceful policy intentions or a commitment to international norms.Footnote 8 Yet the same apologies that are hailed as critical for improving foreign relations can sometimes alienate domestic groups. For instance, Japanese apologies over World War II, issued in the 1990s, were meant to mend relations with South Korea but incensed Japanese citizens.Footnote 9 Similarly, a 2019 UK proposal to apologize to India for the darkest chapters of British colonial history became a flashpoint in the House of Lords while simultaneously raising hopes among those in India who had long pressed for an official British acknowledgment.Footnote 10
We contend that this mixed evidence stems from two main gaps in the literature. First, few studies holistically consider both the domestic and international repercussions of an interstate apology. The asymmetric effects of apologies across various audiences remain an underappreciated and undertheorized aspect of apology diplomacy, although more general scholarship in international relations addresses how audience costs constrain leaders.Footnote 11 Second, the apologies scholarship often addresses reconciliation as a broad outcome, yet few studies directly identify the effect of apologies on the political dimensions of this concept. Existing studies instead tend to conceptualize and operationalize “reconciliation” in a way that conflates political approval with broad social repair, forgiveness, and psychological healing.Footnote 12 Although these are important outcomes, the objective of apology diplomacy, in particular, is to improve relations between polities, which may include winning political approval without obtaining the deep, long-term psychological outcome of healing and forgiveness.
To address these gaps, we develop and test a theory of interstate apology-making as a form of strategic communication between states and audiences at home and abroad. We use the term “apology-making” to refer to either political apologies or expressions of remorse, where a political apology is an official public speech act or statement issued by a government (the apologizer) to a foreign country (the recipient) that acknowledges responsibility for a past political offense committed by the apologizer state against the recipient state or its members. In addition, we examine the related role played by an expression of remorse that signals regret from the perspective of the apologizer.Footnote 13
We argue that the effects of apology-making on public approval of a government are asymmetric across audiences in apologizing and recipient states and that this asymmetry can be understood through two sets of attributes that shape individuals’ responses: (1) hierarchical group dispositions—that is, individuals’ tendencies to view social groups in terms of hierarchies and their group’s place within them; and (2) the perceived value of relations between the two states involved. On the one hand, in the recipient nation, we expect the public to be generally receptive, viewing apology-making as addressing grievances plaguing intergroup relationships or as preserving the benefits of existing relations with the apologizing nation. On the other hand, these two sets of factors yield mixed predictions about how different audiences within the apologizing nation will react. Specifically, any positive effect of apology-making on public approval of the apologizing government will be significantly reduced among citizens who exhibit strong hierarchical group dispositions—nationalism, social-dominance orientation, or political conservatism—compared to those with weak such dispositions. The benefits will also diminish among those who see little advantage in conceding to a recipient state that is not a strategically important ally. These individual-level factors therefore explain the divergent effects of apology-making across the two states and reveal its potential to polarize audiences within the state seeking to acknowledge a historic wrong.
We tested our argument using large-scale survey experiments in Japan and the United States that manipulated the level and nature of apology-making in vignettes (hypothetical news articles) invoking World War II events in Japan and South Korea. This methodological approach is appropriate for testing our theoretical claims about individual-level, rather than state- or group-level, variation in the effects of apologymaking and has the additional advantage of overcoming inferential issues arising from governments’ strategic decisions to apologize in some cases but not in others.Footnote 14 In line with our theory, our experimental evidence demonstrates the sometimes-countervailing costs and benefits of apology-making. Apologies and expressions of remorse can garner favor with audiences in the recipient state. But they are significantly less successful at winning citizens’ approval of their government in the apologizing state, sometimes even provoking a backlash. We show that this backlash is explained by individuals’ views regarding an implicit hierarchy of social groups and their beliefs about the value of bilateral relations.
These findings advance our theoretical and empirical understanding of apology diplomacy in several ways. In contrast to the majority of studies, which primarily focus on emotional outcomes of apologies,Footnote 15 our analytical focus on public approval of a government provides a potential missing link between political apologies and broader interstate cooperation. Importantly, the ability of apology-making to improve mass public approval hinges on individual-level attributes, which existing scholarship has largely overlooked in favor of evaluating context-specific features of the apologies themselves.Footnote 16 Through theory and evidence on the heterogeneity across individuals, this article challenges the prevalent view of political apologies as predominantly positive tools for mending interstate relations and highlights their multifaceted effects across different populations. The evidence has implications for our understanding of when leaders offer—and withhold—apologies for historical grievances, which are often viewed as obstacles to international cooperation.Footnote 17
Methodologically, this is the first experimental test of how an interstate apology can simultaneously affect domestic and foreign public opinion. This approach complements existing scholarship that uses in-depth qualitative cases, which provide rich historical depth but are less suited to testing causal hypotheses related to variation among individual-level attributes.Footnote 18 Indeed, our findings underscore the need to more fully bring microfoundations—especially the role of individuals’ psychological dispositions and beliefs—into existing scholarship on apology diplomacy. In this, we join a broader literature on the microfoundations of political communication in foreign affairs.Footnote 19 The conclusion further discusses these contributions, as well as implications for the study of leader behavior in public diplomacy.
I. A Theory of Interstate Apology-Making
The study of apologies has traditionally focused on descriptive or normative features of apologiesFootnote 20 in relation to outcomes like forgiveness or a sense of justice among victims.Footnote 21 We investigate instead the role of apology-making as a political tool: a form of strategic communication by governments seeking to win mass public approval. Further, we focus on interstate political apologies rather than on interpersonal or intergroup apologies. Below, we build on relevant scholarship across political science, history, sociology, and social psychology to theorize and generate hypotheses regarding the effects of apologies on domestic and foreign public opinion. We illustrate the theoretical intuitions through examples from scholarly and journalistic accounts, although doing so is not meant as a formal test of our argument.
Why Do Apologies and Expressions of Remorse Win Approval in the Recipient Country?
Scholars argue that apologies for past injustice can resolve tensions between the offender and the victimized by offering a “a symbolic defrocking”Footnote 22 and signaling new, peaceful policy intentions, and thereby reducing the perceived threat among victims.Footnote 23 In democratizing states, the act of apologizing for past violence is often central to broader transitional justice efforts aimed at achieving political and social reconciliation, as occurred when South Africa emerged from apartheid.Footnote 24 In the case of interstate apologies, historians and social scientists often credit Germany’s public contrition for World War II atrocities with promoting reconciliation among European nations.Footnote 25 Others argue that Japan, in contrast to Germany and France, failed to undergo a deep reckoning over wartime atrocities, raising suspicions about Japan’s foreign policy intentions and undermining prospects for reconciliation with its neighbors.Footnote 26 Consistent with this view, a survey study of Australian, Malaysian, and Filipino participants found that those who believed, correctly, that Japan had formally apologized for military aggression were more willing than apology-deniers to forgive the country.Footnote 27 More generally, even as explicit refusals to apologize are rare, governments and leaders are often criticized for staying silent or not responding to a call for an apology.Footnote 28
Thus, from the standpoint of the recipient, apologies are primarily a positive act. For members of victimized groups, apologies can powerfully symbolize recognition of a past injustice.Footnote 29 Apologies are a step toward mending a past harm.Footnote 30 From a broader political perspective, apologies offer a show of goodwill between countries and help to alleviate suspicions about the apologizer’s intentions toward the recipient state. We therefore expect the following:
—H1. Political apologies increase public approval of the apologizer government in the recipient country.
Another key insight of past studies, however, is that not all apologies are created equal. Although on the one hand, the acknowledgment of responsibility for a past harm is a minimal requirement for apologies in general, scholarly and popular accounts suggest that the most effective apologies further convey remorse or deep regret.Footnote 31 An apology that is perceived to be lacking this quality, on the other hand, is unlikely to satisfy victim groups.Footnote 32 Bill Clinton’s offer of condolences for unarmed Korean refugees whom American soldiers shot in the early stages of the Korean War, for example, fell short. Korean survivors argued for “a more sincere apology, not a vague statement of regret, from the U.S. government.”Footnote 33 Similarly, Asian women forced into sexual slavery by the Japanese army during World War II have repeatedly rejected compensation by private foundations in favor of a heartfelt apology.Footnote 34
Indeed, a formal apology and an expression of remorse can each exist without the other. Japanese official statements regarding World War II atrocities are typically labeled “quasi-apologies” for failing to adequately invoke the moral vocabulary of remorse. But some Japanese apologies have also been criticized for omitting an acknowledgment. When Prime Minister Shinzo Abe on the seventieth anniversary of Japan’s defeat publicly addressed Japanese soldiers’ brutal treatment of prisoners of war and the mass rape of Chinese women at Nanking, his speech expressed remorse—“I bow my head deeply before the souls of all those who perished both at home and abroad…. I express my feelings of profound grief and my eternal, sincere condolences”—but pointedly omitted an acknowledgment of Japanese responsibility.Footnote 35 The United States has engaged in a similar diplomatic strategy regarding its use of atomic bombs in Japan. In his visit to Hiroshima, Obama delivered a sympathetic and emotional speech but sought to avoid signaling that the visit amounted to an apology.Footnote 36
The above cases imply that an apology may be more effective when it is accompanied by a clear expression of remorse, which may be implicit in some apologies, but not all. To disentangle the effects of apologies as such and of expressions of remorse, we therefore test two additional hypotheses:
—H2. Expressions of remorse will increase public approval of the apologizer government in the recipient country.
—H3. The positive effect of an apology on the recipient country’s public approval will be greater when it is accompanied by an expression of remorse.
In hypotheses 1-3, we do not predict whether an expression of remorse serves as a substitute for an official apology, but we explore this possibility in the empirical analysis.
Saying “Sorry” and the Potential for Domestic Backlash
Domestic audiences in the apologizing state, like those in the recipient country, may value building goodwill through apology-making. But historical and journalistic accounts provide numerous examples of apologies backfiring at home and requiring an explanation. Tony Blair’s 1997 apology to Ireland for the UK’s role in the nineteenth-century potato famine was widely criticized by historians and the media as opening the door for Ireland, as the Daily Telegraph wrote, to “place the blame for all the country’s ills at the door of the Brits, ultimately justifying terrorism.”Footnote 37 Similar fears about an apology bringing “ruin” drove political groups across Europe that mounted stiff opposition against attempts to confront past collaboration with the Nazis.Footnote 38 Concerns about offending World War II veterans dissuaded Obama from issuing an apology over the use of atomic bombs in Japan, particularly in light of criticism during his 2012 reelection campaign for having gone on an “apology tour” in 2009 that seemed to acknowledge missteps in US foreign policy.Footnote 39
These accounts point to an implicit but undertheorized pattern. Apology-making can alienate certain domestic constituencies even while boosting public approval abroad. But which domestic constituencies? We argue that considerations that diminish or even reverse an apology’s upsides are most likely among two kinds of citizens in the apologizer state: those with strong hierarchical group dispositions and those who see little value in bilateral relations between apologizer and recipient.
hierarchical group dispositions
A government apology can be a potent symbol, invoking the moral, ideological, and distributive claims of different groups.Footnote 40 As such, an apology can amplify a sense of us-versus-them, creating skepticism among those who perceive their group’s values to be under attack. Although individuals can identify with many different groups at any given time, we argue that three such dispositions are especially relevant for interstate apology-making. First is identification with the nation. Nationalistic sentiment is a key source of contention over the way a country’s history of conflict is reflected in school textbooks,Footnote 41 judicial proceedings,Footnote 42 and political discourse.Footnote 43 For individuals with strong nationalist sentiments who view their country as superior and dominant,Footnote 44 apology-making may pose a direct challenge to their positive perceptions of their nation’s identity and values. Further, these nationalists may believe that recognition of injustice to nonnationals weighs less, on balance, than the priorities of their own nation.Footnote 45
Second, social and political psychology research demonstrates that those who exhibit greater social-dominance orientation—that is, those who consider a group identity to demarcate and justify social hierarchies—think, behave, and support policies in ways that benefit and protect such hierarchies.Footnote 46 Those exhibiting greater social-dominance orientation, then, may be less inclined to accept an official apology that is offered to another nation, a clear out-group. For example, in a 2019 survey study of Japanese participants, preferences for group-based hierarchies were correlated with weaker support for government apologies to foreign countries on issues like the ecological consequences of the 2011 Fukushima nuclear disaster.Footnote 47
Third, political conservatism provides another source of skepticism toward apology-making to another nation. Unlike in liberalism, an important strand in conservative thinking privileges the idea of an individual being rooted in a communal sense of identity.Footnote 48 In a similar vein, research in moral psychology shows that conservatives are more likely than liberals to draw from in-group loyalty as a fundamental moral value.Footnote 49 Given the special importance in popular conservative discourse of a nation’s history and its representation, an interstate political apology that corrects the dominant historical narrative of the apologizer nation may be taken as pernicious.Footnote 50 Conservative groups in the United States,Footnote 51 the UK,Footnote 52 and Mexico,Footnote 53 among other countries, have recently protested attacks on their understanding of their nation’s history.
In sum, what unites nationalism, social-dominance orientation, and conservatism is a core belief in intergroup distinction and hierarchy. Nationalists tend to view their nation as superior to others; socialdominance oriented individuals wish to preserve their group’s superior hierarchical position; conservatives, although valuing authority and tradition, draw on special responsibilities to the in-group as an anchoring moral value. The three traits all therefore provide foundations for why individuals may perceive apology-making as an affront to their deeply held group values, making them more likely to disapprove of or even to reject their government’s apology-making to a foreign nation.
beliefs about the strategic value of bilateral relations
Interstate apology-making could also provoke concerns about national security and interstate politics more generally. In contrast to hierarchical group dispositions, which tend to be deeply held beliefs rooted in individual psychology and values, these concerns stem from people’s pragmatic perceptions of strategic relations at the state level.
Specifically, we contend that citizens will be more supportive of a political apology or an expression of remorse if they believe that it is being issued to a country of political importance. They may think such measures prudent to repair relations with a formal ally or a key strategic partner. For example, Japanese citizens have long had a favorable opinion of the United States and, in a 2016 poll, a striking 95 percent said that the future development of US-Japan relations was “important” for the region.Footnote 54 The public’s recognition of Japan’s vital interest in maintaining and enhancing cooperation with the United States may have provided the receptive domestic audience needed for Abe to express “deep repentance” to the American people over Japan’s role in World War II.Footnote 55
A long theoretical tradition analyzes how states behave to maximize their security interests;Footnote 56 more recent research shows that individual citizens adopt, to some extent, instrumental foreign policy preferences as well. For example, Daniel Drezner’s analysis of observational and experimental survey data reveals that a surprisingly large part of the public embraces realpolitik regarding international affairs.Footnote 57 Appealing to strategic interests can therefore help leaders to convince the public to support costly alliance policies, persuading citizens by invoking “the logic of consequences.”Footnote 58 We thus hypothesize that citizens are generally more permissive of their government apologizing or displaying remorse over a past harm to a strategically valuable ally than to a rival or even a neutral nation.
Some might wonder about the relationship between the hierarchical group dispositions and strategic-relations factors. People exhibiting strong social-dominance orientation may be less likely to think that they are getting something out of a bilateral alliance because they are more disposed to seeing relationships as hierarchical rather than as interdependent. Nevertheless, there are strong conceptual and empirical reasons to believe that these two attributes function in distinct ways. The dispositional indicators—nationalism, social-dominance orientation, and conservatism—tap into individuals’ deeply held convictions, often with a moral or value-based foundation, regarding the world and their group’s place within it. Such dispositions are relatively sticky,Footnote 59 whereas people’s beliefs about a relationship’s strategic value are more readily influenced by short-term circumstances, including geopolitical and economic events.Footnote 60 Consider, for example, US perceptions of the need to strengthen ties with Japan to “offset China’s power”; the proportion of people holding this view increased by 11 percentage points in just a decade, from 2008 to 2018.Footnote 61
Our survey data also show a high correlation among nationalism, social-dominance orientation, and conservatism, but not between these factors and individuals’ beliefs about the strategic value of the relationship between apologizer and recipient states (see the supplementary material).Footnote 62 Further, as we discuss, our evidence for H4 and H5 below is robust to accounting for the correlation between the two sets of variables through multivariate regression analysis. Thus, although people’s hierarchical group dispositions may overlap to some extent with their perceptions about the strategic benefits of interstate relations, our conceptualization and evidence provide a basis for treating them as distinct moderators.
We therefore test two additional hypotheses:
—H4. The effect of apologizing/expressing remorse will be smaller among members of the apologizing state who exhibit strong hierarchical group dispositions (higher levels of nationalism, social-dominance orientation, and conservatism).
—H5. The effect of apologizing/expressing remorse will be larger among those who see a higher strategic value in the relationship between apologizer and recipient.
Before moving to the research design, we state two caveats about H4 and H5. First, we do not claim these two sets of factors explain all the variation in the effect of apology-making, but we focus on them for the theoretical foundations we described above that suggest that they are especially germane to interstate apology diplomacy. They also apply across diverse regions and time, in contrast to narrower factors, including context-specific histories, that are no doubt important but are less amenable to generalizable theory. Second, our theory does not make a prediction about how the hierarchical group disposition and perceived strategic value variables might moderate the effect of public approval in the recipient country. Although nationalists, for example, may be averse to their state apologizing to another, there is little a priori reason to expect that they would be similarly averse to receiving another country’s apology; the same goes for individuals who are highly social-dominance oriented or who are conservative. Similarly, citizens of a state that has committed a wrong may support an apology to keep the favor of a valuable ally, but this strategic calculation does not symmetrically apply to citizens of a wronged state. For these reasons we do not establish symmetric hypotheses on public approval in the recipient state, although in the supplementary material we show such analyses for completion and transparency.Footnote 63
II. Research Design and Data
A key challenge of identifying the effects of political apologies is that leaders strategically decide whether to issue an apology while considering the potential for domestic and foreign public approval and backlash. We took an experimental approach to mitigate this problem of endogeneity between the occurrence of an apology and public opinion. We conducted a pair of large-scale survey experiments in Japan and in the United States that manipulated the nature of apology-making in hypothetical news articles. The surveys were designed to test the effects of apology-making from the perspective of the apologizer’s and recipient’s domestic audiences. To our knowledge, this is the first experimental test of the effects of political apologies on both foreign and domestic public opinion. By considering both types of audiences simultaneously, we can identify the potentially uneven or dual effects of apologymaking, speaking to the trade-offs leaders face when acknowledging past injustices.
The vignettes in our survey experiments deal with two scenarios—a US apology to Japan and a Japanese apology to South Korea—described below. We take the US-Japan scenario as a starting point due to the countries’ relatively friendly relations over the years, which serve as a hard test for any potential domestic backlash to apology-making. Although the US-Japan context is itself important in terms of both theory testing and policy, we examine the generalizability of the results in the Japan survey by exposing participants to an additional scenario involving Japan-South Korea relations.
Scenario 1: Japanese and US Reactions to a US Apology to Japan
Japanese and US respondents completed scenario 1, which involves the United States apologizing (or not) to Japan for using nuclear weapons during World War II. In this scenario, we measured the public reaction in the recipient country, Japan, and the apologizing country, the United States. The Japan sample consists of 775 adults, drawn using quotas to be nationally representative in terms of gender, age, and political affiliation.Footnote 64 The sample was collected through an online survey programmed by the authors and fielded by Qualtrics in March 2020. The US sample includes 758 adults, drawn from a diverse convenience-sample. The authors fielded this survey online over Amazon Mechanical Turk, also in March 2020. Because the typical Amazon Mechanical Turk sample is slightly younger, more educated, and more liberal than the general population,Footnote 65 we applied statistical weights to adjust for these demographic differences using the procedures that Jens Hainmueller describes.Footnote 66
Japanese and US respondents completed a survey with the same structure and text in their respective national languages. The main parts of the survey were (1) a set of pretreatment moderator questions; (2) a vignette about a potential apology by the United States to Japan over World War II; (3) posttreatment questions asking respondents to evaluate how the United States handled the situation, along with a manipulation check; and (4) some final demographic questions. We used the set of pretreatment moderators to test the conditional effects hypotheses about hierarchical group dispositions and perceived benefits of the bilateral relationship; we describe the procedures on the moderators in detail in our discussion of the results. The supplementary material contains a breakdown of the respondents’ demographics, along with the questionnaire and other auxiliary descriptive statistics.Footnote 67
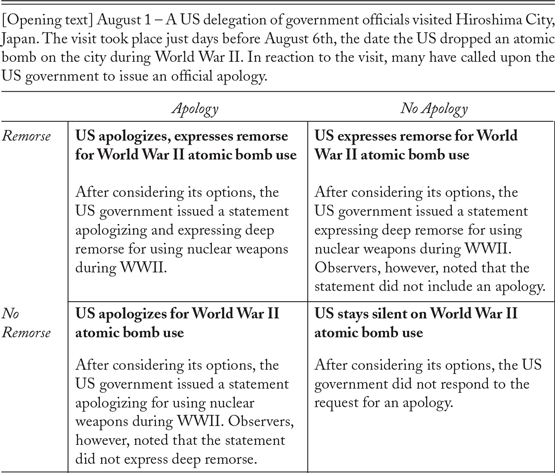
Japanese and US respondents read a hypothetical news story in which a US delegation visit to Hiroshima prompts calls for the United States to address its use of nuclear weapons during World War II. In the news story, we randomized the US government’s reaction using a 2 x 2 design (absence or occurrence of apology x absence or occurrence of remorse). This yielded four conditions: the United States (1) stays silent; (2) apologizes but does not express remorse; (3) expresses remorse but does not apologize; or (4) apologizes and expresses remorse.Footnote 68 The staying-silent response, which reflected how the absence of apology-making is typically covered in the press,Footnote 69 served as the baseline. Because some respondents may perceive remorse to be implicit in an apology, and vice versa, we explicitly noted whether the government response contained one or both elements. Table 1 shows the full vignettes.Footnote 70
Vignettes for Japan-US Experiment (English Version)a
[Opening text] August 1 - A US delegation of government officials visited Hiroshima City, Japan. The visit took place just days before August 6th, the date the US dropped an atomic bomb on the city during World War II. In reaction to the visit, many have called upon the US government to issue an official apology.

a Each group read a different headline, depending on the treatment condition. The opening text in the hypothetical article was identical for all groups and followed the headline. Table cells show the headlines (in bold) and the varying US government responses that follow the opening text.
After viewing the news story, respondents received a question that captures our study’s main dependent variable, approval of the US government response, measured on a seven-point approve-disapprove scale. In the analysis, for ease of interpretation, we collapse this sevenpoint scale into a binary approve or disapprove measure, allowing the effects to be read in terms of percentage points.Footnote 71
Scenario 2: Japanese Reactions to a Japanese Apology to South Korea
We take our analysis further by exploring how the results might differ in another diplomatic context, allowing us to examine whether the effects of apology-making generalize beyond the US-Japan dyad. In our survey of Japanese participants, we included an additional scenario relating to Japan-South Korea relations. The scenario, which 1,567 Japanese respondents evaluated, provides a second case of how domestic audiences of an apologizing country (Japan) may react to their government issuing a political apology (in this case, to South Korea).
To be clear, our main hypotheses do not make predictions about whether and why effects would differ across country cases. One can think of dozens of reasons why Japan and the United States’ relationship is not comparable with Japan and South Korea’s. Instead, analyzing a starkly different case allows for a more robust evaluation of our hypotheses and helps to identify potential scope conditions. Just as important, the second case allows us to test whether our key moderators—hierarchical group dispositions and perceived value of the bilateral relationship—generalize. Nevertheless, in the discussion of the results we reflect on potential reasons for similarities and differences across cases.
Scenario 2 follows the same survey structure as scenario 1. Japanese survey-takers (1) answered pretreatment moderator questions, (2) read a vignette about Japan making an apology (or not) to South Korea over World War II, (3) evaluated the Japanese government’s response (this part of the survey also included a manipulation check), and (4) answered post-outcome demographic questions. The vignettes this time involved wartime atrocities by Japan in South Korea during World War II, including the military institution of ianfu, or “comfort women,” the Japanese euphemism referring to an estimated two hundred thousand Asian women forced into sexual slavery.Footnote 72 This topic provided realism to the vignettes, considering how Japan’s often frosty relations with South Korea are rooted in ongoing disputes over this history.Footnote 73
Respondents read a hypothetical news story about a dispute over harm done by Japan during World War II; Japan was now the potential apologizer state. Here, we used a 2 x 2 x 2 design. The first two factors were the same as those in scenario 1 (apology x remorse). We added an additional independent factor that randomized whether the potential apology was about forced wartime labor or explicitly about “comfort women.” This additional level of randomization helped us to evaluate whether the results would be sensitive to certain triggering phrases. We find, however, that the effects of apologizing and showing remorse are not significantly affected by the issue difference, and so we focus on the results in the aggregate in our analysis below. The vignette texts closely mirror scenario 1 (full vignettes are in the supplementary material).Footnote 74 To maximize the realism and external validity of the vignette, the hypothetical scenarios were modeled after actual news articles.Footnote 75
As with scenario 1, after reading a vignette, the Japanese survey respondents expressed their approval or disapproval for how the Japanese government handled the situation. Again, the outcome was recorded using a seven-point scale, but we present it below using a binary measure for ease of interpretation.
III. Results
Do Political Apologies Affect Domestic and Foreign Opinion?
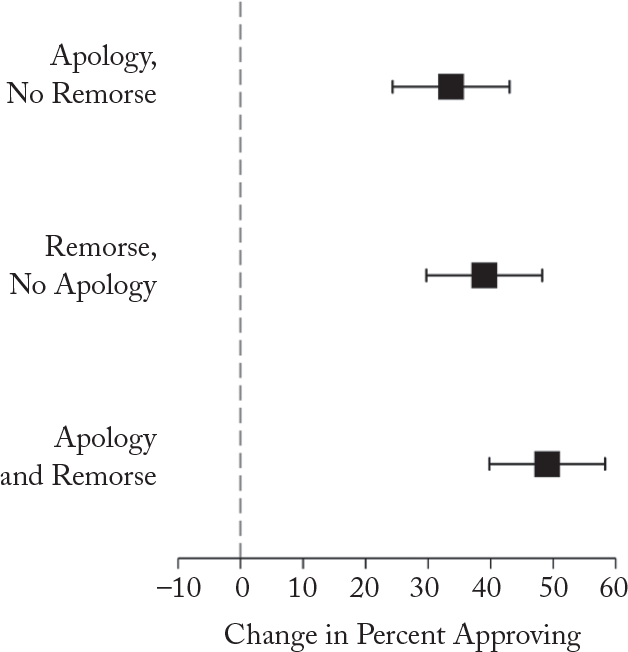
We begin by examining whether apology-making can win the favor of citizens in the recipient state. According to the responses to the first scenario, they do.Footnote 76 As Figure 1 reveals, Japanese citizens express far greater approval when the US government apologizes or expresses remorse compared to when it stays silent. Furthermore, they approve of a US apology with remorse more than they do of either an apology or a show of remorse alone. The differences are positive and statistically significant at the 0.05 level.
US Government Apologies Boost Japanese Approval (Scenario 1: US-Japan)a
aFigure presents the estimates of changes in Japanese approval of the US government from difference in means tests between different kinds of US apologies/shows of remorse versus staying silent (baseline). N = 775; 95 percent confidence intervals are displayed.

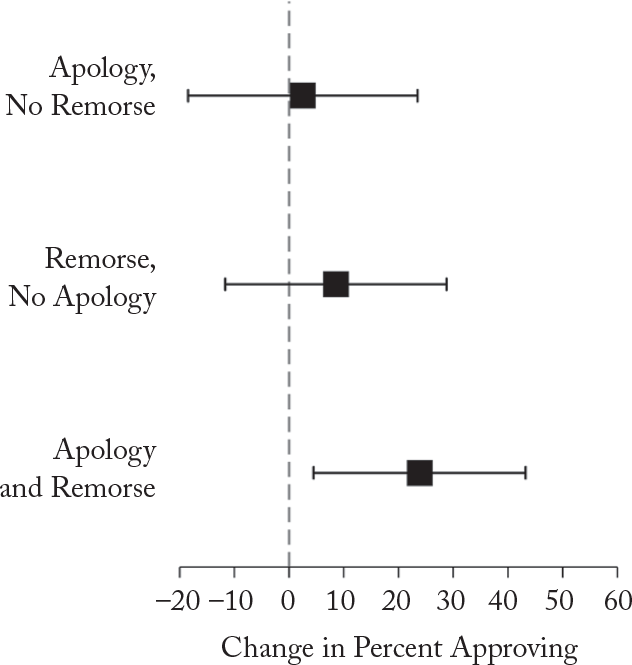
Now we turn to the effect of apology-making on the citizens of the apologizer. Overall, the results tell a less optimistic story about the ability of apologies to garner public approval. In the United States, as Figure 2 shows, apologies without an expression of remorse do not significantly raise domestic public approval compared to staying silent. Expressions of remorse have a modest positive effect (about ten points), but nowhere near the forty-point effect seen in the recipient public sample in Figure 1. Similarly, a statement of apology coupled with an expression of remorse has a positive, but relatively modest, effect.
Tepid Approval among Americans for Official US Apology (Scenario 1: US-Japan)a
aFigure presents the estimates of changes in US approval of the US government from difference in means tests between different kinds of US apologies/shows of remorse versus staying silent (baseline). N = 758; 95 percent confidence intervals are displayed.

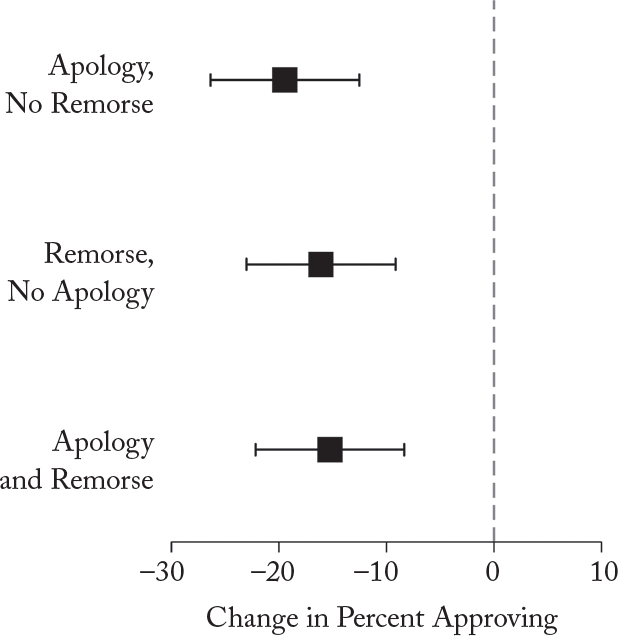
The results thus far support a sanguine narrative about the ability of apologies to bring two nations together, although the benefits of apologizing are primarily on the recipient rather than apologizing side. As we turn to scenario 2, we further see how domestic backlash can manifest in the apologizer’s public. When Japanese survey-takers read that their government apologized to South Korea for Japanese acts during
World War II, they balked. As shown in Figure 3, Japanese apologymaking of any form decreased domestic approval by ten to twenty percentage points.Footnote 77
Japanese Disapprove of Their Government Apologizing to South Korea (Scenario 2: Japan-South Korea)a
aFigure presents the estimates of changes in Japanese approval of the Japanese government from difference in means tests between different kinds of Japanese apologies/shows of remorse versus staying silent (baseline). N = 1,567; 95 percent confidence intervals are displayed.

In sum, we find support for H1-H3. Apologies and expressions of remorse significantly boost approval in the recipient state, and their combination has a greater effect than either component alone. Yet, as the theory suggests, apology-making has an indeterminant effect on the domestic audiences of the apologizer; cross-cutting factors could generate gains but also backlash. The next section on moderators of the apology-making effect delves into this phenomenon.
Hierarchical Group Disposition and Domestic Backlash to Apologizing
Recall our argument that individuals’ hierarchical group dispositions and perceptions about their country’s relationship with another provide distinct sets of reasons why domestic audiences might not reward or might even disapprove of their government for issuing an apology.Footnote 78 We first test our hypothesis on how hierarchical group dispositions moderate the impact of apology-making. Specifically, we expect nationalism, social-dominance orientation, and conservativism—variables that map onto hierarchical group dispositions—to diminish the positive effect of apology-making on domestic public approval.
We created trichotomous scales for each moderating variable for the analysis. To measure nationalism, we split into tertials the average of three nationalism measures. Respondents were asked if they agreed or disagreed with the following three statements: (1) Japanese/Americans are not perfect, but Japanese/American culture is better than other cultures; (2) I would rather be a citizen of Japan/the United States than any other country in the world; and (3) the world would be a better place if people from other countries were more like those in Japan/the United States. These measures draw from the conceptualization of nationalism that Rick Kosterman and Seymour Feshbach outline, which distinguishes nationalism (the view that one’s country is superior and should be dominant) from patriotism (feelings of attachment to one’s country).Footnote 79 In this way, the measures home in on respondents’ us-versus-them sense of national group identity.
Similarly, to measure social-dominance orientation, we split into tertials the average of two indicators. Respondents were asked whether they supported or opposed the following general statements about groups in the world: (1) in setting priorities, we must consider all groups; and (2) we should not push for group equality. We took these measures from Felicia Pratto and coauthors.Footnote 80 The nationalism and social-dominance orientation indicators are standard measures that have been validated in cross-national contexts, allowing us to include them in both the Japan and US surveys.
To measure political ideology, we asked standard left-right ideology questions and created trichotomous scales with the values of left (liberal), center (moderate), and right (conservative).
From these variables, we estimated the conditional average treatment effect of apologizing and showing remorse at each value of the three moderating variables. For the three values of each moderator, we collapse the 2 x 2 (apology x remorse) into the average treatment effect of apologizing and the average treatment effect of showing remorse, as opposed to breaking out all four conditions as we did in the previous analysis. Doing so allows us to clearly show the interaction between the moderating variables and either apologizing or showing remorse.
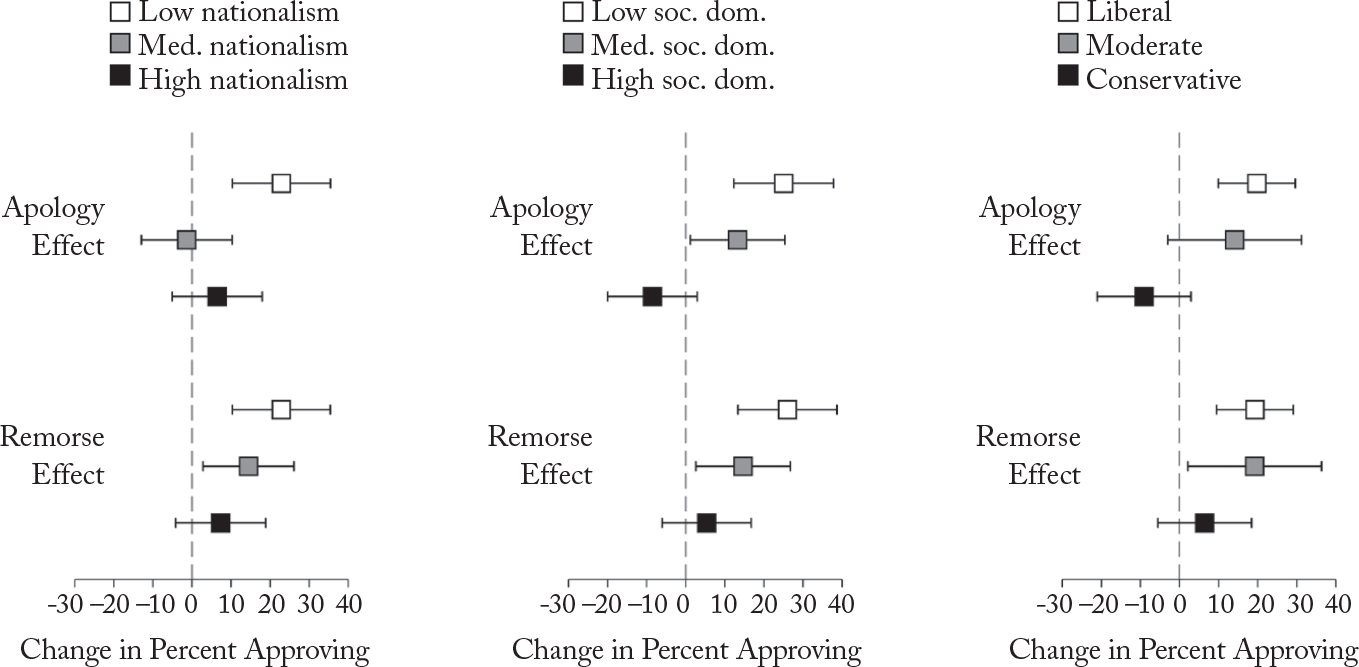
The results tell a coherent story. As Figure 4 illustrates, individuals who are highly nationalistic, highly social-dominance oriented, or conservative are less likely than others to reward their government for apologizing to another state. In some cases, these groups may even react negatively. Conservatives and those who rank high on social-dominance orientation cut their approval by eight to nine percentage points when the United States issues an apology versus when it stays silent.Footnote 81
Strong Hierarchical Group Dispositions Suppress the Benefits of Apologizing (American Opinion on a US Apology)a
aFigure presents, for different subgroups of Americans, the effect of apologizing or showing remorse on their approval of the US government. N = 758; 95 percent confidence intervals are displayed.

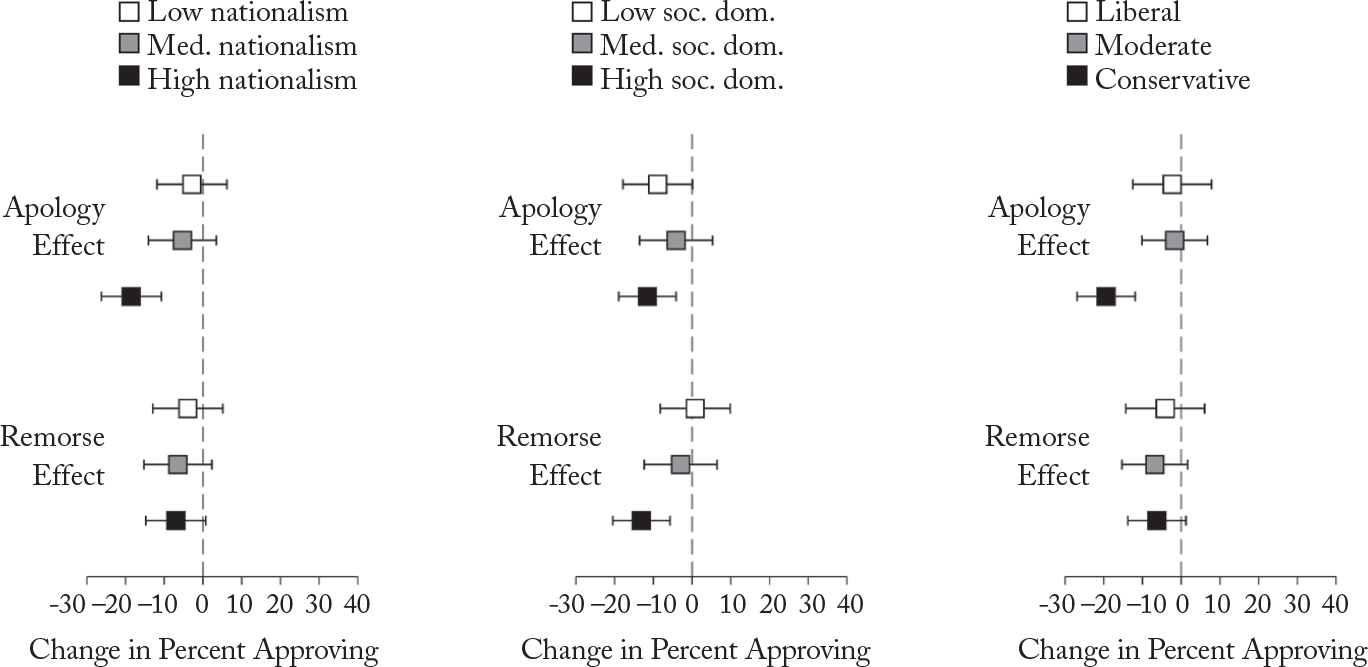
Figure 5, showing results for the Japan sample, is similar. All three moderators negatively interact with both the apology and remorse treatments, although only the interactions between nationalism and apology, social-dominance orientation and remorse, and conservativism and apology are statistically significant at the 0.05 level. Across the two scenarios, however, we find a negative effect for all twelve interactions, and a majority are significant at the 0.05 level, lending strong confidence to the argument that people holding intense hierarchical group dispositions are less approving of political apologies than others (H4).
Strong Hierarchical Group Dispositions Suppress the Benefits of Apologizing (Japanese Opinion on a Japanese Apology)a
aFigure presents, for different subgroups of Japanese, the effect of apologizing or showing remorse on their approval of the Japanese government. N = 1,567; 95 percent confidence intervals are displayed.

Beliefs about Bilateral Relations and the Impact of Apologizing
Next we explore how the perceived value of bilateral relations between apologizer and recipient moderates the effects of apology-making at home. If citizens in the apologizing state do not see the benefits of maintaining good relations with the recipient country, they are less likely to reward and may outright disapprove of their leaders for apologizing or expressing remorse.
To assess this claim, we asked survey-takers in the apologizer state to rate their country’s relationship with the recipient nation and, using their responses, created a trichotomous variable that codes whether they thought the relationship brought a small, medium, or large political benefit. In the US-Japan scenario, Americans expressed whether they thought the two countries’ alliance was beneficial to the United States. In the Japan-South Korea scenario, Japanese survey-takers were asked if they believed that the Japan-South Korea intelligence-sharing agreement was beneficial to Japan.
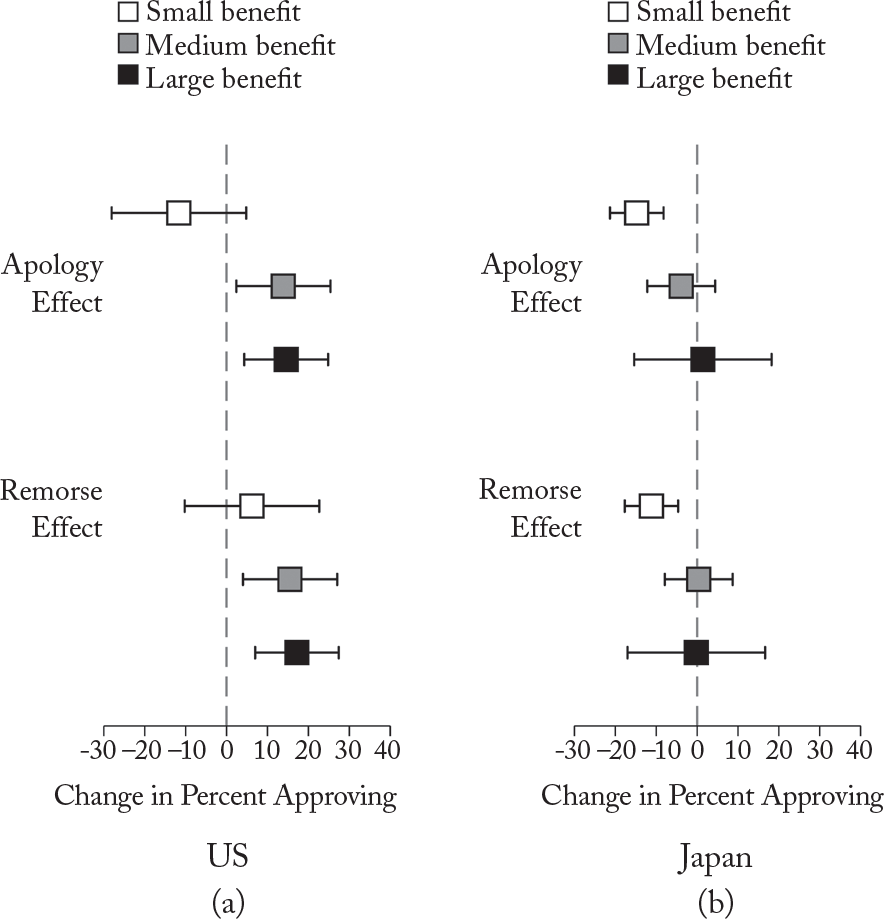
Figure 6 summarizes the results, which lend support to H5. The impact of an apology is greater among citizens of the apologizer who believe that their country benefits from its political relationship with the recipient, compared to those who see little value in the relationship. The greatest difference in the apology effect exists between those who believe that the political relationship brings their country a small benefit versus those who believe it brings a medium benefit. The apology effect is not consistently greater among those who believe the relationship brings a large benefit versus those who believe it brings a medium one. But overall, there is a positive and statistically significant interaction between the benefit measure and apology/remorse treatments.
The Greater the Perceived Value of the Relationship, the Greater the Approval for Apologizinga
aFigure presents, for different subgroups of Japanese/Americans, the effect of apologizing or showing remorse on their approval of their own government. N = 1,567 for Japan; N = 758 for the United States; 95 percent confidence intervals are displayed.

IV. Discussion
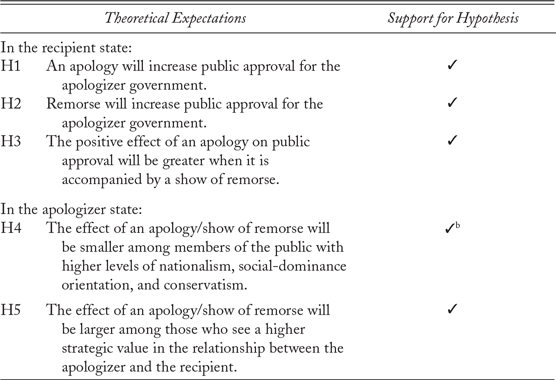
The experimental results provide broad support for our hypotheses, as summarized in Table 2. Our first key finding is that in the recipient state, either a political apology or a show of remorse can vastly improve public opinion of the apologizer. In the Japanese sample, a US apology combined with remorse improved approval more than either an apology or a show of remorse alone, although the substantive size of this effect was not large. These results suggest that an explicit expression of remorse can have a similar function as a formal apology.
Summary of Outcomesa

a An apology or expression of remorse can drive favorable opinion abroad, but the effects on a domestic audience depend on individuals’ disposition toward intergroup hierarchy and beliefs about the strategic value of the relationship between the apologizer and recipient.
b H4 is supported in nine of the twelve statistical models tested; the remaining three produce coefficients in the correct direction but are not significant at the conventional 0.05 level.
This set of results supports the sanguine view of interstate apologies’ effects on recipients’ opinion of the apologizer, but the story from the perspective of the apologizing nation is more nuanced. Here, the same apology has an uneven effect on public approval. Domestic backlash is highly contingent on the strength of hierarchical group dispositions, supporting H4. Among US and Japanese respondents alike, individuals exhibiting high levels of nationalism, social-dominance orientation, or conservatism were less likely to approve of their government’s conciliatory gestures when compared to those with moderate or weak dispositions along these dimensions.
Further, individuals who saw little strategic value in the bilateral relationship with the recipient were either unaffected or responded negatively to their government’s apology-making. This pattern, which supports H5, was consistent across the US-Japan and Japan-South Korea scenarios, indicating that the benefits of acknowledging a past harm are greatest and the risk of backlash lowest in an audience that sees at least some value in a cooperative relationship with the other state. Taken together, these results challenge the widespread view of interstate political apologies as generally effective tools for reconciliation. They underscore the need to pay greater attention, in terms of both theory and empirics, to social and political heterogeneity within a domestic audience to understand the nuanced consequences of political apologies.
Japanese and US Citizens’ Different Reactions to Their Governments’ Apologies
In Japan and the United States, domestic audiences reacted to their government’s apology to another nation with little enthusiasm and, in the case of Japan, with overt backlash (see figures 2 and 3). Although theorizing about cross-national differences in the effects of apologymaking is not the primary purpose of this article, we reflect on the three factors that could explain the differences between the two countries. We show how some of these differences reinforce support for H4 and H5 on hierarchical group dispositions and perceived strategic benefits.
First, Japan’s especially negative domestic reaction to apologizing may be rooted in historical differences. In contrast to the relatively friendly relations between the United States and Japan in the postwar period (bolstered by economic and security cooperation), yearly public opinion polls show consistently low levels of affinity between South Korean and Japanese citizens. A 2019 poll found that half the Japanese respondents had a negative image of South Korea, the top reason cited being “South Korea’s continued criticism against Japan on historical issues.” Half of the South Korean participants likewise had a negative image of Japan, with over three quarters of this group citing “no remorse over Japan’s past wartime aggression” as the top reason.Footnote 82 In contrast, public demand in Japan for a US apology regarding the Hiroshima and Nagasaki bombings has been more nuanced.Footnote 83
Second, how respondents perceive the identity of the apologizing government might explain some of the differences between the United States and Japan, although we find this less likely. When reading the vignette, survey-takers may have had in mind the Donald Trump administration—not known for being apologetic—and therefore reacted more strongly to a US apology. Yet, several reasons suggest that the results were not driven by perceptions about a specific administration. To begin, the survey vignette avoided naming Trump and explicitly told survey-takers that the news story was general and not tied to current events. Next, Abe, the Japanese prime minister at the time, was typically portrayed in both Western and Japanese media as a hawkish and unapologetic leader on issue areas like foreign policy toward East Asian neighbors, the revision of the Japanese constitution, and World War II grievances.Footnote 84 In this respect, the credibility of a Trump apology and an Abe apology should be roughly comparable. That is, any apologizer identity bias would run in the same direction and could not be the source of cross-country differences. In addition, government reputations often persist beyond leadership transitions,Footnote 85 adding confidence that the cross-country differences are not driven by Trump or Abe alone.
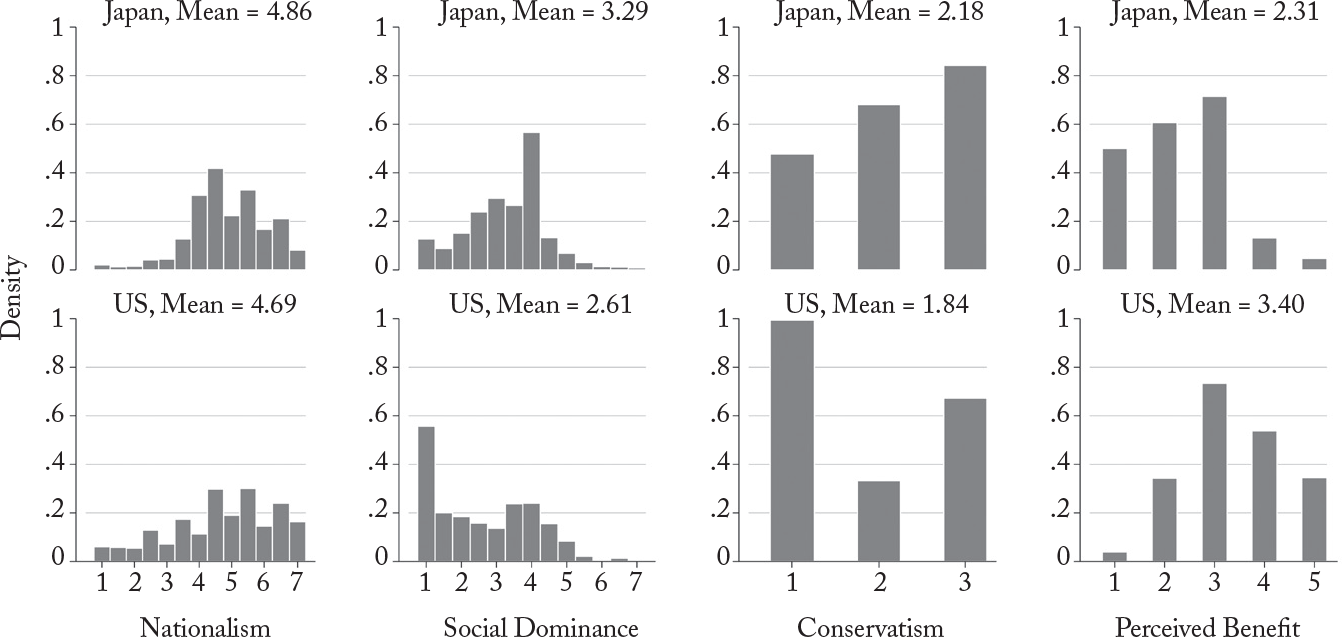
Third and most important for our argument, we find that Japan’s comparatively negative reactions can in part be explained by individuals’ hierarchical group dispositions and their beliefs about the strategic value of apologizer-recipient relations. If the theory behind H4 and H5 is generalizable, these factors should be present regardless of differences in histories or leaders across the two dyads. As Figure 7 shows, the Japan sample is indeed more nationalistic, social-dominance oriented, and conservative than the US sample. Japanese survey-takers also value their state’s relationship with South Korea less than US survey-takers value their country’s relationship with Japan. As we have argued, these factors sour the domestic reaction to apology-making. The fact that Japanese citizens differ significantly from Americans on all of these dimensions is therefore consistent with their relatively stronger distaste toward their government apologizing to another country.
Differences in Moderators across Countriesa
aHistograms use the full-scale measures for nationalism and social-dominance orientation (sevenpoint scale) and perceived strategic benefits (five-point scale). Conservatism is standardized to the three-point scale used in the main analyses, since the raw measure of ideology ranged from 1 to 10 in Japan and 1 to 7 in the United States.

Ultimately, it is not possible to pinpoint the exact cause or causes that led to cross-national variation here, but that is not the main objective of this study. Instead, across two different dyads, one with a relatively stable history and one with a relatively antagonistic one, we show that the same moderators relating to hierarchical group dispositions and perceptions about interstate relations are associated with similar differences in the effect of apology-making. Thus, we demonstrate how our theory and empirics regarding apology-making’s impact on public opinion produce generalizable insights.
V. Implications
Apology diplomacy promises to assuage historical grievances, which are often viewed as impediments to international cooperation.Footnote 86 This article complicates this conventional understanding of apology-making in international affairs. Beyond addressing whether apologies can heal historical grievances held by foreign audiences, our theory and analysis of how they affect both sides of the apologizer-recipient relationship help to clarify when they might be most successful. Whereas recipient audiences generally reward foreign governments for apology-making, reactions back home are mixed. Individuals who are highly nationalistic, social-dominance oriented, and conservative are significantly less receptive (or even opposed) to their government issuing a political apology or expressing remorse. Citizens who see little value in the politicalrelationship between their country and the recipient of the apology are also less supportive.
This evidence has implications for our understanding of when apologies might be offered or withheld. Leaders should have the most to gain from apology-making under two conditions: first, when their domestic constituency is sufficiently interested in maintaining a cooperative bilateral relationship with the recipient state, and second, when the need to pay heed to nationalistic or conservative constituents is outweighed by the need to foster goodwill in the recipient state (for instance, to obtain cooperation on the economy and national security). For example, postwar West Germany prioritized revitalizing the economy in concert with other European nations,Footnote 87 which created incentives for a deep reckoning. Conversely, leaders would have the most to lose from apology-making when the value of bilateral relationships with the recipient state is contested and when domestic constituents with strong hierarchical group dispositions are a critical support base for the leader. This explains why, for instance, French President Jacques Chirac’s 1995 apology over the Vichy regime, a stark departure from prevailing official attitudes, came only as extreme right-wing groups and the Gaullist myth of France as a nation of resisters were in decline.Footnote 88
A broader contribution of the article is to reveal the importance of individual-level characteristics as drivers of public opinion on apology diplomacy, factors that have thus far been largely neglected in the literature. The rationalist literature on strategic foreign policy interactions has traditionally dealt with individual-level variation among the public as unmeaningful noise;Footnote 89 similarly, the mostly qualitative and historical scholarship on political apologies has privileged macro-, group-, or state-level factors. Instead, we have argued and demonstrated that variation in individuals’ attitudes and beliefs moderates the impact of interstate apologies. This variation also helps to explain the curious instances when apologies do not occur. Consider Japan’s “failure to reckon with difficult history” even when that failure unleashed demonstrations and a boycott of Japanese products in South Korea, threatening trade.Footnote 90 Although not an all-important political constituency within Japan, relatively hawkish and conservative populations have traditionally been a critical base for the ruling Liberal Democratic Party—in power for all but four years since World War II. These populations likely deterred various administrations from fully responding to South Korean demands. A geopolitical shift that requires stronger cooperation with South Korea, such as the rising threat of China or North Korea, could tip the scale in the other direction.
Although we do not claim that the specific moderating variables we tested explain all the variation in the effect of apology-making, our findings make clear the need to bring microfoundations, especially the role of individual-level attributes and beliefs, more fully into theories of political apologies and public diplomatic communication. Changing global norms about historical reckoning, for instance, may shift the underlying dispositions of those who would otherwise have resisted an apology. The 2020 killing of George Floyd in Minneapolis and subsequent mass protests inspired Algeria to demand an apology from France for its colonial past,Footnote 91 in turn prompting an introspective moment within France on how to achieve “reconciliation between the French and Algerian peoples.”Footnote 92 Shared ethnicity or race across apologizer and recipient may also influence societal acceptance or rejection of apology-making; after all, ethnic bias in diverse societies can shape a host of attitudes and behaviors, including political responsivenessFootnote 93 and altruism.Footnote 94 Thus, although we have demonstrated that hierarchical group dispositions and beliefs about bilateral relations are critical to the success of political apologies in a variety of contexts, the roles of other moderating factors rooted in specific histories or other individual-level attributes are important questions for future work.
This article also provides a point of departure for new empirical questions about leader behavior in public diplomacy. Our study suggests that leaders can preemptively express remorse together with issuing apologies to win over particularly difficult foreign audiences, highlighting the need for governments to consider a broader repertoire of rhetoric when engaging in public diplomacy. Indeed, research on soft power and diplomacy demonstrates that impressions of sympathy and sincerity in a leader can shape strategic interactions between states.Footnote 95 Relatedly, recent experimental research finds that voters are more confident in conciliatory policy gestures when they are initiated by hawkish leaders rather than by doves, regardless of the policy’s substantive success.Footnote 96 On the one hand, an apology’s risk of domestic backlash may be amplified for leaders perceived as dovish; the Obama administration’s mulling of an apology in Hiroshima provoked accusations of another apology tour. On the other hand, the risk may be mitigated for hawks; had Abe renewed a formal apology to Japan’s East Asian neighbors, he might have suffered less domestic blowback than Junichiro Koizumi did when he apologized in 2005. Questions about leaders’ rhetoric and their perceived qualities are therefore important avenues for future research on apology diplomacy. Studies have found public opinion to be consequential not only for soft power but also for “hard” policy outcomes,Footnote 97 and discourse around historical injustices, a key feature of transitional justice, is increasingly prominent in contemporary diplomatic relations. The stakes are high, given that governments both speak to and for their citizens.
Supplementary Material
Supplementary material for this article can be found at https://doi.org/10.1017/S0043887121000083.
Data
Replication files for this article can be found at https://doi.org/10.7910/DVN/PGMX3H.
Acknowledgments
The authors contributed equally to this work; the order of their names was randomly determined. We thank Yusaku Horiuchi; Koji Kagotani; Jiyoung Ko; Phillip Lipscy; Kelly Matush; Megumi Naoi; Quynh Nguyen; Jessica Weeks; participants at the International Studies Association 2019 annual meeting and 2020 informal virtual meeting, the 2019 Northeast Workshop on Japanese Politics at Dartmouth College, the 2020 International Relations and East Asia Online Colloquium, and the April 2020 research seminar at Harvard University’s Weatherhead Center for International Affairs Program on US-Japan Relations; and the three anonymous reviewers for World Politics for comments on earlier versions of this article.
Authors
Risa Kitagawa is an assistant professor of political science and international affairs at Northeastern University. Her research focuses on transitional justice, including international and domestic responses to repression, political violence, and wartime human rights violations. She can be reached at r.kitagawa@northeastern.edu.
Jonathan A. Chu is a lecturer at Stanford University. He specializes in public and elite opinion on democracy, foreign policy, war, and wartime conduct. He can be reached at jonchu@stanford.edu.