


The General Factor of Personality (GFP) is a higher-order latent dimension of personality that is superordinate to narrower personality dimensions (such as the Big Five [BF]), analogous to the general intelligence (g) factor in the case of cognitive ability measurement (Musek, Reference Musek2017). A GFP-like factor was first formally identified in 1915 among personality ratings involving a sample of 194 trainee teachers by Edward Webb, who described it as a Persistence of Motive or Will (w) factor, distinct from the g factor (Webb, Reference Webb1915). Interest in the possibility of a g-like personality construct waned for over eight decades, until Willem Hofstee revisited the concept via analysis of large numbers of personality-descriptive items sourced from the Five Factor Personality Inventory, finding evidence for a general Primordial One or p factor. This p factor appeared to capture a general Competence or Coping capacity, characterized at the positive pole by groundedness, dispositional optimism, and being at ease among others (Hofstee, Reference Hofstee, Collis and Messick2001, p. 52, see also Hofstee, Reference Hofstee, Weiner, Millon and Lerner2003). Independently of Hofstee, Figueredo et al. (Reference Figueredo, Vásquez, Brumbach and Schneider2004) identified a general Personality factor among the Big Five in the Midlife in the US (MIDUS) sample. This factor was found to genetically correlate with the K-factor (a latent variable comprising, inter alia, measures of prosocial behavior, friend- and family-directed attitudes, time preferences, and mating effort) in addition to a general Covitality factor derived from indices of physical and mental health. The resultant higher-order factor, capturing a very broad psychometric dimension of human life history, was termed Super-K. Stankov (Reference Stankov, Wilhelm and Engle2005) identified a single personality g factor among the BF. This observation formed the basis of an argument against the strong focus of psychometricians on the g of intelligence. He argued that because most personality theorists subscribe to the BF and ignore the general factor superordinate to it, special emphasis on g as opposed to group factors is arbitrary. Widespread attention to (what would eventually be known) as the GFP came two years later with Janek Musek’s (Reference Musek2007) finding that (what he termed) the Big One could be reliably extracted from measures of the BF using both confirmatory and exploratory methods. Musek (Reference Musek2007) suggested that this corresponds to a dimension of “social desirability, motivation, well-being, satisfaction with life, and self-esteem” (p. 1213). Current thinking on the nature of the GFP holds that it represents a fundamental dimension of prosociality characterized by social effectiveness (Rushton & Irwing, Reference Rushton, Irwing, Chamorro-Premuzic, von Stumm and Furnham2011; van der Linden et al., Reference van der Linden, Dunkel and Petrides2016) and ego-resiliency (Dunkel et al., Reference Dunkel, van der Linden, Kawamoto and Oshio2021). Kanazawa (Reference Kanazawa2025) has suggested that individuals varying along this dimension could be described as being more or less personalient — the personality analogue of intelligent.
Among the most significant lines of supporting evidence for the existence of the GFP is the finding of almost perfect correlations (after reliability correction) between GFPs extracted from different personality inventories (Rushton & Irwing, Reference Rushton, Irwing, Chamorro-Premuzic, von Stumm and Furnham2011, Figure 5.12). The GFP has also been found in non-Western populations, specifically the indigenous Tsimane, of Bolovia, assessed using self and spouse reports, and interviewer ratings of the BF (van der Linden et al., Reference van der Linden, Dunkel, Figueredo, Gurven and von Rueden2018). This notwithstanding, the GFP is controversial, with its critics arguing that it might be an artefact of socially desirable, or other, responding bias (Bäckstrom et al., Reference Bäckström, Björklund and Larsson2009). Others have maintained that it is caused by peculiarities associated with item sampling (Ashton et al., Reference Ashton, Lee, Goldberg and de Vries2009) or problems with factor identification (Revelle & Wilt, Reference Revelle and Wilt2013). Many of these objections have been dealt with comprehensively (Dunkel et al., Reference Dunkel, van der Linden and Kawamoto2024; Irwing, Reference Irwing2013; Musek, Reference Musek2017). It has furthermore been noted that many objections to the GFP resemble those raised against g early in the history of psychometrics (van der Linden et al., Reference van der Linden, Schermer, de Zeeuw, Dunkel, Pekaar, Bakker and Petrides2017).
Even though levels of support for the GFP among personality psychologists have increased, with the number of critical papers having decreased substantially over the last decade (Kanazawa, Reference Kanazawa2025), there is not yet strong consensus on it’s reality. Furthermore, key questions about it’s nature remain unaddressed; for example, does it exhibit validity as an entity? Confirmatory phenotypic mediation models involving genetically informed samples (e.g., twin databases) offer powerful means for validating the existence of psychometric constructs (Bollen & Pearl, Reference Bollen, Pearl and Morgan2013; Borsboom et al., Reference Borsboom, Mellenbergh and van Heerden2003; Bruins et al., Reference Bruins, Franic, Borsboom, Dolan, Boomsma and Hoyle2023; Franić et al., Reference Franić, Dolan, Borsboom, Hudziak, van Beijsterveldt and Boomsma2013; Jonas & Markon, Reference Jonas and Markon2016). Two basic kinds of model can be estimated using such data. The first, known as a common pathway model, assumes full mediation of the influence of genetic and environmental variance on the manifest indicators by a latent variable (Figure 1a). In such cases the latent variable is said to be an entity reflecting the effects that these variance components index and can therefore be described as causal of the covariance among its manifest indicators. For example, if a BF dimension, such as neuroticism, were found to mediate the entirety of genetic and environmental effects on its facets, then this would indicate that neuroticism is reflective of the action of these effects and is therefore causing the facets to intercorrelate, making it a valid entity. Figure 1b illustrates the second type of mediation model. Here the manifest variables mediate the effects of genetic and environmental variances on the latent variable via independent paths from the former causal variables to the latter latent variables. In this instance, these sources of variance are said to have a formative effect on the latent variable, which emerges as a consequence of the interplay among these sources of variance. Under these conditions, the latent variable (e.g., neuroticism, as per the above example) is not a causal entity, but is instead a statistcal summary of the effects of these more basic influences.
(a) The common pathway (reflective) model; (b) the independent pathways (formative) model. A, C, and E correspond to additive genetic, shared environmental, and non-shared environmental variances respectively, p corresponds to the latent psychometric factor, and A, B, and C correspond to the manifest indicators. Image modified from Franić (Reference Franić2014, p. 16).

Such models have been used in the study of sources of general covariance among cognitive variables, with most models employing twin designs favoring common pathway, or reflective, models in which g fully (or nearly fully) mediates the effects of behavior-genetic variance components on its subtests (Panizzon et al., Reference Panizzon, Vuoksimaa, Spoon, Jacobson, Lyons, Franz, Xian, Vasilopoulos and Kremen2014; Shikishima et al., Reference Shikishima, Hiraishi, Yamagata, Sugimoto, Takemura, Ozaki, Okada, Toda and Ando2009). A recently published study (Woodley of Menie et al., Reference Woodley, Peñaherrera-Aguirre and Fuerst2025) was able to contrast three mediation models (reflective, formative, and mixed) using four large datasets containing multiple cognitive polygenic scores (PGSs). In all four cases models supporting mixed influences were found to be the most parsimonious, with phenotypic g factors mediating between 31% and 81% of the variance of latent genetic g factors (comprising multiple cognitive PGSs) upon their constituent subtests, which were in turn independently influenced by the residual effects of the genetic g factors.
Relatively little research of this sort has been conducted using direct measures of personality, and that which has been done has yielded mixed results. Jang et al. (Reference Jang, Livesley, Angleitner, Riemann and Vernon2002), for example, found that the BF were formative constructs, indirectly influenced by pleiotropic effects of genetic variance upon their facets. Lewis and Bates (Reference Lewis and Bates2014) analysed the HEXACO dimensions, noting that “[f]or each of the six factors, only a single common genetic basis was required to explain genetic covariation among the facets, along with facet-specific genetic effects. These findings provide support for personality models positing that the major dimensions of personality are each underpinned by a unified and coherent biological architecture” (p. 9). This suggests that the six HEXACO dimensions are both reflective of underlying behavior-genetic influences and are also formed (in part) via the distinct action of these effects upon their facets.
The Current Study
The English Longitudinal Study of Aging (ELSA) has made PGSs available for the BF personality dimensions, using single nucleotide polymorphisms (SNPs) sourced from their own subject pool that overlap with those identified in various meta-analytic studies. Moreover, ELSA administered BF items to its subject pool, which means that many subjects have both genomic and phenotypic data relevant to the BF. These data therefore can be used in the same manner that Woodley of Menie et al. (Reference Woodley, Peñaherrera-Aguirre and Fuerst2025) used GCA data — that is, to directly test reflective, formative, and mixed models of the GFP.
Methods
The ELSA Dataset
ELSA is a prospective longitudinal adult sample surveying those aged 50 or older who had completed a previous longitudinal survey (the Health Survey for England; Banks et al., Reference Banks, David, Breedvelt, Coughlin, Crawford, Marmot, Nazroo, Oldfield, Steel, Steptoe, Wood and Zaninotto2024). ELSA participants, who are regionally and socioeconomically representative of the English population, are interviewed and reinterviewed on a biennial basis, with the data currently spread across 11 data-collection waves (the most recent wave concluded in 2023). ELSA is designed to mimic the US Health and Retirement Survey, which allows for meaningful cross-cultural comparisons between the two. Genotyping of ELSA subjects was restricted to those who met certain health requirements. Full details of genotyping and quality control are described in Ajnakina and Steptoe (Reference Ajnakina and Steptoe2022, pp. 14–16). Instructions on how to access ELSA data can be found at the following url: https://www.elsa-project.ac.uk/accessing-elsa-data
Big Five PGSs
ELSA provides PGSs for each of the BF personality traits. These were assembled as follows:
(a) Agreeableness, Openness, and Conscientiousness. These PGSs were estimated based on the results of a meta-analysis of 10 genome-wide association studies (GWASs) carried out on the BF containing 17,375 individuals of European ancestry (de Moor et al., Reference de Moor, Costa, Terracciano, Kreuger, de Geus, Toshiko, Hartman, Esko, Madden, Derringer, Amin, Willemsen, Hottenga, Distel, Uda, Sanna, Ferrucci, Schlessinger, McCrae and Boomsma2012). For agreeableness, 760,918 ELSA SNPs were found to overlap with the meta-analytic GWAS SNPs. For openness, 750,564 ELSA SNPs were found to overlap. For conscientiousness, 750,990 ELSA SNPs were found to overlap. An attempt was made to replicate SNPs exhibiting genome-wide significance in silico using five additional discovery samples composed of 3,294 individuals. Approximately 2.5 million common SNPs were imputed in the HapMap phase II CEU (Northern Europeans from Utah) subject pool for use as the reference sample. GWA analyses were conducted in each discovery sample using linear additive models incorporating age and sex as covariates. Only two openness SNPs and one conscientiousness SNP were found to reach genomewide significance (p < 5 x 10⁻⁸). No genomewide significant agreeableness SNPs were detected, however (Ajnakina & Steptoe, Reference Ajnakina and Steptoe2022).
(b) Extraversion. This PGS was estimated based on the results of the GWAS meta-analysis of van den Berg et al. (Reference van den Berg, de Moor, Verweij, Kreuger, Luciano, Arias Vasquez, Matteson, Derringer, Esko, Amin, Gordon, Hansell, Hart, Seppala, Huffman, Konte, Lahti, Lee and Boomsma2016), which employed 29 discovery cohorts (n = 63,030 subjects) with values of n ranging from 177 to 7,210 participants. Extraversion scores were regressed on the SNPs using a linear additive model with sex and age as covariates, in addition to ancestral Principal Components (PCs) in certain cases. Meta-analysis of these discovery cohorts did not yield any SNPs that reached genome-wide significance, with the lowest observed p value for a single SNP being 2.9 x 10⁻⁷. An additional 74 SNPs exhibited p < 1 x 10⁻⁵. 1,218,049 ELSA SNPs were found to overlap with the 6,941,603 GWAS extraversion SNPs (Ajnakina & Steptoe, Reference Ajnakina and Steptoe2022).
(c) Neuroticism. This PGS was estimated based on the results of a GWAS meta-analysis carried out by Okbay et al. (Reference Okbay, Baselmans, De Neve, Turley, Nivard, Meddens, Linnér, Rietveld, Derringer, Gratten, Lee, Liu, de Vlaming, Ahluwalia, Buchwald, Cavadino, Frazier-Wood, Furlotte and Cesarini2016), which included 63,661 individuals sourced from the Genetics of Personality Consortium (GPC), and 107,245 individuals sourced from the UK BioBank (UKB). This study identified 11 lead SNPs in UKB, which used a short-form (12-item) variant of Eysenck’s Personality Inventory Neuroticism Scale. Different, harmonized, neuroticism scales were used in GCP. In UKB, 15 ancestral PCs, along with variables capturing array, sex, age ranges, as well as a sex-by-age interaction were used as covariates. For the 29 GCP cohorts, model adjustments varied on a cohort-by-cohort basis. Of the 6,524,432 neuroticism GWAS SNPs, 1,191,041 ELSA SNPs were found to overlap (Ajnakina & Steptoe, Reference Ajnakina and Steptoe2022).
Big Five Phenotypes
ELSA assessed personality using 25 adjectives associated with each of the BF factors in Wave 5. These were sourced from the Midlife Development Inventory (MIDI) personality scale (Lachman & Weaver, Reference Lachman and Weaver1997). Respondents were given a 4-point Likert scale to rate how well each adjective described an aspect of their personality. The adjective sets comprising each dimension are as follows.
(a) Extraversion: outgoing + friendly + active + talkative + lively
(b) Agreeableness: warm + helpful + soft-hearted + sympathetic + caring
(c) Conscientiousness: organised + responsible + thorough + hardworking + (reversed) careless
(d) Emotional Stability (reversed Neuroticism): (reversed) moody + (reversed) worrying + (reversed) nervous + calm
(e) Openness: creative + imaginative + intelligent + curious + sophisticated + adventurous
Responses were summed for each dimension and then averaged by the number of adjectives. Gale et al. (Reference Gale, Mõttus, Deary, Cooper and Sayer2017) computed Cronbach alphas for each of the ELSA BF noting the following values: “0.76 (extraversion), 0.80 (agreeableness), 0.68 (neuroticism), 0.67 (conscientiousness) and 0.79 (openness to experience), indicating at least adequate internal consistency”(p. 130).
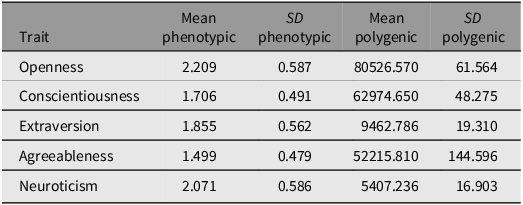
Complete data on both personality PGSs and phenotypic dimensions were available for 4,753 individuals. Means and standard deviations for each BF dimension and its associated PGS are provided in Table 1.
Means and standard deviations for phenotypic Big Five and associated polygenic scores

Statistical Analyses
A total of 200 participants were randomly selected from the larger sample of 4,753 individuals using the dplyir package (Wickham et al., Reference Wickham, François, Henry, Müller and Vaughan2023). These data were then examined using exploratory statistical procedures. Kaiser-Meyer-Olkin (KMO) and Bartlett’s tests were used on both polygenic and phenotypic personality data to assess their suitability for Principal Axis Exploratory Factor Analysis (EFA). These tests were performed using the Cortest.Bartlett and KMO functions found in the psych package (Revelle, Reference Revelle2015). Horn’s Parallel Analysis (PA) was also conducted to determine the number of extractable latent dimensions. These models were implemented using the fa.parallel function (assuming a maximum likelihood estimation and 500 iterations) found in psych. EFA for the phenotypic personality data was employed using the fa function found in psych. Data from the remaining 4,533 participants were subjected to confirmatory factor analysis (CFA) with models whose structures are informed by the results of the EFA.
These CFA analyses were performed with the lavaan package (Rosseel, Reference Rosseel2012). Parsimony fit indices were estimated for each model (Akaike information criterion [AIC], Bayesian information criterion [BIC], and degrees of freedom). The qpcR package (Spiess, Reference Spiess2022) was used to estimate ΔAIC and ΔBIC values and their corresponding weights. All statistical analyses were conducted using R v.4.0.1 (R Core Team, Reference Core Team2022).
Results
Principal Axis Exploratory Factor Analyses
Prior to performing EFA, all BF PGSs were residualized for the effects of 10 ancestral PCs provided by ELSA. Controlling for these ancestral genetic structures reduces confounding stemming from spurious relationships caused by population stratification (Price et al., Reference Price, Patterson, Plenge, Weinblatt, Shadick and Reich2006). The KMO measure of sampling adequacy (MSA) yielded a value of 0.59. Values lying between 0.5 and 0.59 have been described as of “mediocre” magnitude but this range is nevertheless often taken to define the lower limit of what is considered acceptable as evidence for sampling adequacy (Field, Reference Field2013). The Bartlett’s test reached statistical significance (χ2 = 44.988, p < .0001). Horn’s PA recommended the extraction of zero latent dimensions based on the correlation structure among the five personality traits’ PGSs, so no genetic-level GFP was present.
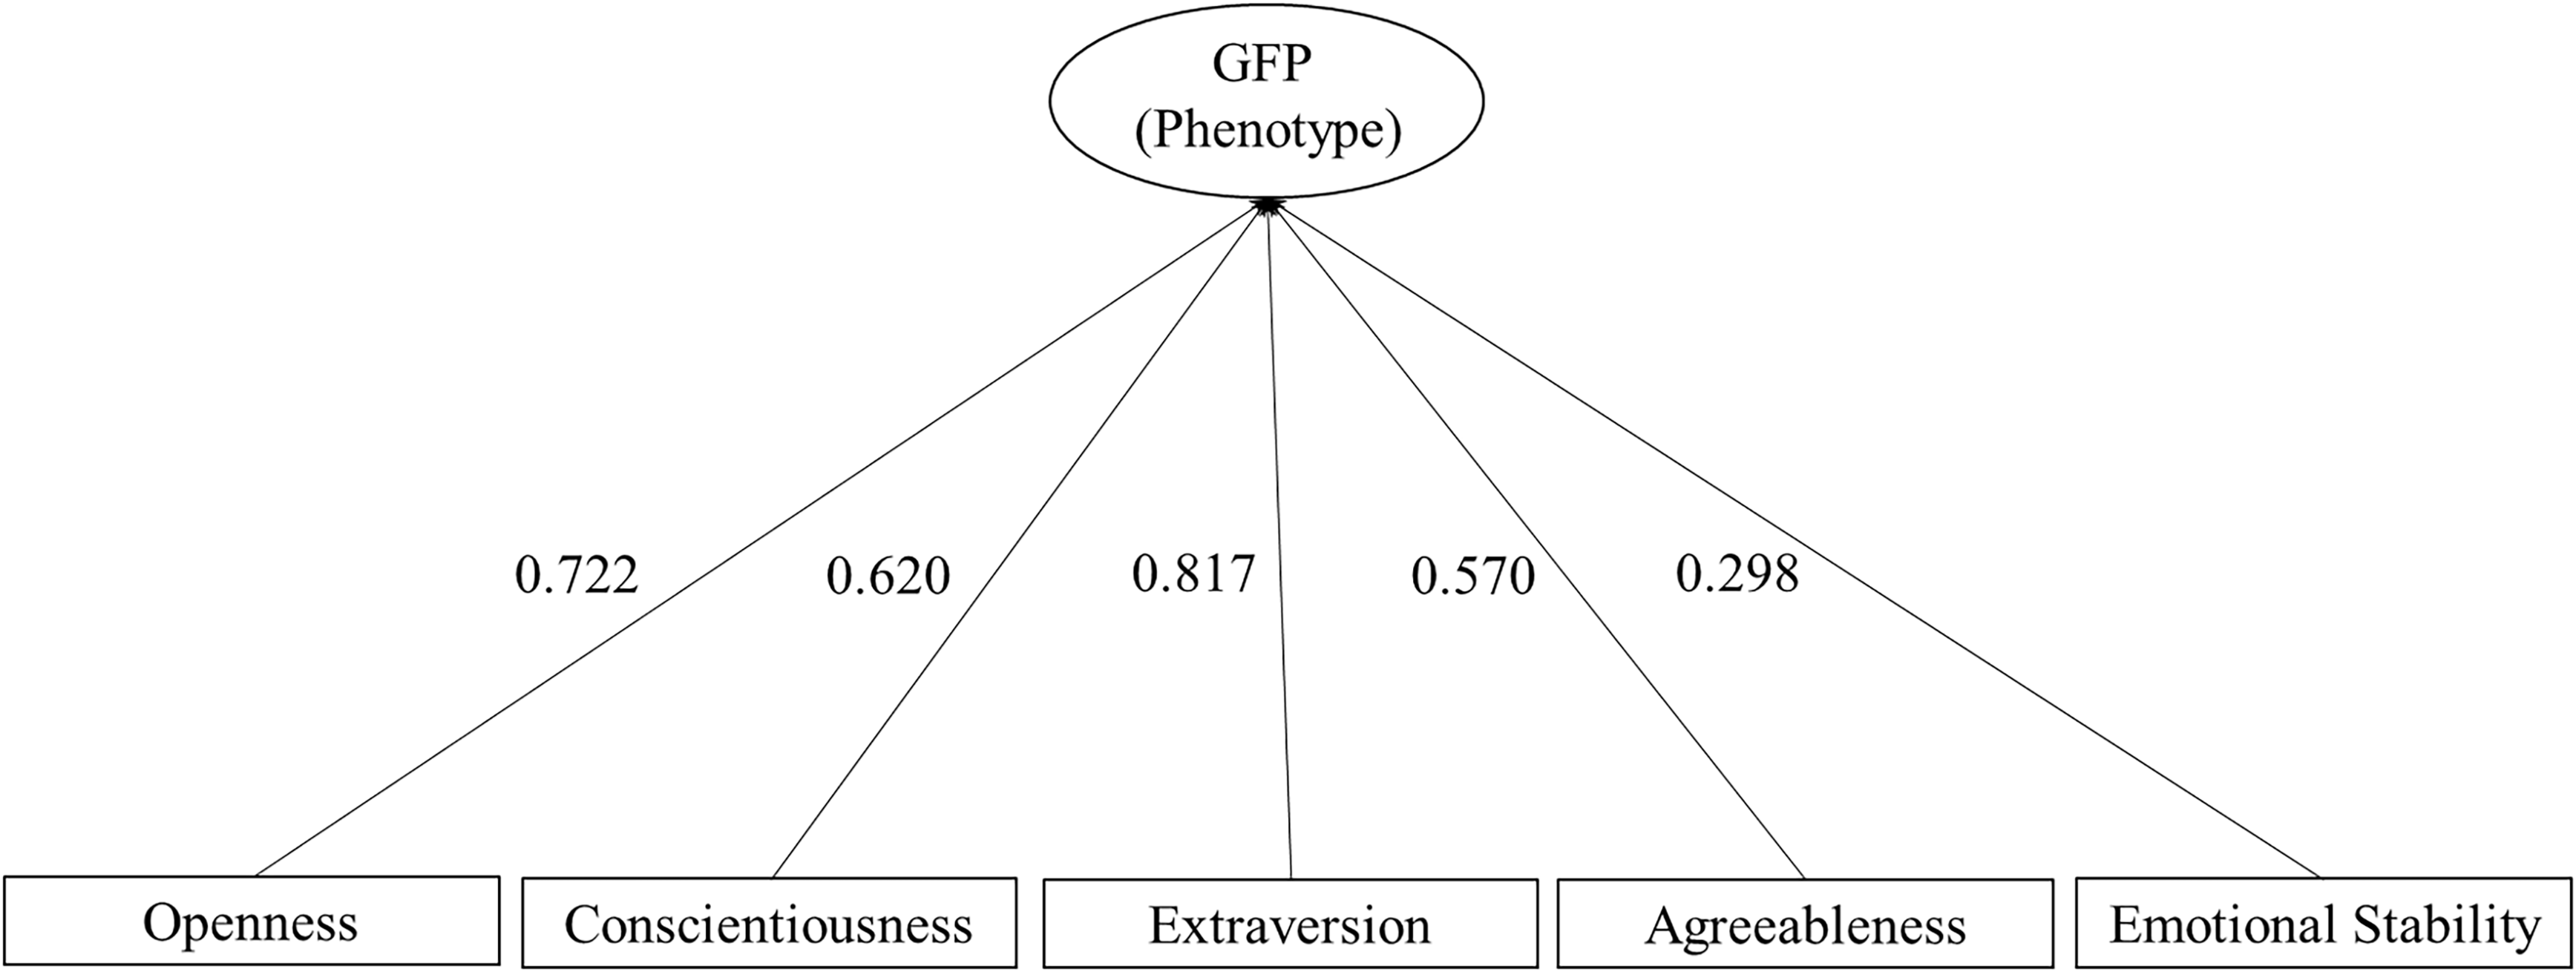
Both the Bartlett’s (χ2 = 234.103, p < .0001) and the KMO tests (MSA = .76) indicated that the phenotypic personality trait scores were highly suitable for EFA. Horn’s PA recommended extracting just one dimension, which explained 39.7% of the variance (Eigenvalue = 1.986). Factor loadings ranged from 0.298 (reverse-scored neuroticism), to 0.817 (extraversion). This structure is depicted in Figure 2.
Factor structure of a phenotypic GFP and the corresponding lower order personality dimensions (n = 200).

Confirmatory Factor Analysis
The factorial structures obtained with the exploratory sample were used to generate and compare the three rival CFA structural equation models (SEMs) illustrated in Figure 3.
Three competing SEMs: (a) Common pathway (reflective) model in which the GFP fully mediates the effects of PGSs on its components; (b) Indirect pathways (formative) model in which the PGSs have direct effects on their corresponding phenotypes; (c) Mixed model in which both common and indirect pathways are estimated.

Although all three models depicted in Figure 3 exhibited acceptable comparative fit index (CFI), Tucker-Lewis index (TLI), root mean square error of approximation (RMSEA), and standardized root mean square residual (SRMR) values (CFI ≥ 0.95, RMSEA ≤ 0.05, and SRMR ≤ 0.08 are indicative of good model fit, TLI ≥ 0.90 indicates an acceptable model fit; Hu & Bentler, Reference Hu and Bentler1999), the model comparison revealed that the reflective (common pathway) model was the most parsimonious of the three alternative structures (ΔAIC = 0.000; AIC weight = 1.000; ΔBIC = 0.000; BIC weight = 1.000; df = 35). These results are further described in Table 2. The reflective model indicated that the phenotypic GFP loads positively and significantly onto openness to experience, conscientiousness, extraversion, agreeableness, and emotional stability with factor loadings ranging from 0.248 (emotional stability) to 0.836 (extraversion), mirroring the results of the EFA. The model also revealed significant, albeit small-magnitude, covariances among the various PGSs. These were present between the emotional stability, agreeableness, and extraversion PGSs. In turn, the openness to experience and conscientiousness PGSs exhibited negative covariance. Lastly, the model identified a negative, although small, effect of the extraversion PGS on the GFP. As with Woodley of Menie et al. (Reference Woodley, Peñaherrera-Aguirre and Fuerst2025), nonsignificant paths and covariances were set to zero. The SEM illustrating the results of the best fitting-model is presented in Figure 4.
Model comparison involving three competing models and their corresponding fit indices

Note: CFI, Comparative fit index; TLI, Tucker-Lewis index; RMSEA, root mean square error of approximation; SRMR, standardized root mean square residual; AIC, Akaike information criterion; BIC, Bayesian information criterion. Best-fitting model is shown in bold type.
SEM indicating the presence of a common pathway from the extraversion PGS to the GFP (nonsignificant paths and covariances are constrained to zero and not shown), with the GFP mediating the effect of this on the phenotypic BF.

Discussion
While the EFA yielded no evidence of a “genetic GFP” factor among the BF PGSs, it presented strong indications of a phenotypic GFP within the smaller exploratory sample. CFA models, in which the GFP was specified as a latent variable, found evidence of good model fit for common (reflective), indirect (formative), and mixed models in which the PGSs were allowed to exhibit some degree of covariance. The reflective model had the greatest parsimony (the largest numbers of df and the smallest AIC and BIC weights). But only the path from the extraversion PGS to the GFP reached significance and was negative in sign. These results are therefore weakly consistent with the idea that the GFP is a causal entity in these data, directly reflecting the action of (at least some) sources of genetic personality variance.
The weakness of the current findings, coupled with the apparent negative association between the extraversion PGS and GFP, may be consistent with an increasingly large body of behavior-genetic research, which has found that personality variation owes more to the action of non-additive genetic effects (gene-by-gene interactions that either take place within a locus, i.e., genetic dominance effects, or between loci, i.e., epistasis effects; Johnson et al., Reference Johnson, Vernon, Feiler, Boyle., Matthews and Saklofske2008; Penke & Jokela, Reference Penke and Jokela2016; Woodley of Menie et al., Reference Woodley, Luoto, Peñaherrera-Aguirre and Sarraf2021). Lewis and Bates (Reference Lewis and Bates2014) found, consistent with this possibility, that ADE (Additive, Dominance [non-additive], and non-shared Environmentality) common pathway models fit best in the cases of three of the six HEXACO dimensions. Notably, for Honesty-Humility and Emotionality dimensions, the A common paths were associated with negatively signed coefficients.
The role of non-additivity in the genetic architecture of higher-level personality factors, such as the GFP, seems to be especially pronounced. Rushton et al. (Reference Rushton, Bons and Hur2008), employing a sample of 575 South Korean twin pairs, found that 53% of the variance in the GFP was attributable to D with the remaining 47% attributable to E. In a second sample of 332 British twin pairs Rushton et al. found that 55% of the genetic variance associated with the GFP was attributable to D. In a third study employing 316 US and Canadian twin pairs, Rushton et al. (Reference Rushton, Bons, Ando, Hur, Irwing, Vernon, Petrides and Barbaranelli2009) found that 42% of the genetic variance in the GFP was associated with D. Figueredo and Rushton (Reference Figueredo and Rushton2009) investigated the behavior-genetic architecture of the Super-K factor. These researchers found that ADE models better fit the data than models incorporating a C component. In the case of the GFP it was found that 34.7% of the broad-sense heritable variance was due to D. van der Linden et al. (Reference van der Linden, Schermer, de Zeeuw, Dunkel, Pekaar, Bakker and Petrides2017) found that 100% of the shared genetic variance between the GFP and trait emotional intelligence was due to D. These researchers also found that D accounted for 50% of the heritable variance in the GFP in their study. Not all behavior-genetic studies of the GFP yield results consistent with this pattern of evidence, however. Loehlin and Martin (Reference Loehlin and Martin2011) found that the GFP was “not especially marked by the expected non-additivity of its genetic variance” (p. 44).
These observations potentially make sense of the current results. PGSs only index A variance (Lewis & Vassos, Reference Lewis and Vassos2020), which, as has been noted, exhibits both weak and also sometimes negative common paths to latent personality factors (Lewis & Bates, Reference Lewis and Bates2014). The D variance common paths are, by contrast, typically much larger in magnitude and positive (Lewis & Bates, Reference Lewis and Bates2014). The presence of a covariance structure among the PGSs is suggestive of pleiotropic effects, with overlap among variants sampled from different studies examining different BF personality traits. But this structure appears to be largely independent of the latent phenotypic GFP, with four of the five BF PGSs having their common paths to the GFP set to zero with no loss of model power.
One key limitation concerns the issue of the reliability of the personality measures used to train the PGSs. It is possible that the personality measures used in the meta-analyses from which ELSA identified the relevant SNPs exhibited lower-than-ideal reliability and validity (in some cases different measures of the same personality dimension sourced from different personality batteries were merged, as in the case of neuroticism; Okbay et al., Reference Okbay, Baselmans, De Neve, Turley, Nivard, Meddens, Linnér, Rietveld, Derringer, Gratten, Lee, Liu, de Vlaming, Ahluwalia, Buchwald, Cavadino, Frazier-Wood, Furlotte and Cesarini2016). This means that noise may also account for at least some portion of their apparent poor performance as predictors in the current dataset. Newer, but as yet unpublished, research has found more robust evidence of widespread genetic correlations among variants trained on the BF (Schwaba et al., Reference Schwaba, Clapp Sullivan, Akingbuwa, Ilves, Tanksley, Williams, Dragostinov, Liao, Ackerman, Fealy, Hemani, de la Fuente, Gupta, Stein, Gelernter, Levey, Võsa, Ausmees, Realo and Tucker-Drob2025). In this study 1,257 lead personality-associated variants were identified, of which 823 were novel. The sample size employed in this study was truly impressive, involving 611K to 1.14M GWAS participants. Common genetic variance was found to explain 10.5 to 16.2% of the variance across the BF after controlling for measurement unreliability. In future research, PGSs for the BF derived from this newer study could be used in an effort to compensate for the manifold shortcomings of those used in the present study. Any finding obtained in the current study is therefore circumscribed to the ELSA dataset.
Future research should also revisit the issue of common versus indirect path models with respect to the GFP using similar biometric SEM-type methods to those employed by Lewis and Bates (Reference Lewis and Bates2014) in their study of HEXACO. This would allow for the possibility that the GFP is reflective of A, and to a likely much greater extent, D variance to be directly tested.
Acknowledgments
This study was not pre-registered.
Competing interests
We the authors declare that there are no conflicts of interest.