Implications
The results of this study contribute to the understanding on how the partitioning of retained energy between protein and lipid and the partitioning of the components of heat production change during growth and differ between male and female turkeys. This information can be used to further refine energy systems in turkey production, including the development of modeling approaches. As nutrient requirements are often expressed relative to energy, knowledge of how animals use energy can also help to assess nutrient requirements in both genders of turkeys.
Introduction
The cost of feed represents the largest fraction of the cost of turkey production and energy is one of the main contributors to the feed cost. In growing animals, rarely more than 50% of the ingested metabolizable energy (ME) is retained and the remainder is lost as heat. Energy expenditure (or heat production, HP) results from the biochemical inefficiency to transform inputs into outputs (e.g. the synthesis of lipid from starch) and from the energy costs of physiological and biochemical processes (e.g. protein turnover, muscle contraction). The efficiency of energy retention depends on numerous environmental factors (including diet, genotype of the animal and management system) and typically declines with decreasing production level. Sexual dimorphism is an important characteristic of turkeys and differences in feed intake and growth between genders likely result in differences in energy utilization and can affect nutrient partitioning and requirements.
In a previous study (Rivera-Torres et al., Reference Rivera-Torres, Noblet, Dubois and van Milgen2010), we reported how energy utilization and HP changed during growth in medium-size male turkeys. Nevertheless, information on energy utilization in growing turkeys is scarce, and to our knowledge, no information is available on energy utilization in female growing turkeys. Studies performed in other poultry species suggested that energy expenditure may differ between genders. Shalev and Pasternak (Reference Shalev and Pasternak1998) estimated that maintenance energy expenditure was 5% to 8% lower in female than in male growing broilers. Although MacLeod et al. (Reference MacLeod, Tullett and Jewitt1979) showed that HP (in kJ per bird per day or in kJ/(kg BW)0.75 per day) was greater in mature hens than in cockerels, this was likely due to egg production. In continuation of our previous study, the objective of this study was to quantify energy utilization in male and female turkeys of a heavy strain, which differed genetically from the strain used in our previous study.
Material and methods
Experimental design
Energy and nitrogen (N) balances were performed weekly throughout the experiment from 1 to 23 weeks in each gender. Each balance period lasted 7 days. The energy balances were measured using indirect calorimetry in open-circuit respiration chambers and allowed the partitioning of ME intake between retained energy (RE) and HP. The N balances allowed differentiating RE between protein and lipid (REP and REL, respectively). No measurements were carried out at 6, 12 and 17 weeks of age because of maintenance of the respiration chambers, resulting in a total of 19 energy and N balances for each gender.
Birds and housing
Large White poults (N88 × N700, 70 poults per gender) were delivered on the day of hatching (Grelier’s hatchery, St. Laurent de la Plaine, France) at the INRA facilities in Saint-Gilles, France. When not used for measuring the energy and N balances, turkeys were housed according to gender in two floor pens (4 m2/pen) in the same room and given ad libitum access to feed and water. Individual BW were recorded every week. To avoid overcrowding in the floor pens, the heaviest and the lightest individuals were removed from the flock at regular intervals.
Each week, a group of turkeys from each gender (different turkeys were used in successive weeks) was randomly selected to measure the energy and N balance in a 2 m2 metabolism cage, which was placed in a 12 m3 open-circuit respiration chamber. During the first week of age, measurements were taken in groups of 34 poults per cage and the number of individuals was progressively reduced to three male or four female turkeys between 16 and 23 weeks of age. The turkeys were offered feed and water ad libitum from day 1 to 6 of the balance period, whereas they were fasted with ad libitum access to water on day 7.
The turkeys were vaccinated at 1, 14 and 49 days of age for infectious rhino-tracheitis (Aviffa RTI, Merial, Lyon, France) and at 28 days of age for hemorrhagic enteritis (Dindoral, Merial, Lyon, France). The dark period started at 2300 h. It lasted 5 h/day during the first 28 days of age and was increased by 1 h every 4 weeks until 8 h/day at 12 weeks of age. The temperature in the floor pens was decreased progressively from 32°C after hatching to 20°C at 8 weeks of age. The temperature in the respiration chamber was similar to that in the floor pens, except during the day of fasting, during which it was increased by 2°C.
Diets
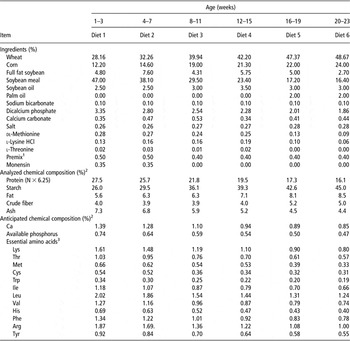
Six diets were formulated and successively used for 4 weeks each (Table 1). The diets were based on corn, wheat and soybean meal and the nutrient contents met or exceeded the National Research Council (NRC) recommendations (1994). Between the first and last diet offered, the anticipated ME values increased from 12 to 14 MJ/kg, while the total lysine content was reduced from 1.64% to 0.80%. The first diet was offered in a crumbled form, whereas other diets were pelleted.
Composition of experimental diets

1Supplied per kilogram of feed for diets 1 and 2: Fe, 58.2 mg; Cu, 20.05 mg; Mn, 80.85 mg; Zn, 90.1 mg; I, 2 mg; Se, 0.2 mg; vitamin A (retinyl acetate), 15 000 IU; cholecalciferol, 0.125 mg; vitamin E (DL-α-tocopheryl acetate), 100 mg; vitamin K3 (menadione), 5 mg; thiamine, 5 mg; riboflavine, 8 mg; pantothenic acid, 25 mg; niacin, 100 mg; pyridoxine, 7 mg; folic acid, 3 mg; biotin, 0.3 mg; vitamin B12, 0.02 mg and choline, 550 mg; and for diets 3, 4, 5 and 6: Fe, 46.56 mg; Cu, 16.04 mg; Mn, 64.68 mg; Zn, 72.08 mg; I, 1.6 mg; Se, 0.16 mg; vitamin A (retinyl acetate), 12 000 IU; cholecalciferol, 0.1 mg; vitamin E (DL-α-tocopheryl acetate), 80 mg; vitamin K3 (menadione), 4 mg; thiamine, 4 mg; riboflavine, 6.4 mg; pantothenic acid, 20 mg; niacin, 80 mg; pyridoxine, 5.6 mg; folic acid, 2.4 mg; biotin, 0.24 mg; vitamin B12, 0.016 mg and choline, 440 mg.
2Standardized values to 87.3% of dry matter.
3Values estimated from Sauvant et al. (Reference Sauvant, Perez and Tran2004).
Measurements
Measurements were taken according to the procedures described in detail by Rivera-Torres et al. (Reference Rivera-Torres, Noblet, Dubois and van Milgen2010). Briefly, two open-circuit respiration chambers were used to measure the daily oxygen (O2) consumption and carbon dioxide (CO2) production (in l) in groups of male and female turkeys. In each respiration chamber, the outgoing gas flow was measured continuously (HFM-200B, Teledyne Brown Engineering, Hampton, VA, USA), as were variations in O2 concentration (Oxymat 6, Siemens AG, Munich, Germany) and CO2 concentration (Ultramat 6, Siemens AG, Munich, Germany) between the incoming and outgoing gas of the respiration chamber. The metabolism cage was placed on force sensors (9104A, Kistler, Switzerland) to measure the physical activity of the turkeys.
A sample of the outgoing air was bubbled continuously through a sulfuric acid solution to trap the ammonia dissipated in the air. The sulfuric acid solution was collected at the end of day 6 (i.e. before fasting), weighed and homogenized before sampling. In addition, the condensed water from the cooling system of the respiration chamber was collected, weighed and sampled for further analysis. The excreta were collected, weighed and homogenized for dry matter (DM) determination and further freeze-drying. Feed refusals were weighed and the DM was measured at the end of day 6. Every week, two feed samples were taken to determine the DM content in feed and to create a pool of each feed for chemical analyses.
Chemical analyses
The feed and excreta samples were analyzed for DM, ash, crude fat, N and gross energy (GE) content. The DM and ash contents were analyzed following procedures from the International Organization for Standardization (www.iso.org; ISO 6496-1999 and ISO 5984-2002, respectively). Crude fat was determined according to method V18–117 of the French AFNOR group (www.afnor.org/en) and the GE content was measured using an adiabatic bomb calorimeter (ISO 9831-1998; IKA C5000, Staufen, Germany). The N content in feed and excreta was analyed according to the Dumas procedure (method V18-120 of the AFNOR group) using a Rapid N cube (Elementar France, Villeurbanne, France). The N content in condensed water and sulfuric acid solution was measured by a colorimetric method using a Konelab 20 (Thermo Electron, Cergy Pontoise, France).
Calculations
The ME values of the feeds were calculated for each balance period as the difference between intake and excretion of GE, divided by feed intake. For each day of the balance period, HP was calculated from the daily O2 consumption and CO2 production (Brouwer, Reference Brouwer1965). The ME intake was estimated from the daily feed intake and the ME value of the feed determined for the corresponding balance period. The difference between ME intake and HP corresponded to RE. Protein retention (N × 6.25) was calculated as the difference between N ingested and N excreted in the excreta and recovered in condensed water and in the sulfuric acid solution. The REP was estimated by assuming an energy value of 23.7 kJ/g of protein retained. The REL corresponded to the difference between RE and REP, while an energy value of 39.6 kJ/g of lipid retained was assumed to determine lipid retention. The respiratory quotient (RQ; i.e. the ratio of CO2 production to O2 consumption) was used as an indicator of the metabolic state of the individuals. During fasting, the RQ was expected to progressively decrease to a value close to 0.7 (Rivera-Torres et al., Reference Rivera-Torres, Noblet, Dubois and van Milgen2010), whereas it was expected to remain close to unity when the turkeys were offered feed.
A routine statistical modeling procedure was used to partition daily HP (kJ/day) into HP due to fasting (FHP), physical activity (AHP) and thermic effect of feeding (TEF), as described in general by van Milgen et al. (Reference van Milgen, Noblet, Dubois and Bernier1997) and in further detail by Rivera-Torres et al. (Reference Rivera-Torres, Noblet, Dubois and van Milgen2010) for growing turkeys. All traits of energy expenditure were calculated on a daily basis and expressed per unit of metabolic BW (kJ/(kg BW)0.75 per day). Net energy (NE) was calculated as the sum of FHP and RE (Noblet et al., Reference Noblet, Shi and Dubois1994), while the efficiency of energy utilization was calculated as the NE to ME ratio.
Statistical analyses
Analyses of variance were carried out using the GLM procedure of SAS (SAS Institute Inc., Cary, NC, USA) to evaluate the effect of gender, stage (i.e. period of age defined for each diet), gender × stage interaction on feed intake, growth and traits of energy utilization. The effect of stage was confounded with that of the diet. In a previous study (Rivera-Torres et al., Reference Rivera-Torres, Noblet, Dubois and van Milgen2010), we observed that the FHP varied linearly with BW raised to the power 0.75 (i.e. metabolic BW). To re-evaluate this mode of expression, the FHP (in kJ/day) was regressed on BW using the NLIN procedure of SAS after logarithmic transformation to account for the heteroscedasticity of the residue (ε):

In this model, we assumed that the variation in FHP between male and female turkeys (gender = i) was only due to the scale parameter ai (expressed in kJ/(kg BW)b per day) and b was either estimated or fixed at 0.75. As measurements were taken over a large range of BW, and FHP may vary depending on the physiological stage (Noblet et al., Reference Noblet, Shi and Dubois1994), we expressed ai in model (1) as a linear function of BW, so that:

When ci is not different from zero, model (2) equals model (1). The difference of ci from zero and the differences between genders were tested using the extra sum of squares principle (Ratkowsky, Reference Ratkowsky1983).
The ME intake was partitioned between maintenance energy expenditure (MEm), REP and REL. The MEm was defined as a function of metabolic BW (kJ/(kg BW)0.75 per day) and REP and REL were associated with efficiencies of energy utilization (k p and k f, respectively). The model was log-transformed to account for the heteroscedasticity of the residue (ε):

The MEm refers to the basal energy expenditure and, like for FHP, may not necessarily be constant for a large range of BW:

The Xi and ci were tested for a gender effect, whereas the efficiencies of energy utilization were supposed to be identical for each gender (Noblet et al., Reference Noblet, Karege, Dubois and van Milgen1999).
Results
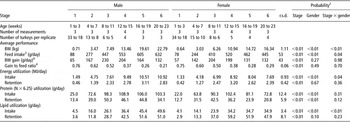
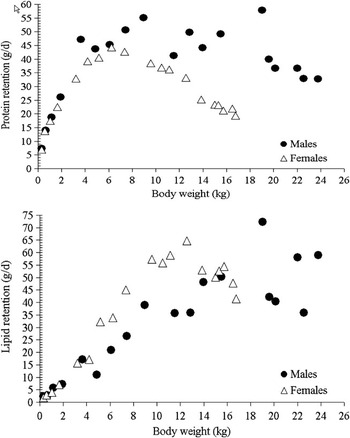
Performance results were in agreement with the commercial potential reported by the breeder (Table 2). From 1 to 23 weeks of age, male and female turkeys consumed on an average 440 and 368 g/day, respectively during the balance measurements. The corresponding average daily BW gain was 155 and 109 g/day. Feed intake and ME intake were affected by gender, stage and by the gender × stage interaction (P < 0.05). Feed intake increased continuously with age in males, whereas it increased up to 15 weeks of age to remain stable or decline thereafter in females. Daily BW gain increased rapidly up to 11 weeks of age in both genders and declined gradually thereafter. The feed efficiency (i.e. gain to feed ratio) did not differ between genders (P = 0.49), whereas it decreased from 0.76 at the first stage to 0.21 at the last stage. Although daily RE was not affected by gender (P = 0.67), daily REP differed between genders. Female turkeys retained significantly less protein and tended to retain more lipid than male turkeys (P = 0.10). Protein retention in female turkeys rapidly reached a maximum of 44 g/day at 6 kg BW and then decreased to approximately 20 g/day at 15 kg BW (or 145 days of age; Figure 1). Protein retention in male turkeys increased up to 55 g/day at 8 kg BW and declined thereafter. Between 3 and 12 kg BW, lipid retention was greater in females than in males. It reached a maximum at approximately 12 kg BW to decline thereafter, whereas lipid retention in males increased up to 18 kg BW.
Feed intake, growth and nitrogen and lipid balance in male and female turkeys growing by stageFootnote 1

1 Average values per bird from day 2 to 6 of each balance measurement. The first day was considered as an adaptation day and was not taken into account in the analysis.
2 From the analysis of variance with stage, gender and the interaction between stage and gender as fixed effects. The effect of stage was confounded with that of the diet.
3 Standardized values to 87.3% of dry matter.
4 Calculated as the average value of the daily BW gain from days 2 to 6 of the balance period. The daily BW gain was calculated from the daily feed intake and the average gain to feed ratio determined for the balance period.
Protein retention (upper panel) and lipid retention (lower panel) in male and female growing turkeys.

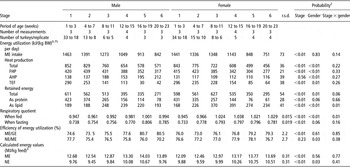
The ME intake, total HP and RE (in kJ/(kg BW)0.75 per day) decreased with increasing stage of growth (Table 3). The ME intake was not affected by gender (P = 0.83) but male turkeys consistently had a greater HP. The REP decreased with increasing stage and tended to be lower in females than in males (P = 0.06). The REL increased initially to reach a maximum and decrease thereafter and it was lower in males than in females (P < 0.01). Similarly, stage and gender effects were observed for (most of) the components of HP (i.e. FHP, AHP and TEF) while there was no interaction between stages and genders. Both FHP and TEF significantly decreased with stage. The FHP was greater in male than in female turkeys (P < 0.01) while the reverse was observed for the TEF (P < 0.01). The AHP was not affected by stage (P = 0.56) but was greater in males than in females, averaging, respectively, 171 and 116 kJ/(kg BW)0.75 per day. In fed conditions, the RQ increased during growth and was greater in females than in males (P < 0.01), especially after 8 weeks of age. After 1 day of fasting, the RQ was lower in young turkeys and tended to be greater in females than in males (P = 0.06), especially between 4 and 15 weeks of age. The metabolizability of energy (i.e. ME to GE ratio) was not affected by gender (P = 0.61) but the efficiency of ME utilization (i.e. NE to ME ratio) was greater in females than in males (P = 0.03). In addition, the metabolizability of energy increased with stage (or diet), while the efficiency of ME utilization was not affected by stage (P = 0.23).
Energy utilization in growing turkeys by stage and genderFootnote 1

ME = metabolizable energy; FHP = fasting heat production; AHP = activity-related heat production; TEF = thermic effect of feeding; GE = gross energy; NE = net energy.
1 Average values per bird from days 2 to 6 of each balance measurement. The first day was considered as an adaptation day and was not taken into account in the analysis.
2 From the analysis of variance with stage, gender and the interaction between stage and gender as fixed effects. The effect of stage was confounded with that of the diet.
3 Standardized values to 87.3% of dry matter.
Regression of FHP on BW (i.e. FHP = ai × BWb) resulted in an estimate of the shape parameter b of 0.66. The scalar ai differed significantly between genders and was 474 ± 19 and 423 ± 16 kJ/(kg BW)0.66 per day in males and females, respectively. Model (2) resulted in estimates of Xi that did not differ between genders (P = 0.38), while ci differed from zero and was different between genders. The FHP was (458–6 × BW) kJ/(kg BW)0.75 per day in males and (458–10 × BW) kJ/(kg BW)0.75 per day in females. Similar to the FHP, the MEm (model (3)) was significantly greater in male turkeys than in female turkeys and was estimated at 433 ± 19 and 365 ± 24 kJ/(kg BW)0.75 per day, respectively. The corresponding estimates for k p and k f were 0.50 ± 0.01 and 0.82 ± 0.05, respectively. In model (4), Xi did not differ between genders (P = 0.56) while ci differed from zero in females (P < 0.01) and tended to be different in males (P = 0.09). The MEm was then (586–12 × BW) kJ/(kg BW)0.75 per day in females and (586–5 × BW) kJ/(kg BW)0.75 per day in males, with corresponding estimates for k p and k f of 0.63 and 0.87, respectively.
Discussion
This study shows that differences in energy utilization between male and female turkeys are mostly due to differences in the composition of BW gain, rather than due to differences in BW gain per se, resulting in differences in the feed efficiency and in the efficiency of ME utilization. Although the gain to feed ratio tended to be greater in males than in females, the efficiency of ME utilization was lower because of a lower FHP and REL. As mentioned by Tomas et al. (Reference Tomas, Pym and Johnson1991), the efficiency of ME utilization is not necessarily correlated with feed efficiency because it depends on both basal energy metabolism and on the partitioning of weight gain between protein and lipid. Energy efficiency increases when the REL to REP ratio increases and when the basal energy metabolism decreases. Feed efficiency increases when the REL to REP ratio decreases because protein is mostly retained in lean tissue, which is associated with water retention.
The partitioning of ME intake between maintenance and growth has been widely used to describe energy utilization in growing poultry (Hurwitz et al., Reference Hurwitz, Weiselberg, Eisner, Bartov, Riesenfeld, Sharvit, Niv and Bornstein1980; Emmans, Reference Emmans1989; Sakomura et al., Reference Sakomura, Silva, Couto, Coon and Pacheco2003). The MEm is often estimated by extrapolation of the ME intake to zero RE in animals offered feed ad libitum at different stages of growth (i.e. this study), or at different feed intake levels for a given stage of growth. Estimates of MEm were shown to be affected by feed intake level (Labussière et al., Reference Labussière, Maxin, Dubois, van Milgen, Bertrand and Noblet2009), gender and strain (Jadhao et al., Reference Jadhao, Tiwari and Khan1999; Noblet et al., Reference Noblet, Karege, Dubois and van Milgen1999) and environmental conditions (i.e. ambient temperature, Hurwitz et al., Reference Hurwitz, Wax and Bengal1983; Sakomura et al., Reference Sakomura, Longo, Oviedo-Rondon, Boa-Viagem and Ferraudo2005). The MEm estimated in our previous study (642 kJ/(kg BW)0.75 per day; Rivera-Torres et al., Reference Rivera-Torres, Noblet, Dubois and van Milgen2010) was much greater than those estimated in this study (433 and 365 kJ/(kg BW)0.75 per day for males and females, respectively). In addition, the estimated energy efficiencies for protein and lipid retention were considerably greater in the earlier study (0.65 and 1.00 for k p and k f, respectively) compared with those obtained here (0.50 and 0.82, respectively). A high estimate of MEm is frequently associated with high estimates of efficiency of ME utilization, even though the partitioning of ME intake between HP and RE may be similar between studies. Although differences in MEm and efficiency of ME utilization between strains and genders cannot be ruled out (e.g. Klein et al., Reference Klein, Neubert, Strobel and Hoffmann1998), it is likely that the difference between this study and the earlier study (Rivera-Torres et al., Reference Rivera-Torres, Noblet, Dubois and van Milgen2010) is due to the extreme extrapolation to zero RE resulting in estimated traits of energy utilization that are little precise (Lopez and Leeson, Reference Lopez and Leeson2008). In addition, assuming similar efficiencies of ME utilization for different genotypes and genders resulted in a larger error of prediction of MEm. To increase the robustness of estimation of MEm, we combined the data of this study and those of Rivera-Torres et al. (Reference Rivera-Torres, Noblet, Dubois and van Milgen2010) and analyzed the data using model (4). The Xi was estimated at 628 ± 25 kJ/(kg BW)0.75 per day and was not different between the three types of turkeys (P = 0.34). However, the MEm decreased with increasing BW in male and female turkeys of the heavy strain (i.e. ci value different from zero, P < 0.01), but not in males of the medium strain. Estimates for MEm were then 628 kJ/(kg BW)0.75 per day in males of the medium strain and (628–5 × BW) and (628–13 × BW) kJ/(kg BW)0.75 per day, respectively, in males and females of the heavy strain. Similar results were reported in growing turkeys and broilers by Shalev and Pasternak (Reference Shalev and Pasternak1998) who observed a lower basal energy expenditure in females than in males.
Indirect calorimetry enables to directly estimate components of HP and, in contrast to the regression analyses outlined above, results are not obtained by extreme extrapolation, which may result in lower errors of prediction. The FHP can be considered as an estimate of basal energy expenditure in a catabolic state during which body reserves are mobilized for basal metabolism. The MEm is associated with the basal metabolism in an anabolic state (i.e. all energy for basal metabolism is provided by the diet) and it may include the AHP, which was shown to be proportional to metabolic BW. Thus, the estimates of FHP are usually lower than those of MEm. These observations were confirmed by a regression analysis carried out using model (2) with the results from this study and those of Rivera-Torres et al. (Reference Rivera-Torres, Noblet, Dubois and van Milgen2010). Similar to MEm, the FHP per metabolic BW unit was not affected by BW in medium-size male turkeys (467 kJ/(kg BW)0.75 per day), whereas the slope (ci) differed significantly from zero in males and females of the heavy strain, resulting in estimates of FHP of (467–5 × BW) and (467–11 × BW) kJ/(kg BW)0.75 per day, respectively. In addition, this model resulted in a FHP estimate of 402 kJ/(kg BW)0.75 per day at 13.1 kg of BW, which is in agreement with values reported by MacLeod et al. (Reference MacLeod, Lundy and Jewitt1985) in broad-breasted white male turkeys of similar BW (372 kJ/(kg BW)0.75 per day). The decrease in basal energy expenditure when FHP and MEm are expressed per (kg BW)0.75 may be explained by a diminishing contribution of protein turnover to basal energy metabolism and an increase in the fat content in the body. Tess et al. (Reference Tess, Dickerson, Nienaber and Ferrell1984) and van Milgen et al. (Reference van Milgen, Bernier, Lecozler, Dubois and Noblet1998) observed a strong correlation between FHP and lean tissue mass and a very low or even negative correlation with lipid mass in pigs. As body protein turnover is energetically expensive and contributes to basal energy expenditure, the greater protein retention and the lower lipid retention in males after 8 weeks of age contributed to a greater lean body mass and, possibly, to a greater basal energy expenditure.
The observation that FHP and MEm declined with BW0.75 illustrates the difficulty of expressing traits of energy expenditure relative to BW. Traditionally, the 0.75 value has been used as a scalar to compare basal energy expenditure between mature species of different BW. In an earlier study, we found that this scalar was appropriate to express FHP as a function of BW in medium-size male turkeys (Rivera-Torres et al., Reference Rivera-Torres, Noblet, Dubois and van Milgen2010). However, results of this experiment indicate a value significantly lower than 0.75, and the FHP expressed per kg BW0.75 varied with BW. In growing animals, FHP is not always proportional to kg BW0.75 (e.g. van Milgen et al., Reference van Milgen, Bernier, Lecozler, Dubois and Noblet1998). The relation between FHP and BW is often studied over a relatively narrow range of BW (e.g. 30 to 110 kg in pigs) compared with the BW range in this study (i.e. 0.3 to 24 kg). In addition to an effect of age or BW (Noblet et al., Reference Noblet, Shi and Dubois1994), there are strong indications that the FHP is also affected by the level of feed intake before fasting (Ferrell et al., Reference Ferrell, Koong and Nienaber1986 in growing lambs; de Lange et al., Reference de Lange, van Milgen, Noblet, Dubois and Birkett2006 in growing pigs; Labussière et al., Reference Labussière, Maxin, Dubois, van Milgen, Bertrand and Noblet2009 in growing veal calves). As animals mature, the level of feed intake (relative to maintenance) declines and, at maturity, a non-producing animal will eat for maintenance. The MEm (or FHP) has also been expressed relative to protein mass (Emmans, Reference Emmans1987). The reason for this is that tissues rich in protein (e.g. muscle and viscera) contribute to a much greater extent to MEm than other tissues such as fat, part of which may be due to the energy cost of protein turnover. Although scaling of FHP to the protein mass may be biologically more appropriate, it relies on an accurate measurement of protein mass. Measurements of BW are much easier to perform although this may imply that FHP and MEm expressed relative to BW is not constant across BW and that it may be affected by body composition.
Energy expenditure for physical activity is variable between animals and depends on the housing conditions. Previous studies in poultry (van Milgen et al., Reference van Milgen, Noblet, Dubois, Carré and Juin2001; Noblet et al., Reference Noblet, Dubois, van Milgen, Warpechowski and Carre2007; Rivera-Torres et al., Reference Rivera-Torres, Noblet, Dubois and van Milgen2010) showed that the AHP represented 9% of the ME intake. In this study, AHP also represented 9% of ME intake up to 7 weeks of age, but it strongly increased after 16 weeks of age and represented up to 25% and 15% of ME intake in the male and female turkeys, respectively. This increase in AHP may be explained by changes in social behavior between individuals, especially in males, as they approach sexual maturity. Rather than expressing it as a fraction of ME intake, AHP appeared less variable when expressed relative to metabolic BW, representing 170 and 116 kJ/(kg BW)0.75 per day in male and female turkeys, respectively.
In contrast to AHP and FHP, it appears to be more difficult to describe TEF as a function of metabolic BW. In line with previous observations (Rivera-Torres et al., Reference Rivera-Torres, Noblet, Dubois and van Milgen2010), the TEF decreased with increasing age from 21% to 3% of ME intake in males and from 20% to 9% in females. In broilers, Noblet et al. (Reference Noblet, Dubois, van Milgen, Warpechowski and Carre2007) observed a TEF to ME ratio of 16%. The TEF is directly related to the amount and nature of nutrient intake and metabolism, and to the partitioning of nutrients between REP and REL. The biochemical efficiency to deposit body lipid is greatest for dietary lipids, intermediate for carbohydrates and lowest for dietary protein (van Milgen, Reference van Milgen2002). The decrease of this ratio with increasing BW may be due to the changes in the composition of BW gain. More specifically, the greater contribution of REL relative to RE resulted in a greater net efficiency of energy utilization (i.e. NE to ME ratio) because the energy efficiency of lipid retention is greater than that of protein (i.e. k f is greater than k p). In this study, the change in the TEF to ME ratio between the different stages of growth is due to the change in diet composition (Table 1) and to the change in body composition during growth. To separate these two confounding factors, different diets could be used at a given stage of growth.
The results of this study indicate that there are important differences in energy utilization between male and female turkeys during growth. Female turkeys retained a greater proportion of the ME intake than male turkeys (i.e. greater RE to ME ratio), but the greater energy retention was mainly due to a greater lipid retention.
Acknowledgments
The authors thank Yolande Jaguelin, Régis Janvier, Francis Le Gouevec and Anne Pasquier (INRA, Saint-Gilles, France) for their collaboration in this experiment and the Euronutrition Research Center (Sourches, France) for feed manufacturing.