



Schizophrenia is associated with substantial excess mortality. Reference Brown1,Reference Laursen, Nordentoft and Mortensen2 Although direct manifestations of schizophrenia, such as suicides and accidents, drive part of the elevated mortality rate, Reference Correll, Solmi, Croatto, Schneider, Rohani-Montez and Fairley3 indirect physical manifestations of the illness also play a substantial role. Indeed, individuals with schizophrenia have markedly increased rates of obesity and type 2 diabetes. Reference Annamalai, Kosir and Tek4,Reference Suvisaari, Keinanen, Eskelinen and Mantere5 A key contributing factor is treatment with antipsychotics, which are associated with weight gain and adverse effects on glucose metabolism that may occur independently of weight gain. Reference Bak, Fransen, Janssen, van Os and Drukker6–Reference Chen, Huang, Shao, Chen and Deng8 In addition, illness-related factors, such as low physical activity, poor diet and alcohol consumption, further increase the risk of obesity and metabolic dysregulation among individuals with schizophrenia. Reference Ratliff, Palmese, Reutenauer, Liskov, Grilo and Tek9–Reference Fond, Yon, Tran, Mallet, Urbach and Leignier11
Recently, the potential benefits of glucagon-like peptide-1 receptor agonists (GLP-1RAs) for individuals with schizophrenia have received substantial attention. Reference Trott, Arnautovska and Siskind12 Since their introduction, GLP-1RAs have been widely prescribed, initially for treatment of type 2 diabetes and more recently for management of obesity. Reference Westermeier and Fisman13,Reference Drucker, Habener and Holst14 Given their well-documented effects on weight reduction and glycaemic control, GLP-1RAs could potentially address weight gain, prediabetes and type 2 diabetes in the context of schizophrenia. Reference Vilsboll, Christensen, Junker, Knop and Gluud15–Reference Ma, Lin, Dai, Lin, Huang and Liu17 This has been explored in a series of randomised controlled trials (RCTs) and one feasibility study. Reference Ganeshalingam, Uhrenholt, Arnfred, Gaede, During and Stenager18–Reference Larsen, Vedtofte, Jakobsen, Jespersen, Jakobsen and Svensson21 The overall findings of these studies are that GLP-1RA treatment reduces body weight, waist circumference and haemoglobin A1c (HbA1c) levels, highlighting the potential of GLP-1RAs as a treatment option for individuals with schizophrenia at elevated risk of cardiometabolic disease.
However, as demonstrated by Taipale et al, Reference Taipale, Schneider-Thoma, Pinzón-Espinosa, Radua, Efthimiou and Vinkers22 nearly 80% of individuals with severe mental disorder are ineligible for participation in typical RCTs, limiting their generalisability. This emphasises the need for studies on GLP-1RAs, including broader samples of individuals with schizophrenia. To address this gap, we used Danish nationwide registers to examine if initiation of GLP-1RA treatment is followed by reductions in HbA1c, low-density lipoprotein (LDL) and triglyceride levels (the latter two as proxies for weight loss) in individuals diagnosed with schizophrenia.
Method
Registers
Using the unique personal identifier from the Danish Civil Registration System (DCRS), Reference Pedersen23 we linked the following registers at the level of the individual: the Danish National Patient Register (DNPatR), Reference Lynge, Sandegaard and Rebolj24 the Danish National Prescription Registry (DNPreR), Reference Kildemoes, Sorensen and Hallas25 the Register of Laboratory Results for Research (RLRR), Reference Arendt, Hansen, Ladefoged, Sørensen, Pedersen and Adelborg26 the Population Education Register (PER) and the Employment Classification Module (ECM). Reference Thygesen, Daasnes, Thaulow and Bronnum-Hansen27 Specifically, we obtained information on birthplace, date of birth and marital status from the DCRS. Data on diagnoses from Danish psychiatric and somatic hospitals were obtained from the DNPatR (see Supplementary Table 1). In the DNPatR, diagnoses were registered in accordance with the ICD-8 from 1977 until 31 December 1993, when it was replaced by the ICD-10. Diagnoses from hospital admissions were available from 1977 to 1994. Diagnoses from admissions, out-patient treatment and emergency room visits were available from 1995 onward. Data on redeemed prescriptions were obtained from the DNPreR. The DNPreR contains individual-level information on all prescriptions redeemed at pharmacies in Denmark since 1995. Data on HbA1c, LDL and triglyceride levels were obtained from the RLRR. The RLRR contains some laboratory results from 2008, and has complete coverage of both hospitals and general practitioners in the North Denmark Region, Central Denmark Region and Region Zealand since 2013; the Capital Region since 2014 and the Southern Denmark Region since 2015. Reference Arendt, Hansen, Ladefoged, Sørensen, Pedersen and Adelborg26 Data on the highest obtained level of education and employment status were obtained from the PER and the ECM, respectively. The PER contains information on the highest completed level of education since 1981. The ECM contains information about labour market attachment since 1976.
Study population
We used the DNPatR to identify all individuals diagnosed with schizophrenia (ICD-10 code F20) between 1 January 1996 and 1 November 2023. Among those, we used the DNPreR to identify the subset of individuals redeeming their first prescription for a GLP-1RA (Anatomical Therapeutic Chemical code: A10BJ) after the schizophrenia diagnosis in the period from 9 May 2007 to 1 November 2023.
Exposure
Exposure was classed as initiation of GLP-1RA treatment, defined as the date (index date) of the first redeemed prescription for a GLP-1RA.
Outcome
The outcomes were changes in metabolic biomarkers (HbA1c, LDL and triglyceride levels) following initiation of GLP-1RA treatment.
Statistical analyses
All analyses were conducted separately according to the indication code recorded on the first redeemed GLP-1RA prescription. Individual indication codes were grouped as either diabetes or overweight (see Supplementary Table 2).
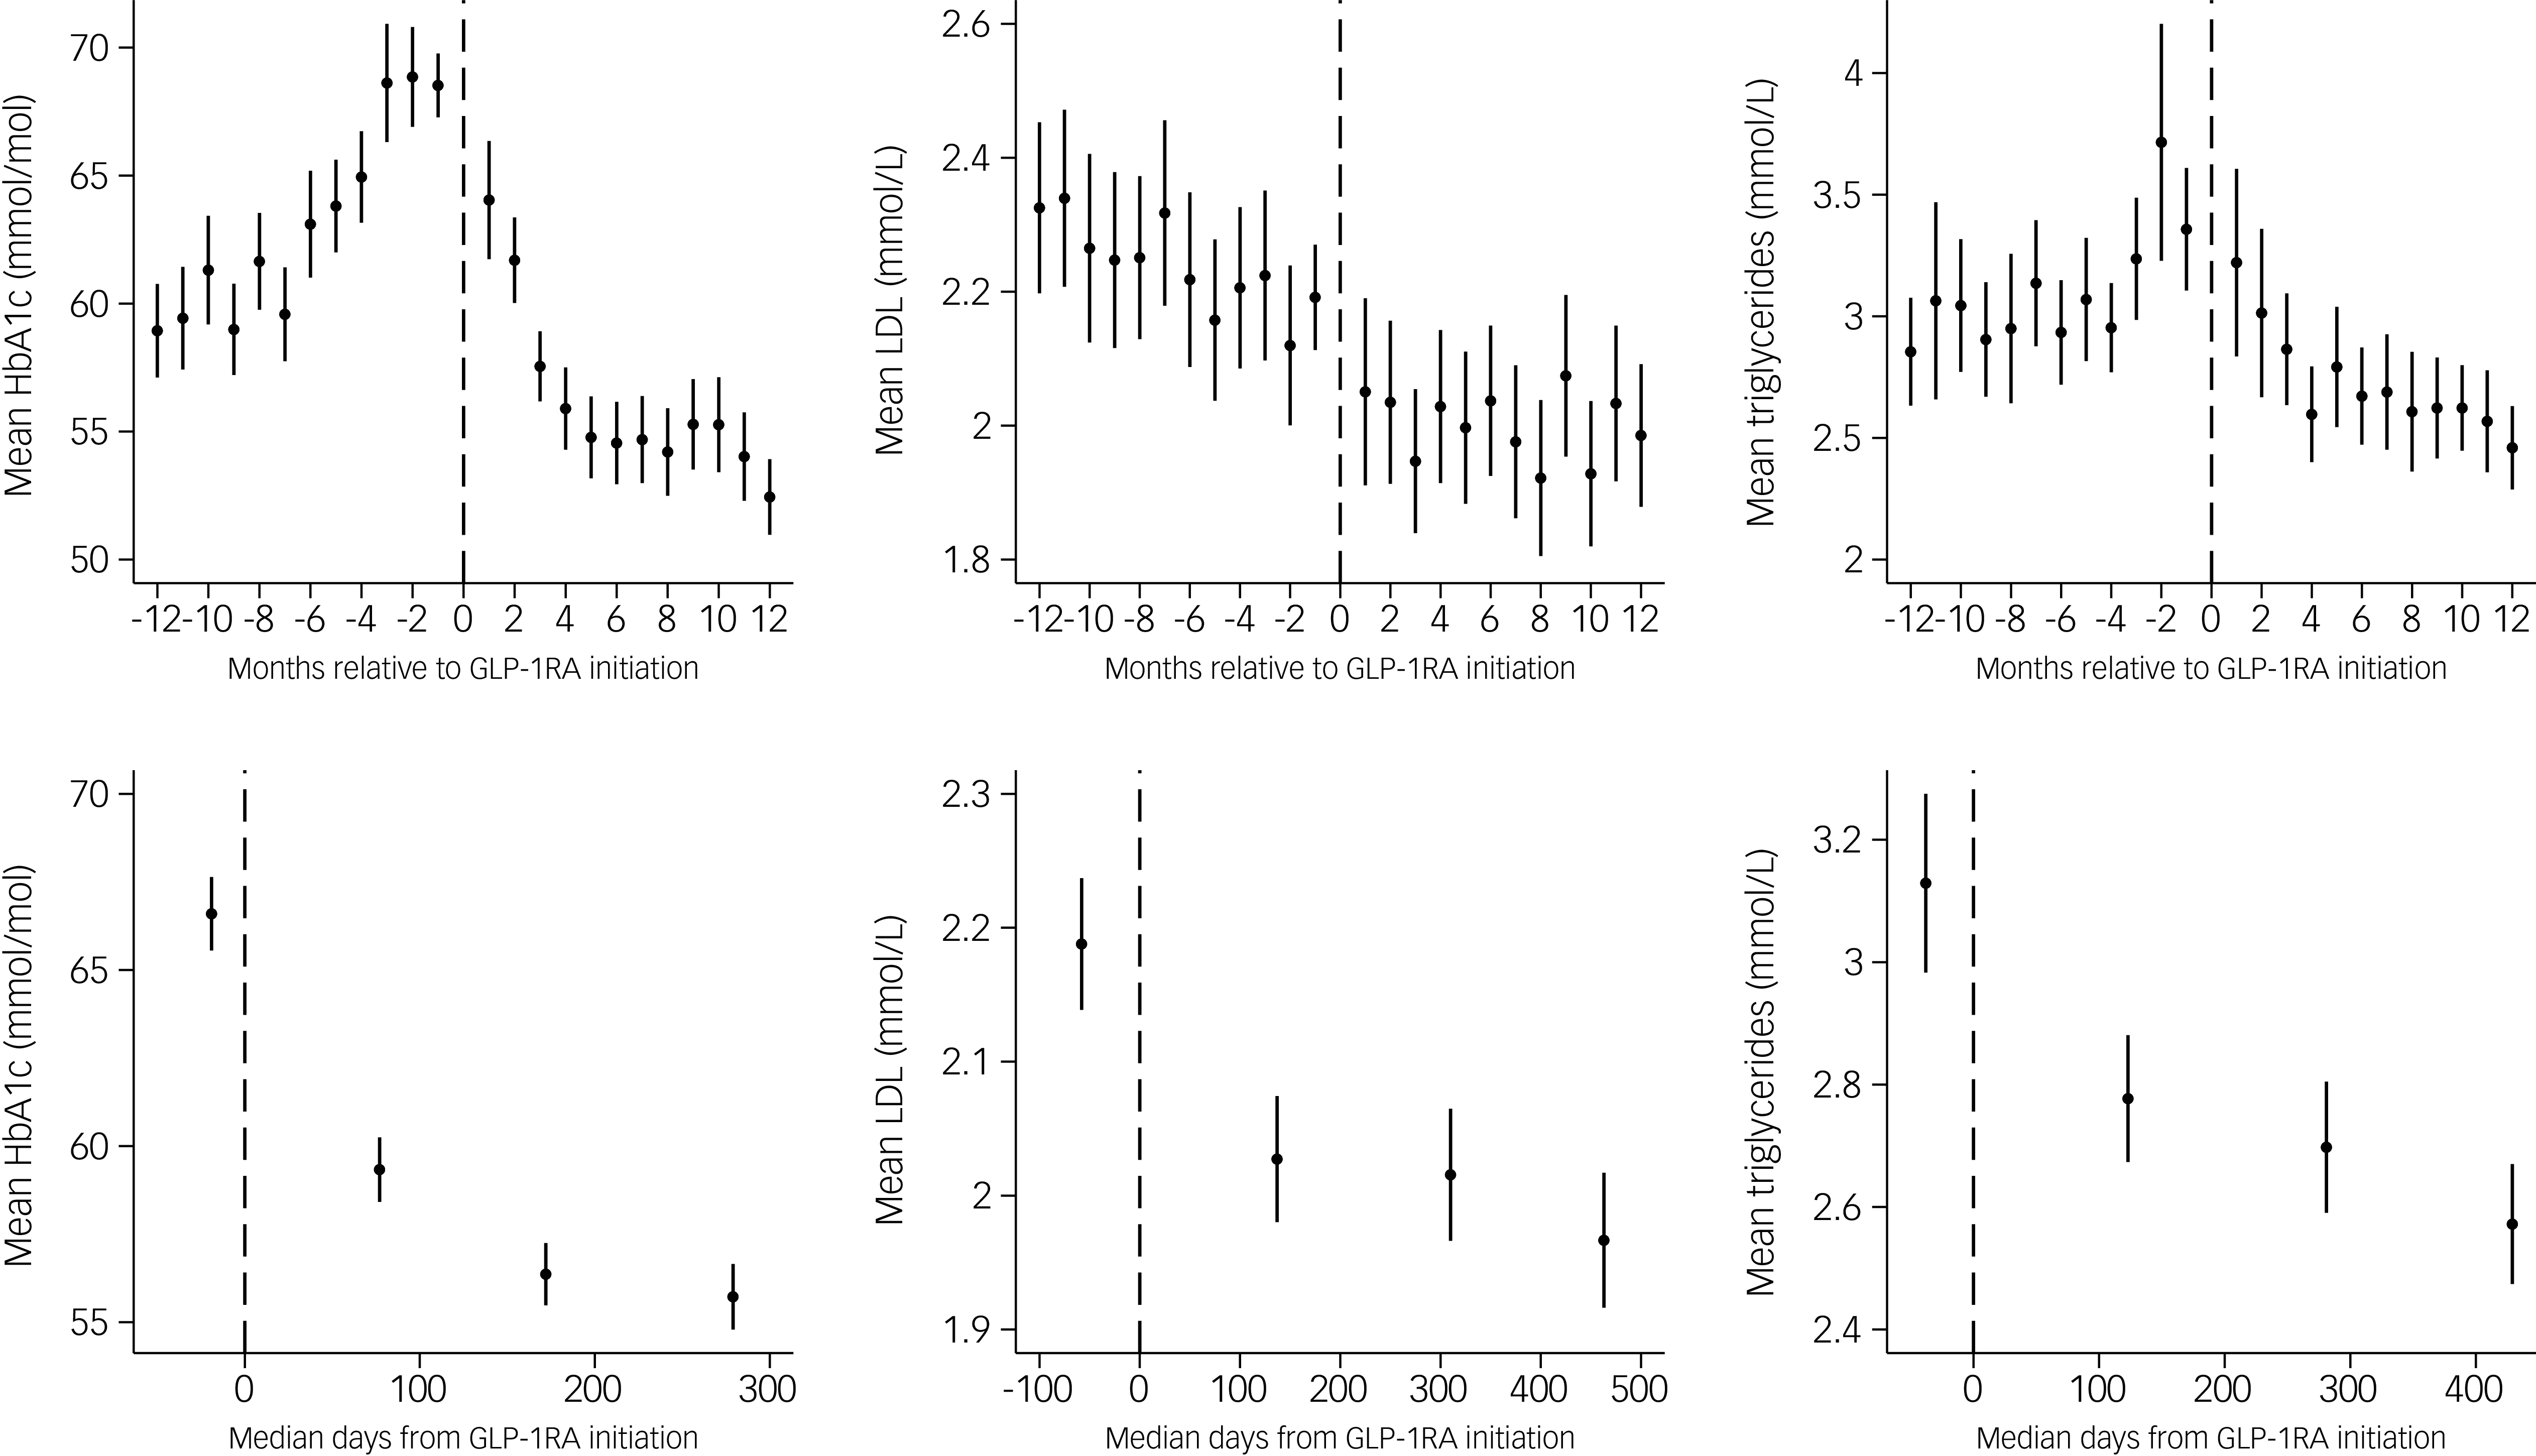
First, we visualised HbA1c, LDL and triglyceride levels preceding and following treatment initiation with a GLP-1RA (index date), using two different approaches. First, we illustrated changes by plotting mean levels (with 95% confidence intervals) for each month in the year preceding and following the index date, using all available HbA1c, LDL and triglyceride levels from the entire study population. Subsequently, we plotted the mean level for the pre-index value (defined as the most recent HbA1c, LDL or triglyceride measurement preceding the index date) and the first, second and third post-index mean levels. Here, the corresponding x-axis values represented the median time from the index date to each measurement.
Second, we conducted interrupted time-series analyses, Reference Bernal, Cummins and Gasparrini28 using a linear mixed-effects model to formally quantify changes in HbA1c, LDL and triglyceride levels, respectively, following initiation of GLP-1RA treatment. The graphical visualisations included all available biomarker measurements, whereas the interrupted time-series analyses were restricted to individuals with at least one of the respective biomarker values measured before as well as after GLP-1RA initiation, to allow for estimation of within-person level and trend changes. Time was defined relative to the individual index date (GLP-1RA initiation), expressed as months before and after treatment start. The model included fixed effects for (a) the underlying pre-index trend in HbA1c, LDL and triglycerides; (b) an immediate level change following GLP-1RA initiation and (c) a change in trend following GLP-1RA initiation and random intercepts and slopes to account for individual differences. Here, a change in trend refers to whether the rate of change in the outcome (the slope) differs between the pre- and post-GLP-1RA periods. For example, if HbA1c was gradually rising before GLP-1RA initiation, a negative change in trend would indicate that HbA1c was gradually declining or the increase became less steep following GLP-1RA treatment, independent of any immediate level change at the time of treatment initiation (see Fig. 1 for an illustration).
Illustration of the interrupted time-series analysis. The figure illustrates changes in HbA1c, LDL and triglycerides relative to GLP-1RA treatment initiation (month 0). The model estimates three parameters: pre-index trend, immediate level change at treatment initiation and post-index trend. The dashed line projects the counterfactual trend without treatment. Points reflect individual-level data points. GLP-1RA, glucagon-like peptide-1 receptor agonist; HbA1c, haemoglobin A1c; LDL, low-density lipoprotein.

Because of the strong interdependence between the tests and risk of type 2 error, correction for multiple testing was not employed. Reference Rothman29
Post-hoc analyses
First, we performed a negative control analysis by using thrombocyte levels. As in the main analyses, we illustrated absolute thrombocyte levels before and after GLP-1RA treatment initiation. This analysis was conducted to assess whether a laboratory marker not expected to be affected by GLP-1RA treatment initiation showed a similar change around treatment initiation.
Second, because LDL levels decreased before GLP-1RA treatment initiation, we repeated the interrupted time-series analysis after excluding individuals who had redeemed a prescription for a lipid-modifying agent (Anatomical Therapeutic Chemical code: C10) in the 60 days before or on the index date. This analysis was conducted to assess whether the observed changes in LDL and triglyceride levels could be explained by initiation of lipid-modifying treatment shortly before or on the date of GLP-1RA treatment initiation.
Ethics
The Danish Health Data Authority and Statistics Denmark approved the use of the data for the purpose of this study. Register-based studies are exempt from ethical review board approval according to Danish law. The study is registered on the internal list of research projects having Aarhus University as data steward.
Results
Baseline characteristics
We identified 3042 individuals who initiated GLP-1RA treatment (1659 with an indication of diabetes and 1383 with an indication of overweight) after being diagnosed with schizophrenia (see flow diagram in Supplementary Fig. 1). Their median age was 42.4 years (interquartile range, 32–53) and 58.8% were female (Supplementary Table 3). In the year preceding GLP-1RA treatment initiation, 1323 (79.7%) individuals had used an antipsychotic drug in the diabetes indication group and 845 individuals (61.1%) in the overweight indication group. In the diabetes indication group, 186 (11.2%) had used clozapine and 233 (14.0%) had used olanzapine. In the overweight indication group, 100 (7.2%) had used clozapine and 129 (9.3%) had used olanzapine. Notably, there were also marked sociodemographic/clinical differences between individuals in the diabetes and the overweight indication groups, as the former were more likely to be male (50.2 v. 30.4%), outside the workforce (80.7 v. 51.4%) and to have a Charlson comorbidity index ≥1 (47.0 v. 10.4%).
GLP-1RA treatment and HbA1c
Figures 2 and 3 show HbA1c levels preceding and following GLP-1RA treatment initiation. In both the diabetes and overweight indication groups, mean HbA1c levels increased leading up to GLP-1RA treatment initiation and were followed by a decrease in HbA1c levels.
Changes in HbA1c, LDL and triglyceride levels in the year preceding and following initiation of GLP-1RA treatment, along with the mean level for the pre-index value and the first, second and third post-index mean levels for the patients having diabetes as treatment indication. GLP-1RA, glucagon-like peptide-1 receptor agonist; HbA1c, haemoglobin A1c; LDL, low-density lipoprotein.

Changes in HbA1c, LDL and triglyceride levels in the year preceding and following initiation of GLP-1RA treatment, along with the mean level for the pre-index value and the first, second and third post-index mean levels for the patients having overweight as treatment indication. GLP-1RA, glucagon-like peptide-1 receptor agonist; HbA1c, haemoglobin A1c; LDL, low-density lipoprotein.

Fig. 3 Long description
The image contains six line graphs. Panel A: A line graph shows mean HbA1c levels in mmol/mol over months relative to GLP-1RA initiation. The x-axis ranges from -12 to 12 months, and the y-axis ranges from 34 to 39 mmol/mol. Panel B: A line graph shows mean LDL levels in mmol/L over months relative to GLP-1RA initiation. The x-axis ranges from -12 to 12 months, and the y-axis ranges from 2.4 to 3 mmol/L. Panel C: A line graph shows mean triglyceride levels in mmol/L over months relative to GLP-1RA initiation. The x-axis ranges from -12 to 12 months, and the y-axis ranges from 1.6 to 2.6 mmol/L. Panel D: A line graph shows mean HbA1c levels in mmol/mol over median days from GLP-1RA initiation. The x-axis ranges from -100 to 400 days, and the y-axis ranges from 35 to 37 mmol/mol. Panel E: A line graph shows mean LDL levels in mmol/L over median days from GLP-1RA initiation. The x-axis ranges from -100 to 400 days, and the y-axis ranges from 2.6 to 2.85 mmol/L. Panel F: A line graph shows mean triglyceride levels in mmol/L over median days from GLP-1RA initiation. The x-axis ranges from -100 to 400 days, and the y-axis ranges from 1.7 to 2.2 mmol/L.
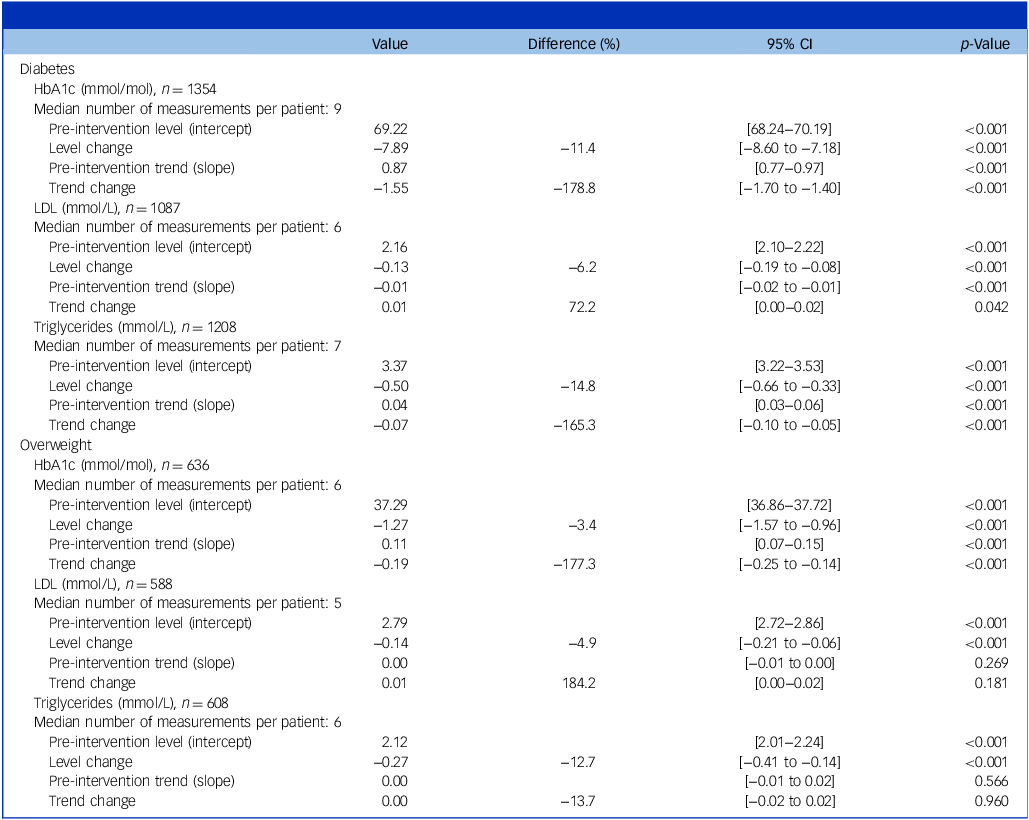
Table 1 lists results of the interrupted time-series analyses. In the diabetes indication group, GLP-1RA treatment initiation was followed by a reduction in mean HbA1c of 11.4% (p < 0.001) and a trend change of −178.8% (p < 0.001). In the overweight indication group, GLP-1RA treatment initiation was followed by a reduction in mean HbA1c of 3.4% (p < 0.001) and a trend change of −177.3% (p < 0.001).
Interrupted time-series analysis of changes in HbA1c, LDL and triglycerides

Table 1 Long description
A table comparing changes in HbA1c, LDL, and triglycerides for diabetes and overweight groups. The table has 10 rows and 5 columns. Column headers are Value, % Difference, 95% CI, and p-Value. Row labels include Diabetes and Overweight with subcategories for HbA1c, LDL, and Triglycerides. Each subcategory lists pre-intervention level, level change, pre-intervention trend, and trend change with corresponding values, percentage differences, confidence intervals, and p-values. Notable trends include significant reductions in HbA1c, LDL, and triglycerides levels post-intervention for both diabetes and overweight groups.
HbA1c, haemoglobin A1c; LDL, low-density lipoprotein.
GLP-1RA treatment and LDL
Figures 2 and 3 show LDL levels preceding and following GLP-1RA treatment initiation. In the diabetes indication group, mean LDL levels decreased leading up to GLP-1RA treatment initiation and continued to decrease thereafter. In the overweight indication group, mean LDL levels were relatively stable before GLP-1RA treatment initiation and decreased thereafter.
Table 1 lists results of the interrupted time-series analyses. In the diabetes indication group, GLP-1RA treatment initiation was followed by an immediate reduction in mean LDL of 6.2% (p < 0.001). However, LDL levels were already declining before GLP-1RA treatment initiation, and the positive trend-change estimate indicated that this decline became less steep after treatment initiation, with a trend change of 72.2% (p = 0.042). In the overweight indication group, GLP-1RA treatment initiation was followed by a reduction in mean LDL of 4.9% (p < 0.001) and a trend change of 184.2% (p = 0.18).
GLP-1RA treatment and triglycerides
Figures 2 and 3 show triglyceride levels preceding and following GLP-1RA treatment initiation. In the diabetes indication group, mean triglyceride levels increased leading up to GLP-1RA treatment initiation and decreased thereafter. In the overweight indication group, mean triglyceride levels were relatively stable before GLP-1RA treatment initiation and decreased thereafter.
Table 1 presents the results of the interrupted time-series analyses. In the diabetes indication group, GLP-1RA treatment initiation was followed by a reduction in mean triglyceride levels of 14.8% (p < 0.001) and a trend change of −165.3% (p < 0.001). In the overweight indication group, GLP-1RA treatment initiation was followed by a reduction in mean triglyceride levels of 12.7% (p < 0.001) and a trend change of −13.7% (p = 0.960).
Post-hoc analyses
We observed no change in mean thrombocyte levels following GLP-1RA treatment initiation (Supplementary Fig. 2). Also, similar findings were observed when we excluded individuals treated with a lipid-modifying agent in the 60 days before or on the index date (Supplementary Table 4).
Discussion
In this nationwide study from Denmark, we found that GLP-1RA treatment was followed by clinically and statistically significant reductions in HbA1c, LDL and triglyceride levels in individuals with schizophrenia. The findings of this study align with three recently published RCTs examining the effect of GLP-1RA treatment allocation on body weight, waist circumference, HbA1c and lipid levels in individuals with schizophrenia treated with antipsychotics. Reference Ganeshalingam, Uhrenholt, Arnfred, Gaede, During and Stenager18,Reference Sass, Klausen, Schwarz, Rasmussen, Giver and Hviid20,Reference Larsen, Vedtofte, Jakobsen, Jespersen, Jakobsen and Svensson21 In these trials, allocation to GLP-1RA treatment reduced body weight, waist circumference and HbA1c levels, whereas the findings for lipid levels were more inconsistent. Reference Ganeshalingam, Uhrenholt, Arnfred, Gaede, During and Stenager18,Reference Sass, Klausen, Schwarz, Rasmussen, Giver and Hviid20,Reference Larsen, Vedtofte, Jakobsen, Jespersen, Jakobsen and Svensson21 Larsen et al and Ganeshalingam et al Reference Ganeshalingam, Uhrenholt, Arnfred, Gaede, During and Stenager18,Reference Larsen, Vedtofte, Jakobsen, Jespersen, Jakobsen and Svensson21 reported reductions in LDL levels following GLP-1RA treatment, whereas Sass et al Reference Sass, Klausen, Schwarz, Rasmussen, Giver and Hviid20 did not observe a clear difference in LDL levels. Furthermore, significant reductions in triglyceride levels were only reported by Ganeshalingam et al. Reference Ganeshalingam, Uhrenholt, Arnfred, Gaede, During and Stenager18 A potential explanation for the more pronounced lipid reductions observed in the present study is that individuals initiating GLP-1RA treatment in routine clinical care may also have received concurrent cardiometabolic interventions, such as lipid-lowering drugs (statins) and lifestyle counselling. This interpretation is supported by the observed LDL trajectories, where mean levels were already decreasing before initiation of GLP-1RA treatment.
Although prior studies have supported the effectiveness of GLP-1RA treatment in real-world populations of patients with type 2 diabetes, Reference Yazdanfard, Zareini, Wood-Kurland, Pedersen-Bjergaard and Andersen30–Reference Frazer, Swift, Sargent, Leszko, Buysman and Gronroos32 to our knowledge, no studies have investigated changes in HbA1c, LDL and triglyceride levels following GLP-1RA treatment initiation specifically in individuals with schizophrenia at the nationwide level. As the individuals most severely affected by mental disorder are underrepresented in RCTs, Reference Taipale, Schneider-Thoma, Pinzón-Espinosa, Radua, Efthimiou and Vinkers22 the generalisability of these studies is suboptimal. Therefore, this study extends existing RCT evidence by suggesting that GLP-1RA treatment initiation is followed by improved HbA1c, LDL and triglyceride levels in individuals with schizophrenia in real-world clinical settings. This is a population characterised by poor adherence to drugs used to treat physical illness, low physical activity, poor diet, high rates of alcohol and drug abuse, and frequent treatment with psychopharmacological polypharmacy, all of which may adversely affect adherence and response to GLP-1RA treatment. Reference Haussleiter, Emons, Hoffmann and Juckel33–Reference Højlund, Köhler-Forsberg, Gregersen, Rohde, Mellentin and Anhøj37 By showing that GLP-1RA treatment initiation was followed by immediate reductions in HbA1c, LDL and triglyceride levels, as well as favourable HbA1c trajectories during follow-up, our findings suggest that GLP-1RA may reduce metabolic syndrome in a population characterised by substantial cardiometabolic risk and with impaired glucose homeostasis and insulin resistance. Reference Perry, McIntosh, Weich, Singh and Rees38–Reference Henderson, Vincenzi, Andrea, Ulloa and Copeland40 The substantial sociodemographic/clinical differences between individuals in the diabetes and the overweight indication groups (the former were more likely to be male, outside the workforce, have recently used an antipsychotic and have a Charlson comorbidity index ≥1) and the similarity of the apparent impact of GLP-1RA treatment lend further support to the generalisability of the findings. Taken together, these findings support that GLP-1RA treatment may represent an important therapeutic option for mitigating weight gain, diabetes risk and other cardiometabolic adverse outcomes associated with antipsychotic treatment and schizophrenia itself. Reference Ratliff, Palmese, Reutenauer, Liskov, Grilo and Tek9–Reference Fond, Yon, Tran, Mallet, Urbach and Leignier11
Limitations
There are some limitations that should be acknowledged. First, although LDL and triglyceride levels may serve as valid proxies for weight-related metabolic change, they are not direct measures of weight reduction. In this study, we did not have information on body weight and were therefore unable to investigate whether initiation of GLP-1RA treatment was followed by a change in body weight as well. Second, although we included all individuals with schizophrenia initiating GLP-1RA treatment, the study population likely still represents a selected subgroup of individuals with schizophrenia. Individuals at the more severe end of the schizophrenia severity spectrum may be less likely to receive medical treatment, including GLP-1RA, because of poorer treatment adherence, reduced healthcare engagement or reluctance to initiate injectable therapy. Reference Haussleiter, Emons, Hoffmann and Juckel33,Reference Bjork Bramberg, Torgerson, Norman Kjellstrom, Welin and Rusner34 In addition, socioeconomic differences may influence access to newer medications such as GLP-1RAs. However, as we looked at measurements before and after treatment initiation with a GLP-1RA, this does not bias our findings, but may limit the generalisability of the findings. Third, we did not have information on lifestyle factors, such as physical activity, diet and smoking, that may have contributed to the observed changes over time. In addition, the interrupted time-series design assumes that no other major intervention affecting the outcome occurred simultaneously with GLP-1RA treatment initiation. However, GLP-1RA initiation may coincide with other cardiometabolic interventions, including lifestyle counselling, changes in lipid-lowering treatment or increased clinical follow-up. This is particularly relevant for the diabetes indication group, in which LDL levels were already declining before initiation of GLP-1RA treatment, suggesting that other interventions may already have been introduced before or around the time of treatment initiation. The observed reductions in HbA1c, LDL and triglyceride levels should therefore not be attributed solely to GLP-1RA treatment initiation. Fourth, the analyses of HbA1c, LDL and triglyceride trajectories were based on blood samples obtained in routine clinical care, and not all individuals contributed with measurements at all time points. Individuals with more frequent follow-up measurements likely differ from those with fewer measurements, potentially introducing selection bias. However, the mixed-effects model in the interrupted time-series analysis partly mitigated this by formally modelling level and trend changes across all available observations, rather than relying on complete follow-up at fixed time points. Fifth, only 71% of the individuals with schizophrenia in the study population were registered as having redeemed a prescription for an antipsychotic in the year leading up to initiation of GLP-1RA treatment. This is likely an underestimation because individuals newly diagnosed with schizophrenia and those with a forensic sanction receive antipsychotics free of charge dispensed by psychiatric hospital services that are consequently not registered in DNPreR, providing data for this study. Sixth, the interrupted time-series analyses were restricted to individuals with at least one biomarker measurement before and after GLP-1RA treatment initiation. This restriction was required to estimate within-person level and trend changes, but may have introduced structural selection bias, as individuals without both pre- and post-index measurements may have differed from those included in the analysis with respect to adverse effects, mortality and treatment response. The graphical visualisations of the biomarker measurements, however, were based on all available measurements and showed biomarker trajectories consistent with the interrupted time-series analyses. Seventh, we cannot exclude regression to the mean as a partial explanation for the findings of this study. GLP-1RA treatment might have been initiated at a time when HbA1c, LDL or triglycerides were unusually high or deteriorating, which could be followed by subsequent reductions even in the absence of a pharmacological effect of the GLP-1RA.
In conclusion, in our study based on nationwide data from Denmark, initiation of GLP-1RA treatment was followed by clinically meaningful reductions in HbA1c, LDL and triglyceride levels among individuals with schizophrenia. These findings suggest that the metabolic benefits of GLP-1RA treatment found in randomised clinical trials in schizophrenia extend to real-world clinical settings.
Supplementary material
The supplementary material is available online at https://doi.org/10.1192/bjp.2026.10863
Data availability
C.R. had full access to all the data in the study and takes responsibility for the integrity of the data and the accuracy of the data analysis. The data used for this study cannot be shared according to Danish law. For researchers affiliated with a Danish research institution, access to the data can be achieved upon application to Statistics Denmark and the Danish Health Data Authority.
Acknowledgements
Generative artificial intelligence tools were not used in the design, conduct, analysis or interpretation of this research.
Author contributions
N.B.M. contributed to study conceptualisation, methodology, investigation, formal analysis, interpretation of data and writing the original draft of the manuscript. A.Ø. contributed to study methodology, interpretation of data and reviewing and editing the manuscript. S.D.Ø. contributed to study conceptualisation, methodology, data curation, investigation, interpretation of data, supervision and reviewing and editing the manuscript. C.R. contributed to study conceptualisation, methodology, investigation, formal analysis, interpretation of data, supervision and reviewing and editing the manuscript.
Funding
This study received no specific grant from any funding agency, commercial or not-for-profit sectors.
Declaration of interest
Outside of this study, C.R. reports funding by the Lundbeck Foundation (grant numbers R484-2024-1666 and R358-2020-2342) and the Novo Nordisk Foundation via the Danish Diabetes Academy (grant number NNF17SA0031406). C.R. received the 2020 Lundbeck Foundation Talent Prize. Outside of this study, S.D.Ø. reports funding from the Lundbeck Foundation (grants R358-2020-2341 and R344-2020-1073), the Danish Cancer Society (grant R283-A16461), the Danish Agency for Digitisation Investment Fund for New Technologies (grant 2020-6720) and Independent Research Fund Denmark (grants 7016-00048B and 2096-00055A). S.D.Ø. received the 2020 Lundbeck Foundation Young Investigator Prize. S.D.Ø. owns/has owned units of mutual funds with stock tickers DKIGI, IAIMWC, SPIC25KL, DKIEUIXBNP and WEKAFKI, and owns/has owned units of exchange traded funds with stock tickers BATE, TRET, QDV5, QDVH, QDVE, SADM, IQQH, USPY, EXH2, 2B76, MCHI and EUNL. N.B.M. and A.Ø. have no conflicts of interest to declare.






eLetters
No eLetters have been published for this article.