I. INTRODUCTION
In last few years, much attention has been paid globally to the emerging field of spintronics because of rapidly increasing demands of huge data storage capacity and relatively faster data processing. Semiconductors containing very tiny amount of magnetic impurities substituted at the cationic site of host semiconducting lattice, also called dilute magnetic semiconductors (DMSs), exhibit room temperature ferromagnetism (RTFM) and are hence potential candidates for spintronics. After the theoretical report of ferromagnetism in Mn-doped GaAs,Reference Dietl, Ohno, Matsukur, Cibert and Ferrad1 extensive research has been carried out on DMSs to explore their possibility as potential application in spin-based electronic devices such as spin filter and spin transport media.Reference Zutic, Fabian and Sarma2 The efficient control of both charge flow and spin of carriers in DMSs turns the development of spintronic devices with all its new functionalities attainable.
The elementary requirement for a DMS is that it should exhibit ferromagnetic Curie temperature (T C) at/above room temperature. The discovery of ferromagnetic ordering in Co-doped TiO2 by Matsumato et al.Reference Matsumoto, Murakami, Shono, Hasegawa, Fukumura, Kawasaki, Ahmet, Chikyow, Koshihara and Koinuma3 has led focused experimental and theoretical research on the presence of ferromagnetism and potentially applicable mechanisms of ferromagnetism in oxide-based DMS (such as transition metal (TM) doped TiO2) since oxide-based DMS is believed to be an appealing candidate for futuristic spintronic devices having T C at or above room temperature. TiO2 is a wide band gap semiconductor, which mainly crystallizes in anatase and rutile phase having band gap 3.20 and 3.02 eV, respectively. There are several reports available in the literature on TM-doped TiO2 nanocrystalline powder and films describing various synthesis routes, and their structural and magnetic properties emphasizing on their magnetic properties.Reference Hoa and Huyen4–Reference Pinto, Cruz, da Silva, Alves and Godinho9 However, the exact mechanism of RTFM in DMS materials is still a topic of debate. Initially, the carrier induced mechanism was considered to be responsible for the observed ferromagnetic ordering in oxide-based DMS.Reference Priour and Das Sarma10,Reference Yamasaki, Fukumura, Yamada, Nakano, Uneo, Makino and Kawasaki11 However, later, the defect related bound magnetic polaron (BMP) model was proposed by Griffin et al.Reference Griffin, Pakhomov, Wang, Heald and Krishnan12 to explain the observed intrinsic RTFM in highly insulating films of TiO2. It is also reported that the clustering of incorporated magnetic metal may be responsible for RTFM in these systems.Reference Punnoose, Seehra, Park and Moodera13,Reference Stampe, Kennedy, Xin and Parker14 Recently, RTFM is observed in many oxide thin films in pristine form including ZnO, HfO2, and TiO2, and explained on the basis of surface defects and/or interface defects.Reference Xu, Schmidt, Zhou, Potzger, Helm, Hochmuth, Lorenz, Setzer, Esquinazi, Meinecke and Grundmann15–Reference Hong, Sakai, Poirot and Brize17 Therefore, further research is expected to elucidate the exact mechanism of RTFM in TM:TiO2.
Various deposition techniques have been used to synthesize thin films of TM:TiO2. The deposition techniques such as pulsed laser deposition (PLD),Reference Nguyen, Prellier, Sakai and Ruyter18 molecular beam epitaxy (MBE),Reference Chambers, Droubay, Wang, Lea, Farrow, Folks, Deline and Anders19,Reference Kaspar, Droubay, McCready, Nachimuthu, Heald, Wang, Lea, Shutthanandan, Chambers and Toney20 atomic layer deposition (ALD) technique,Reference Mann, Lang, Schwab, Niemelä, Karppinen and Scarel21,Reference Niemelä, Yamauchi and Karppine22 and sputteringReference De, Haque, Tripathi, Rao, Singh, Som and Sahoo23,Reference Gole, Prokes and Glembocki24 involve vapors of depositing material which generally produce high quality oxide films with good crystalline properties. However, these techniques have limitation to the deposition on small sample areas and are not easily tractable to doping with impurity ions. Furthermore, it works on essentially using sophisticated and expensive instrumentation. On the contrary, the preparation of TM:TiO2 by solution-thermal routes such as sol–gel dip coating method,Reference Kharoubi, Bouaza, Benrabah, Ammari and Khiali25,Reference Renugadevi, Venkatachalam, Narayanasamy and Kirupha26 spin coating,Reference Tian, Gao, Deng, Sun, Kong, Yang and Chu27–Reference Xu, Wang, Lin, Liu, Lu, Lu, Lv, Zhang and Du29 microemulsion method,Reference Zielinska, Kowalska, Sobczak, Łacka, Gazda, Ohtani, Hupka and Zaleska30 and spray pyrolysisReference Adomnitel, Luca, Girtan, Sandu, Nica, Sandu and Mardare31,Reference Golego, Studenikin and Cocivera32 offers lower-cost, less time consumption, easier to control the composition and large area deposition. Though the spray pyrolysis TM:TiO2 is prepared by different researchers using different cations, there are only a few reports available in the literature in which TiO2 films are prepared by relatively economical spray pyrolysis technique using Ni ions as dopant at the cationic site.
In the present work, highly insulating Ni incorporated Ti1−xNixO2 films are prepared for different concentrations (x = 0.00, 0.05, 0.10, and 0.15) using the cost-effective spray pyrolysis technique. The considerable point is that, no specific report, to the best of our knowledge, could be found enlighting the presence of RTFM in Ni:TiO2 films prepared by spray pyrolysis. In a recent report, Patil et al.Reference Patil, Suryawanshi, Pathan and Patil33 have prepared thin films of Ni-doped TiO2 to study their gas sensing properties. However, in the present work, the films are characterized by different characterization tools to study their structural, optical, and magnetic properties. From the experimental analysis, it is proposed that the formation of defects and BMPs are most probably be responsible for FM ordering at room temperature in these highly resistive films.
II. EXPERIMENTAL
Thin films of Ti1−xNixO2 (x = 0.00, 0.05, 0.10, and 0.15) are deposited via cost effective spray pyrolysis technique on the quartz substrate using titanylacetylacetonate and nickel-acetate dissolved in ethanol as precursors. The as received, quartz substrates were first cleaned in chromic acid for 5 min. Thereafter, the substrate is rinsed in deionized water. Finally, it was further cleaned ultrasonically in acetone then in ethanol for about 15 min each. Nitrogen is used as a carrier gas at a pressure of 0.45 kg/cm2 on the ultrasonically cleaned substrates heated at ∼450 °C. Six spray cycles each consisting of 60 s spraying time plus 120 s pause time were made to deposit the film from each solution of different Ni ion concentrations. After deposition, the films were annealed in air ambient for half an hour at temperatures around 400 °C. All the films are characterized by using an X-ray diffractometer (Philips X-ray diffractometer, Model X’pert Pro, PANalytical, Almelo, Netherlands) for their phase, particle size, and lattice parameter determination keeping glancing angle of 1°. The average crystallite size (D) is calculated using Scherrer Eq. (1) and lattice parameters (a and c) are calculated from XRD diffractograms using Eq. (2), respectivelyReference Kuznetsov, Machado, Gomes, Achete, Swamy, Mud-dle and Prakapenka34,Reference Wilso, Matijasevich, Mitchell, Schulz and Will35 :
 $$D = {{0.9\lambda } \over {{\beta _{hkl}}\cos \theta }}\quad ,$$
 $${1 \over {{d^2}}} = {{\left( {{h^2} + {k^2}} \right)} \over {{a^2}}} + {{{l^2}} \over {{c^2}}}\quad ,$$
where λ is the X-ray wavelength (1.5406 Å) and βhkl is the FWHM (full width half maximum corrected for instrumental broadening). The symbol ‘θ’ represents half of the Bragg’s angle, d is the interplanar spacing, and h, k, l indicate the miller indices. Optical transmission at room temperature, for normal incidence of light on film surface, measurements are carried out using an UV-Vis spectrophotometer (PerkinElmer, Model Lamda 900, Waltham, Massachusetts, USA) in the range of 300–1100 nm to estimate the band gap energy of the films. Absorption coefficient α is calculated near the absorption edge by the following equationReference Asanuma, Matsutani, Liu, Mihara and Kiuchi36:
 $$\alpha \approx {{ - \ln \left( T \right)} / t}\quad ,$$
where ‘t’ represents the thickness of the film and T represents the transmittance. Optical band gap (E g) for direct allowed transition is calculated by using the following equationReference Tauc, Grigorovich and Vancu37:
 $$\alpha h\nu = B{\left( {h\nu - {E_{\rm{g}}}} \right)^{{1 / 2}}}\quad ,$$
where B is a constant, ν is the frequency of incident photon, and h is Plank’s constant. The value of band gap E g is obtained by extrapolating the linear portion of Tauc’s plot [i.e., (αhν)1/2 versus hν plot] to the energy axis. Film thickness (∼500 nm) is calculated by the envelope methodReference Manifacier, Gasiot and Fillard38 using optical transmission spectra. To identify the presence of ferromagnetic ordering at room temperature in these films, M–H loop (magnetization-magnetic field loop) is recorded using superconducting quantum interference device (SQUID, MPMS-XL 7, Quantum Design, San Diego, California, USA). Reciprocating sample option mode is used to record each magnetization measurement comprising 32 points per scan in a double scan over a 4 cm scan length. Resistivity (ρ) of the synthesized films is determined at room temperature by using Electrometer (Keithley 617, Keithley Instruments, Solon, Ohio, USA) in the two-point probe method. Silver paste was used to make electrical contacts between the fine copper wires and the films. Due to high resistivity of the films, contact resistance can be neglected. Resistivity measurement revealed that all the films are highly insulating with ρ ∼ 107 Ω cm.
III. RESULTS AND DISCUSSION
A. Structural analysis
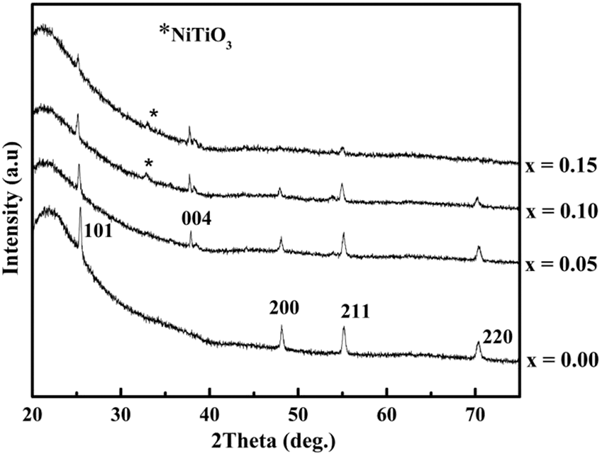
Figure 1 shows the X-ray diffractograms of all the synthesized films. The diffractograms reveal that all the films are primarily crystallized into tetragonal anatase phase of TiO2 having prominent Bragg’s reflection of (101), (200), (211), and (220) plane [consistent with the Joint Committee on Powder Diffraction Standards (JCPDS) card No. 01-071-1166].
X-ray diffractograms of Ti1−xNixO2 (x = 0.00, 0.05, 0.10, and 0.15) thin films.

No signature corresponding to elemental Ni could be seen in any of the diffractograms within the resolution limit of the instrument used. Observed diffraction peaks corresponding to phase pure tetragonal anatase structure of TiO2 is revealed for the film having Ni ion concentration up to ‘x’ = 0.05. However, weak signature of the NiTiO3 phase is observed for the films having higher Ni ion concentration. The evolution of the NiTiO3 phase for the films having higher Ni ion concentration suggested that the solubility of Ni ions in the TiO2 matrix is limited. Furthermore, the intensity of prominent peaks of the anatase phase gradually decreased with the increase in Ni ion concentration. This decrease in intensity and the evolution of the NiTiO3 phase related peak with the incorporation of Ni ions indicate that some of the Ni ions are incorporated in the TiO2 lattice and the extra amount of the same is segregated as the separate phase of NiTiO3. It is worthwhile to note here that XRD results in present case are not in agreement with the recent report published by Kharoubi et al., where Ni ions as a dopant in the TiO2 matrix exhibited no tendency to segregate or precipitate in different phases.Reference Kharoubi, Bouaza, Benrabah, Ammari and Khiali25
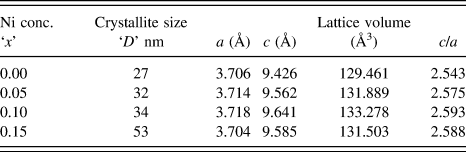
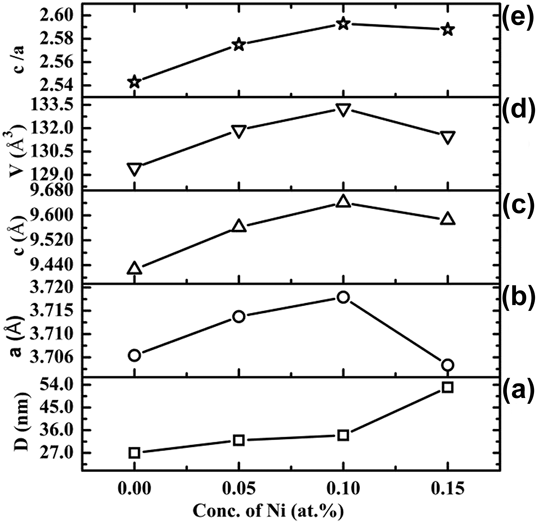
Calculated values of crystallite size, lattice parameters, lattice volume, and ‘c/a’ ratio for dominating the anatase phase of TiO2 both for undoped and doped films are listed in Table I and the variation in the same is also plotted in Fig. 2 with respect to Ni ion concentration added into the TiO2 film matrix. It is observed that the incorporation of Ni ions in the TiO2 matrix results in elongated average crystallite size as well as lattice parameters and ‘c/a’ ratio till x = 0.10. This can be rationalized assuming that the Ni ions are present typically in +2 state in the TiO2 lattice. As per earlier reports by Hwang et al.Reference Hwang, Jeong, Ahn and Kim39 and Jing et al.,Reference Jing, Zhang and Guo40 the incorporation of Ni+2 ions can trigger the elongation of the titania lattice and hence exhibit relatively large average particle size since the radius of Ni+2 (72 pm) is higher than Ti+4 (68 pm). Therefore, Ni+2 ion can easily be incorporated into the crystal lattice of TiO2 to replace some of Ti+4 ions up to some extent. However, for highest concentration of Ni ions (x = 0.15), the lattice parameters are found to decrease resulting ‘c/a’ ratio slightly decreased. Thus the Ni ion incorporation in the TiO2 film induced lattice distortion which is evidenced by change in the c/a ratio.
Crystallite size, lattice parameters, unit cell volume, and c/a ratio of Ti1−xNixO2 films.

Variation in (a) crystallite size ‘D’, (b) lattice parameter ‘a’, (c) lattice parameter ‘c’, (d) lattice volume ‘V’, and (e) c/a ratio of Ti1−xNixO2 (x = 0.00, 0.05, 0.10, and 0.15) thin films.

B. Optical properties
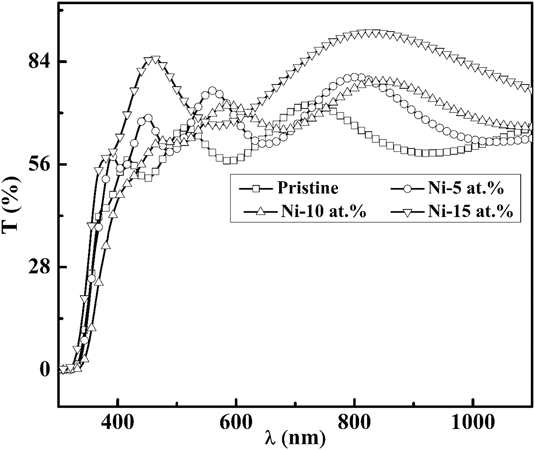
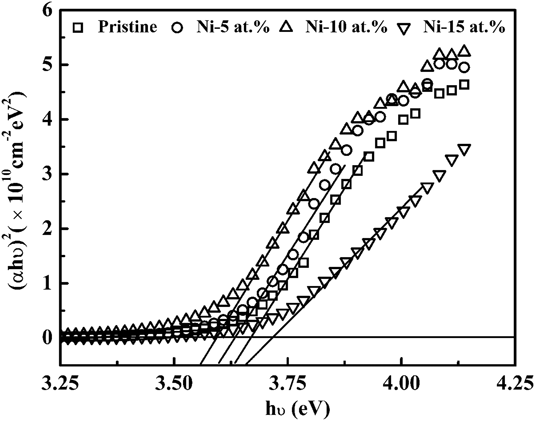
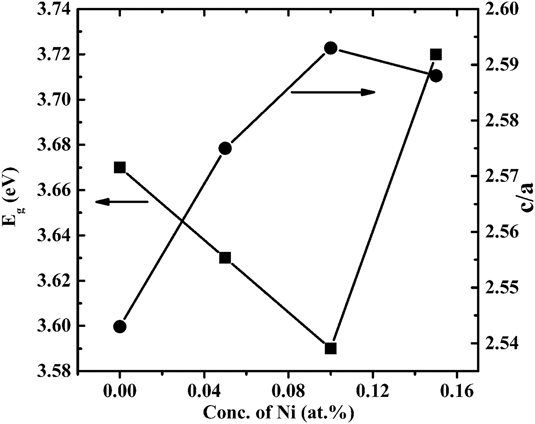
Optical transmission spectra are recorded to determine the optical properties of the synthesized films and are shown in Fig. 3. The spectra show highly transparent nature of all the prepared films in the visible region with an average optical transmission of up to 75%. The variation in transmission suggests the progressive incorporation of added Ni ions in the TiO2 film matrix. The strong absorption below 400 nm arises due to interband electronic transitions. Strong band edge absorption of the pristine TiO2 film is observed around 370, which can be related to band gap absorption of titanium dioxide, from the Tauc’s plot (for direct band gap material) shown in Fig. 4. The plot exhibits redshift in band gap from 3.67 to 3.59 eV for the change in Ni ion concentration from x = 0.00 to 0.10. The decrease in band gap with Ni addition indicates that the Ni ions are successfully incorporated in the TiO2 lattice. This behavior of band gap decreasing up to x = 0.10 can be attributed to new unoccupied electron states in the gap below the conduction band edge due to the location of Ni ions in substitutional sites in the TiO2 matrix. Furthermore, in the contest of lattice distortion, the decrease of the band gap with increasing Ni ion incorporation into the film matrix is found to correlate up to some extent with the lattice distortions as depicted in the c/a parameter ratio shown in Fig. 5, where both c/a and the energy gap are plotted as functions of added Ni ion concentration into the film matrix. As can be seen from the figure, the energy gap decreases from 3.67 to 3.59 eV with the increase in c/a ratio from 2.543 to 2.593 as the concentration of Ni ions changes from ‘x’ = 0.00 to 0.10. The decrease in energy gap with increasing impurity ion content is also reported recently and attributed to TiO2 lattice distortion due to doping of Ni and Nb ion.Reference Kharoubi, Bouaza, Benrabah, Ammari and Khiali25,Reference Pandiyan, Micheli, Ristic, Bartali, Pepponi, Barozzi, Gottardi, Ferrarid and Laidani41 However, for high concentration (x = 0.15), the band gap value is found to increase suddenly up to 3.72 eV with decreasing c/a ratio up to 2.588. This may be due to the presence of NiTiO3 or other impurity phases in the amorphous form.
Optical transmission spectra of Ti1−xNixO2 (x = 0.00, 0.05, 0.10, and 0.15) thin films.

Tauc’s plot for Ti1−xNixO2 (x = 0.00, 0.05, 0.10, and 0.15) thin films.

Variation in optical band gap E g and ‘c/a’ ratio as a function of Ni ion concentration for Ti1−xNixO2 (x = 0.00, 0.05, 0.10, and 0.15) thin films.

C. Magnetic properties
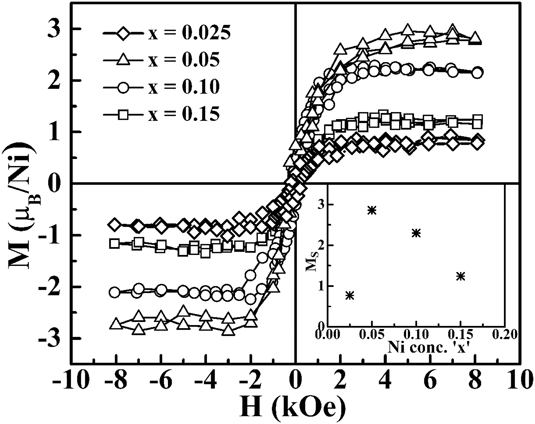
To study room temperature magnetic properties, we carried out M–H measurement on Ti1−xNixO2 (x = 0.00, 0.025, 0.05, 0.10, and 0.15) films at room temperature for all the concentration of Ni ion. The film containing Ni concentration of ‘x’ = 0.025 is considered here just to observe the effect of lower concentration on magnetization. The M–H loops, extracted for diamagnetic contribution of the substrate, are shown in the main panel of Fig. 6. All the M–H loops corresponding to doped samples show nonzero coercevity and remanance, suggesting the presence of ferromagnetic ordering in these samples at room temperature. The ferromagnetic ordering exhibited by the pristine TiO2 filmReference Santara, Giri, Dhara, Imakita and Fujii42,Reference Wang, Zong and Yan43 (not shown here) and Ni-doped film with ‘x’ = 0.025 and 0.15 is observed to be weak compared to that for ‘x’ = 0.05 and 0.10. The observed FM ordering in the films incorporated by Ni ions cannot be assigned to the clusters of metallic Ni or any of its oxide phase because no such phases observed in XRD patterns. Moreover, all the Ni related oxides and Ti–Ni related oxide such as NiO and NiTiO3 are not ferromagnetic at room temperature.Reference Hou, Meng, Jia, Ye, Zhou and Li44 As can be seen in the main panel of Fig. 6, the magnetization of all the Ni ion incorporated films get saturated around 4 kOe magnetic field.
Variation in magnetization with applied magnetic field at room temperature for Ti1−xNixO2 (x = 0.05, 0.025, 0.10, and 0.15) thin films. The inset shows the variation of saturation magnetization M S as a function of added Ni ion concentration ‘x’.

Assuming all the Ni ions incorporated in the TiO2 lattice contribute to its magnetization, the saturation magnetization M S decreases from 2.87 μB/Ni to 1.24 μB/Ni (the inset of Fig. 6) as the concentration of Ni ions increased from x = 0.05 to 0.15. Similar behavior of change in saturation magnetization with increasing Ni content is also reported earlier by Zhang et al.Reference Zhang, Yun and Wang45 in the Ni doped SnO2 system prepared by the sol–gel method. However, for smaller concentration (x = 0.025), magnetization is dropped to 0.77 μB/Ni (as in inset). The observed values of saturation magnetization M S in Ni doped films are much larger as compared to the expected saturation magnetization of metallic Ni, i.e., 0.60 μB/Ni in the bulk form,Reference Chikazumi46 indicating the possible intrinsic nature of ferromagnetism at room temperature. A similar phenomenon of giant magnetization is also observed earlier in Ni-doped ZnO,Reference Liu, Zhu, Song, Zeng and Pan47 SnO2,Reference Hong, Ruyter, Prellier, Sakai and Huong48 and TiO2Reference Park, li Choi, Lee, Kim and Kim49 film and is attributed to the intrinsic origin of ferromagnetism for lower concentrations of doped Ni ions.
Furthermore, on the basis of XRD and M–H measurements, the proposed intrinsic origin of RTFM in our Ni-doped TiO2 films is supported due to following facts: (i) no trace of ferromagnetic metallic Ni clusters or any other ferromagnetic secondary phase could be observed in XRD measurements (ii) second, even if a small amount of such a ferromagnetic Ni clusters or secondary phase is segregated and could not be detected by XRD due to its resolution limit, the observed FM should have been increased due to the addition of more Ni content in the TiO2 lattice as the addition of more Ni ions in TiO2 would increase in segregated Ni clusters or secondary phase due to the large driven force for phase segregation.Reference Jayaram and Rani50,Reference Huang, Wang, Zhong, Zhou and Yan51 The latter case is contrary to the observations in the present work. Thus, it is expected that the observed ferromagnetic ordering at room temperature in Ni incorporated TiO2 films is more likely due to the intrinsic effect though the presence of metallic Ni clusters and other ferromagnetic secondary phases cannot be ruled out completely. Some advanced element selective characterization techniques such as XMCD, HR-TEM, and XANES should be performed for concrete determination about the presence of metallic Ni clusters and other secondary phases.
Now the next point of discussion arises regarding the possible theory which best describes the observed ferromagnetic ordering in Ni ion doped TiO2 films. Many theoretical models have been suggested, such as superexchange, double exchange between the d-states of TMs, free-carrier-mediated indirect exchange so-called Ruderman–Kittel–Kasuya–Yosida (RKKY) interaction, sp–d exchange mechanism, etc.Reference Pearton, Heo, Ivill, Norton and Steiner52 But, there is no general theory that could be formulated so far to explain uniquely the FM ordering at RT in all the magnetically doped oxides. However, in the present case, since all the films are highly insulating at room temperature suggesting that the numbers of free carriers are very less as compared to the Ni ions, so the carrier mediated RKKY interaction is not applicable in the present study. The next possibility of spurious ferromagnetism might be due to super exchange d–d interaction between the neighboring atoms or metallic Ni and Ni related secondary phases. If this were responsible for observed ferromagnetics in this case, then the observed magnetic moment should have enhanced with the addition of more Ni ions in the TiO2 matrix. Since the saturation magnetization decreased with an increase in Ni ion concentration, the possibility of super-exchange interaction responsible for the observed RTFM can be excluded. The observed ferromagnetic ordering at room temperature can best describe in terms of oxygen vacancy mediated BMPs model.Reference Kaminski and Sarma53,Reference Coey, Venkateshan and Fitzgerald54 In an earlier report, Chen et al.Reference Chen, Lu, Cao, Wang and Xu55 have also proposed that vacancy mediated direct-exchange mechanism could be responsible for the FM ordering in Ni doped insulating TiO2. It is well known that the oxygen vacancies are created in the TiO2 lattice when lower valence Ni+2 ions are substituted for higher valence Ti+4 ions. Two oxygen defects are introduced as per following manner to maintain the overall charge neutrality of the lattice:
 $${\rm{T}}{{\rm{i}}^{ + 4}} = {\rm{\ }}2{\rm{N}}{{\rm{i}}^{ + 2}} + {\rm{T}}{{\rm{i}}^{ + 4}} + 2{{\rm{O}}^{ - 2}}\quad .$$
It is reported earlier that a majority of oxygen vacancies, which are generated by the incorporation of lower valence Ni ions at higher valence Ti ion sites, might remain localized near substitutional dopant ion sites. As a consequence of this, unlike the nonlocalized oxygen vacancies, these localized oxygen vacancies do not donate the free electrons for conduction in the TiO2 lattice.Reference Griffin, Pakhomov, Wang, Heald and Krishnan12,Reference Ogale56 and thus leaving the lattice highly insulating even after the creation of oxygen vacancy due to the substitution of Ni ion at the Ti ion site. The formation of BMP in oxide films is closely related to these localized oxygen vacancies. Furthermore, the structural defects, such as grain boundaries, present in oxide films can also produce the oxygen vacancies in the lattice.Reference Kaspar, Droubay, McCready, Nachimuthu, Heald, Wang, Lea, Shutthanandan, Chambers and Toney20,Reference Liu, Gong, Iqbal, He and Yu57 A BMP is formed due to the trapping of an electron in oxygen vacancy and this vacancy is exchange coupled with the moments of magnetic ions. Overlapping of BMPs thus formed can lead to the FM ordering in the oxide lattice. However, with increasing dopant concentration, some antiferromagnetic super-exchange interaction takes place within the neighboring Ni2+ ions through O2− ions (i.e., Ni2+–O2−–Ni2+ super-exchange), which leads to the reduction of the average moment per Ni2+ ion. Furthermore, the noninteracting moments of magnetic ions, which are not involved in the formation of BMPs, are responsible for paramagnetic contribution in magnetic behavior of the sample which can also be accounted as one of the possible reasons for the decrease in saturation magnetization in the present case.
IV. SUMMARY AND CONCLUSION
Insulating films of Ti1−xNixO2 consisting different concentrations of Ni ion (x = 0.00, 0.05, 0.10, and 0.15) are synthesized by the spray pyrolysis technique on ultrasonically cleaned quartz substrates. XRD measurements reveal that all the films are polycrystalline in nature containing dominant anatase phase of TiO2. No trace of metallic Ni could be seen in any of the diffractograms. Segregation of the NiTiO3 phase for higher concentration of added Ni ions indicates that Ni ions are partially incorporated in the TiO2 lattice. Optical transmission spectra reveals a decrease in optical band gap from 3.67 to 3.59 eV as the concentration of Ni ions is increased from x = 0.00 to 0.10 in the TiO2 film matrix. The decrease in band gap found to be consistent with XRD analysis. Magnetic measurement exhibits the presence of ferromagnetic ordering at room temperature in both the undoped and Ni incorporated films. Though the analysis of structural and magnetic measurements supports that the FM ordering at RT in the Ni-doped TiO2 film is more likely due to the intrinsic effect, the presence of metallic Ni clusters or other ferromagnetic phases cannot be ruled out completely in the present study. The observed FM ordering in these films could be best described in terms of the formation of BMPs which creates due to the presence of oxygen vacancy or defects.
ACKNOWLEDGMENT
The authors are thankful to Dr. Sanjay Kumar, Department of Chemistry, UPES for scientific discussion. The SQUID facility at IIT Delhi is thankfully acknowledged.