INTRODUCTION
Intensity-modulated radiation therapy (IMRT) can deliver highly conformal doses to a tumour volume while avoiding or limiting dose to critical structures. The radiation is typically modulated by multiple static fields shaped using multileaf collimators (MLCs) or by continuously moving MLCs. IMRT typically requires inverse planning, whereby the beam geometry, target volume and organ at risk doses are defined and an optimisation algorithm is utilised to determine the beam fluences and delivery parameters that best meet the goals and constraints of the plan. Inverse planning is generally an iterative process in which plan objectives for different structures are changed many times during planning in order to fulfil plan requirements. There are several types of commercial inverse treatment planning systems which utilise different optimisation algorithms in combination with different dose calculation algorithms.Reference Fogliata, Nicolini, Alber, Asell, Clivio, Dobler, Larsson, Lohr, Lorenz, Muzik, Polednik, Vanetti, Wolff, Wyttenbach and Cozzi1
For a two-step optimisation algorithm, the first step involves optimisation of a fluence map for each beam in order to obtain the most favourable dose distribution based on the dose objectives and constraints of the targets and critical structures. In the second step, the fluence map is converted into a sequence of deliverable MLC apertures or segments. The drawback to this approach is that interpreting the optimised fluence into a set of deliverable MLC apertures can lead to degradation of plan quality, once the nature of the delivery process is included in the dose calculation, such as the physical limitations of MLCs. It has been shown that the interpretation step had the effect of ‘smearing’ the dose volume histogram (DVH).Reference Seco, Clark, Evans and Webb2,Reference Dobler, Pohl, Bogner and Koelbl3 Differences between the two steps can be minimised through improved leaf sequencingReference Shepard, Earl, Li, Naqvi and Yu4 or smoothing.Reference Sun and Xia5 Differences in the optimisation, such as smoothing and delivery time (or monitor units (MU)), have been shown to affect the accuracy of treatment delivery.Reference Giorgia, Antonella, Eugenio, Alessandro, Filippo and Luca6
An improved one-step optimisation algorithm known as Direct Aperture Optimisation (DAO), has been studied by a number of authors.3,7,8 An accurate representation of the dose delivery by the MLC segment is directly included in the fluence optimisation process, eliminating the requirement for a separate interpretation from a fluence map. It has been shown that plans optimised using DAO were 32% faster to calculate, required 42% fewer MUs and generated 35% fewer segments than the two-step optimisation method for a commercial treatment planning system.Reference Jones and Williams8 Other studies have shown that DAO plans with the same number of beam segments resulted in fewer MU than the two-step approach without a reduction in plan quality.Reference Dobler, Pohl, Bogner and Koelbl3,Reference Ludlum and Xia7 Work has also been done on reducing the dose calculation times for IMRT plans while maintaining dose calculation accuracy.Reference Siebers, Lauterbach, Tong, Wu and Mohan9
Inverse planning can be a time consuming process and is dependent on the experience of the planner and the dose calculation time required for each component of the optimisation. Therefore one major benefit of faster calculation times, such as introduction of DAO or more efficient dose calculation algorithms, is the ability to re-optimise the plan many times which results in an improved overall solution.
Inverse planning system upgrades are generally aimed at improving the system. The importance of performing inverse treatment planning system quality assurance following upgrades is well documented;Reference Hartford, Palisca, Eichler, Beyer, Devineni, Ibbott, Kavanagh, Kent, Rosenthal, Schultz, Tripuraneni and Gaspar10 however few practical guidelines exist on how to do fulfil this suggestion.Reference Galvin, Ezzell, Eisbrauch, Yu, Butler, Xiao, Rosen, Rosenman, Sharpe, Xing, Xia, Lomax, Low and Palta11 The aim of this work is to present differences that can occur in IMRT software of a commercial treatment planning system following upgrades and how these can be characterised using a series of prostate plans.
METHODS
Planning technique
All treatment planning was performed on a single PC (HP dc7600–Geforce 7900GTX dual 3.20 GHz Intel Pentium (R) 4 processor and 3 GB of RAM) using the Oncentra Masterplan (OMP) treatment planning system (Nucletron BV, Veenendal, the Netherlands). The calculation dose-grid size was 2.5 mm and the pencil beam dose calculation algorithm was used throughout. Treatment plans were designed for delivery on a Varian 2100CD linear accelerator equipped with 120-leaf millennium MLC (Varian Medical Systems, Palo Alto, CA) using 6 MV photons delivered using the step and shoot method with a dose rate of 400 MU/min. A plan ‘class solution’ was used, which consisted of beams delivered with gantry angles: 180°, 100°, 35°, 325°, and 260° and objectives for all relevant structures.
Optimisation and dose calculation algorithms
The OMP optimisation module utilises a Sequential Quadratic Programming (SQP) algorithm. During IMRT optimisation, the dose distribution per fluence element (bixel) is required. A ‘beamlet’ describes the relation of fluence in a bixel to dose in voxels. Initially beamlets are generated for the plan. During ‘optimisation’, bixels/fluences are optimised to ensure the dose per voxel is appropriate through minimisation of the objective function or if the maximum number of iterations is reached without the objective function being met. ‘Segmentation’ reconstructs each individual fluence distribution for each beam as closely as possible by determining the MLC segments. A ‘final dose calculation’ performs the fluence calculation with full head scatter conditions. Dose calculations are performed at each stage to allow the user to observe dose distributions and DVHs at any point in order to monitor the progress of the optimisation.
The user is given the option of starting the optimisation from where it previously finished (after an optimisation, segmentation or final dose calculation) or the ‘Reset’ button can be used to start the optimisation from the very beginning. The user manual gives no clear explanation as to the purpose of this button or any indication of when to use it during optimisation.
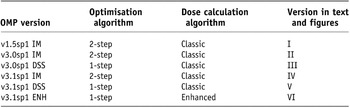
The versions of OMP investigated in this work are summarised in Table 1. For simplification each version number, optimisation type and algorithm will be numbered version I–VI as described in Table 1. In clinical use in the Northern Ireland Cancer Centre, this treatment planning system has gone through a number of system upgrades, from version I to version VI. An initial upgrade from version I to version II was considered to be a general upgrade. Both versions utilised the two-step optimisation algorithm, also referred to in Table 1 as IM. During this general upgrade an improved Monte Carlo MLC segment sorting was implemented. Within further releases studied, a one-step (DAO) option became available clinically (version III), commercially known as the ‘direct step and shoot’ (DSS) method (one-step and DSS are used interchangeably in this paper).
Versions of Oncentra MasterPlan studied
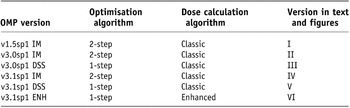
Another general upgrade to versions IV and V utilised the two-step and one-step optimisations, respectively. Version VI was equivalent to version V but with a new enhanced dose calculation algorithm. Faster calculation times were expected in the enhanced over the classic dose calculation algorithm due to a number of factors which are mainly derived from more explicit modelling of the treatment head. For the classic dose calculation algorithm the individual head scatter dose fractions for each collimated beam are summed to determine the total dose. This is in contrary to the enhanced dose calculation algorithm where the multi-segment fields are calculated by first adding the energy fluence distributions from the individual segments and then performing one dose calculation using the combined energy fluence. This combined with an improved discrete Fourier transform convolution technique has improved the dose calculation efficiency.Reference Ahnesjo12
Inter-patient variation
Clinically acceptable IMRT prostate plans were initially created for six computed tomography (CT) datasets using version I employing a two-step optimisation method (fluence optimisation followed by beam segmentation). IMRT plans were subsequently recalculated for each of the six patients using each version of OMP listed in Table 1.
All subsequent plans for each patient used the same dose–volume objectives and constraints that were determined for version I plans. The following times were recorded: the beamlet generation time, optimisation and segmentation time (recorded as one to allow comparison between the one- and two-step optimisation methods) and the final (accurate) dose calculation time. For each plan the total number of MUs and segments were also recorded. To assess the differences in the calculated dose distribution following optimisation, segmentation and final dose calculation (when the two-step optimisation was employed), the dose to 99% (D99%) and 50% (D50%) of planning target volume (PTV) was recorded from the DVHs following each of these three stages. Each plan was also assessed in terms of clinical acceptability. Statistical differences between versions were assessed using a paired Student’s t-test with the level of significance set at p = 0.05 on Statistical Package for Social Sciences, version 15.0.1.1 (SPSS, Chicago, IL).
OMP repeatability
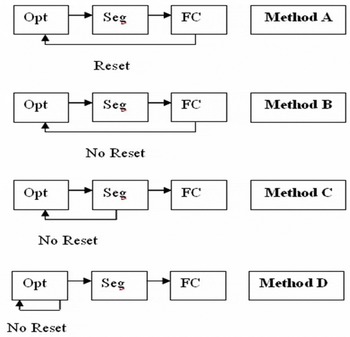
A single patient dataset was used for repeatability characterisation. A series of re-optimisations was performed over a number of iterations using the reset function in different ways. This was performed for versions I, IV, V and VI. Figure 1 outlines the four different methods (different uses of the reset function) that were studied for repeatability.
Illustration of methodology of testing repeatability.

For method A the plan was optimised, segmented and the final dose calculated with a reset after each iteration (in this paper each iteration is a re-optimisation performed by the user). This was repeated a further five times resulting in six iterations for each OMP version. In method B the plan was optimised, segmented and a final dose calculation carried out, with no reset, for nine iterations with each version. Method C involved optimising and segmenting the plan with no reset, for N iterations, before one final dose calculation. For method D, the plan was re-optimised N times for two-step plans before performing one segmentation and one final dose calculation (where N = 1, 2, 3, 4, 5, 10 and 15).
Trends in MUs, segments, differences between optimisation and segmentation, and differences between segmentation and final dose calculation were recorded over iterations. Variation in the number of iterations used in methods A, B, C and D was based on the emergence of a trend using that methodology.
RESULTS AND DISCUSSION
Inter-patient variation
All plans created on version I were clinically acceptable as each plan was originally created using this version. One patient failed to meet the dose–volume tolerances using the two-step optimisation on versions II and IV. This patient was challenging to plan as a large volume of the PTV overlapped with the rectum and bladder. A different patient plan, while fulfilling dose–volume tolerances, lacked coverage of the PTV when planned using versions II and IV and was therefore not clinically acceptable. This inadequate coverage was due to competing target and critical structure constraints in overlap regions. The plans created using versions III, V or VI were deemed acceptable for all patients thus demonstrating improved robustness of the one-step optimisation method over the two-step method.
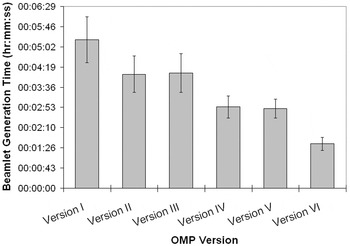
Figure 2 shows the average beamlet generation time for each version of OMP. Beamlet generation is inherent in the IMRT planning process and commences automatically upon initialisation of the optimiser module. Significant reductions in time were observed after upgrading from version I to II (p < 0.001), from version II to IV (p < 0. 001) and from version III to V (p < 0. 001). Further time reductions were observed when using the enhanced algorithm rather than the classic dose calculation algorithm (p < 0.001). No time difference was evident between using the one-step or two-step optimisation method.
Beamlet generation time (average (±SD)) averaged over six patients for each software version.

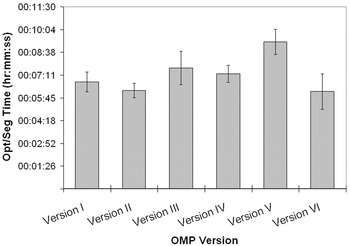
Figure 3 shows the variation in optimisation and segmentation time between software versions. Although the DSS is a one-step type optimisation method, it actually takes longer than the two-step optimisation method to optimise and segment the plans. However, the enhanced dose calculation algorithm (which utilises the DSS one-step optimisation method) reduces the optimisation and segmentation time back to the level of the two-step optimisation method.
Combined optimisation and segmentation time (average (±SD)) averaged over six patients for each OMP version.

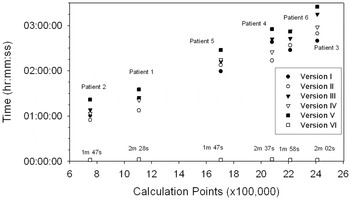
Figure 4 shows final dose calculation times for each patient planned with each software version as a function of the number of calculation points. The calculation points were derived from CT slice thickness and the dose grid size (i.e., the longer, wider and deeper the patient volume, the larger the number of calculation points). The final dose calculation time is shown to be proportional to the number of calculation points for the classic dose calculation algorithm (R Reference Seco, Clark, Evans and Webb2 > 0.971 for all versions). A dramatic reduction in the final dose calculation time from hours to minutes was observed when the enhanced dose calculation algorithm was introduced in place of the classic dose calculation algorithm. No correlation was found between the final calculation time and calculation points (R Reference Seco, Clark, Evans and Webb2 = 0.019), segments or MU for the enhanced dose calculation algorithm. This is similar to the findings using the Pinnacle treatment planning systemReference Jones and Williams8 (Philips Radiation Oncology Systems, Milpitas, CA). The improvements in the enhanced over the classic dose calculation algorithm are due to a number of factors which are mainly derived from more explicit modelling of the treatment. The fact that the classic dose calculation algorithm is a point based algorithm explains why the calculation time is directly proportional to the number of calculation points unlike the enhanced dose calculation algorithm which is fluence based.
Final dose calculation time dependence on volume.

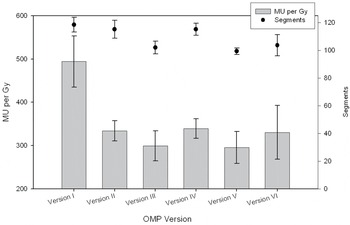
Figure 5 shows the average number of MUs/Gy (prescribed to the target) for the six patient plans for each version of OMP. The improvement in MU efficiency of version II and version IV compared to version I was 32%. The reason for this is most likely due to the improved Monte Carlo segment sorting method during the interpretation stage of planning. A further 12% reduction in MUs was observed when the one-step rather than two-step optimisation method was employed. The reduction is less than that observed using version I where a 1.4-fold increase in MUs for IM compared to DSS was found.Reference Dobler, Pohl, Bogner and Koelbl3 This is likely to be related to differences in software versions studied as results presented here are based on versions II and III (IM and DSS) and versions IV–VI (IM, DSS and ENH). Figure 5 shows that IMRT using the enhanced dose calculation algorithm generates ∼12% more MUs compared to the classic dose calculation algorithm. A reduction in segments (∼13) was observed between the one-step and two-step optimisation that was not seen in previous work with version I.Reference Dobler, Pohl, Bogner and Koelbl3 Reduction in MUs and segments results in reduced treatment times, excluding patient set-up and verification.Reference Kuperman, Ventura and Sommerfeldt13 Another benefit of this is that there will be less head scatter and MLC leakage and therefore less low dose photons delivered to the patient.
Monitor units per Gray to PTV and number of segments ((average (±SD)) for different OMP versions.

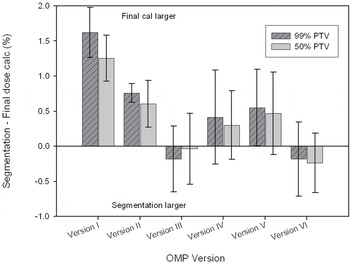
Figure 6 shows that the difference between PTV doses following segmentation compared to those after the final dose calculation were >1.5% for version I. The dose differences were <0.7% for all other software versions however the DSS versions generally showed smaller differences compared to IM versions. It has been shown that if delivery effects are not accounted for in the optimisation stage of planning, then an increase in delivered dose to the volumes of interest may occur following leaf sequencing.Reference Seco, Clark, Evans and Webb2 This is likely to be the cause of differences identified here. The importance of these unpredictable dose differences cannot be underestimated. It is difficult to account for them by modification of dose objectives and re-optimisation and because they are not within the control of the planner, further time is added to an already time consuming process of arriving at a desired solution. Therefore, if the dose differences between optimisation and final dose calculation are large, it is likely that treatment planning will take a significantly longer time.
Difference in dose (average (±SD)) to 99% and 50% of the PTV between segmentation and final dose calculation averaged over six patients for each software version.

Repeatability measurements
A plan was recalculated a number of times with resets after a complete calculation involving one optimisation, one segmentation and one final dose calculation (‘method A’ in Figure 1). This was carried out for each of the six versions listed in Table 1. The MUs and segments were identical between iterations within each software version when the reset function was used in this way. Calculation times and PTV doses at each stage of the optimisation process were also consistent.
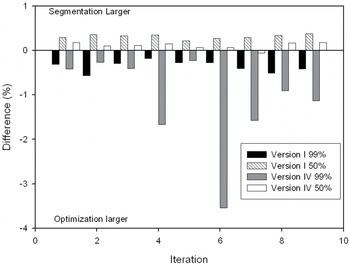
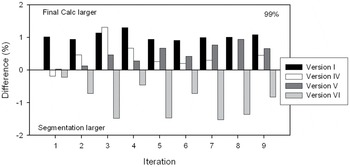
Figure 7 shows how the dose difference between optimisation and segmentation can change over a number of iterations if the reset function is not used before the subsequent optimisation (method B), i.e., the starting point for the re-optimisation is the most recently optimised, segmented and calculated plan. This analysis, comparing segmentation to optimisation, was carried out for IM versions only as DSS combines both of these steps into one step. OMP version I and version IV both exhibited a ‘smearing’ of the dose-volume after segmentation, whereby the dose to 99% of the PTV (D99%) decreased and the dose to 50% of the PTV (D50%) increased compared to these values following the optimisation step. Version IV was much more susceptible to smearing than version I with differences for D99% approaching 4%. The increased susceptibility of this version of the software to smearing of the PTV dose-volume was also found when the method D approach was tested. This test clearly shows the negative affect on planning efficiency if the reset function is not used prior to each new optimisation iteration for version IV.
Dose differences between optimisation and segmentation to 50% and 99% of the PTV taken from the dose volume histogram for repeatability method B (i.e., Difference = (Segmentation – Optimisation)/Optimisation) × 100).

Figure 8 shows how the dose difference between final dose calculation and segmentation varies over a number of iterations if the reset function is not used before the subsequent optimisation (method B). For version I, the dose to the PTV (both D99% and D50%) following the final dose calculation was ∼1% larger than that after segmentation, over all iterations studied. For versions IV–VI (IM, DSS and ENH) versions, the differences were minimal on the first iteration but larger variations were observed on subsequent iterations. Unlike other versions the segmentation dose was larger than the final dose calculation for version VI. Similar trends were observed for iteration methods C and D as expected. These differences would not occur if the reset function was used appropriately (i.e., used prior to each new iteration) and therefore again highlights its usefulness when minimal variations during planning are required.
Differences between dose following segmentation and dose following a final dose calculation to (a) 50% of the PTV taken from the dose volume histogram using Method B.

For version I, it is clear that resetting the optimisation after a calculation has completed, before commencing the subsequent optimisation, has no effect. This is in contrast to versions IV–VI (IM, DSS and ENH) where changes following the first iteration are much more variable if the optimiser is not reset before each new iteration. This is an important conclusion in that it prompts the treatment planner to reset the optimiser each time a re-optimisation is performed on versions IV–VI (IM, DSS and ENH) which was not required for version I. The variations between planning system versions shown here reinforces the importance of understanding the unique features and limitations of each new software version.
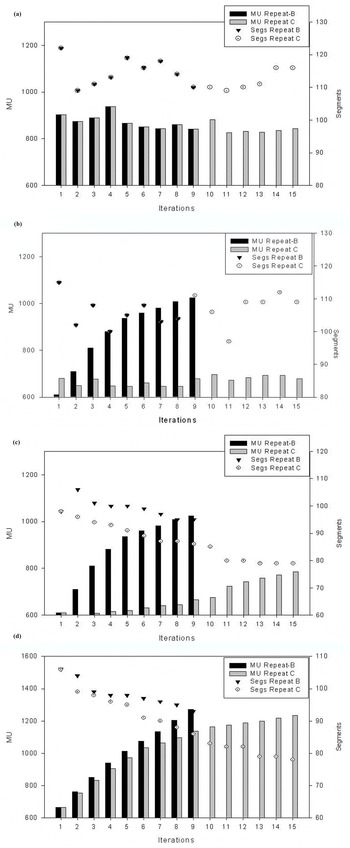
Figure 9 shows how the delivery characteristics change depending on the method of re-optimisation used for each software version. In Figure 9a, it is clear that both MU and segments remained constant for version I for both optimisation methods B and C. Figure 9b shows that version IV generated a similar number of segments over iterations using either method. There was a minimal change in MU when the optimisation was restarted directly following an optimisation/segmentation (method C) but an increase in MU was observed when the entire optimisation process was followed including the final dose calculation (method B). Figure 9c,d shows that with the one-step optimisation process, the number of segments generated decreased and the MUs increased over iterations.
Changes in delivery properties (monitor units and segments) for each version following series of re-optimisations as described in text. (a) Version I (b) version IV, (c) version V and (d) version VI.

In general, method B showed larger variation in MU over iterations than method C and this may have been due to the fact that a final dose calculation was performed between iterations. This would indicate that not only does the previous optimisation affect the subsequent optimisation/segmentation results, but so too does the execution of the final dose calculation. Although the reduced number of segments may have an effect of decreased complexity, the steeper increase in MU would more likely lead to longer delivery times.
CONCLUSIONS
Inverse planning is a complex procedure that usually involves the planner defining a class solution, followed by an iterative loop whereby changes are made to dose-volume objectives or constraints with the ultimate goal of finding a clinically acceptable dose distribution. During this process it is important to understand the limitations of the treatment planning system used. Treatment planning software for IMRT continues to evolve and improve. As a result of upgrades IMRT optimisation parameters in addition to dose delivery parameters can change. These can have a bearing on the efficiency of the treatment planning process (e.g., speed) as well as the treatment delivery process (MU and numbers of segments). The latter indications may not only affect delivery efficiency but may also modify the risks associated with the treatment technique.
We have shown that differences can exist between versions of IMRT software during an upgrade cycle. In general, these differences are considered to be positive such as improvement in the agreement between calculated and measured doses, reduction in calculation time and reduced MU. A 32% reduction in MU was observed between two versions of OMP due to general implementation differences in optimisation. A 12% reduction was observed when using a one-step optimisation rather than a two-step optimisation using a classic dose calculation algorithm. An increase in MUs was observed for an enhanced dose calculation algorithm compared to the classic dose calculation algorithm. With the introduction of the enhanced dose calculation algorithm a significant reduction in plan calculation time was observed. The overall reduction in the time required for the beamlet generation, optimisation/segmentation and the final dose calculation will ultimately improve the efficiency of the planning process that should support closer agreement between dose–volume objectives and calculated dose distribution.
Interestingly, for the software versions studied, the way in which they are used (repeatability) can have a large bearing on the output of key variables such as total numbers of beam segments and total MU. Repeatability measurements revealed that the optimisation should be reset after each iteration when using OMP versions later than v1.5sp1, so as to avoid large differences between segmentation and final dose calculation, as well as increased MUs.
It is clear from results presented here that many changes can occur between IMRT software versions during an upgrade cycle. We have presented a practical method that can be used to verify and quality-assure each new version of a commercial inverse treatment planning system. As well as providing the opportunity to develop a method to monitor changes to delivery parameters and dose calculation accuracy following upgrades, this process allowed the development of systematic approaches to using the IMRT software. This has resulted in a better understanding of the software in use and has essentially improved IMRT treatment planning efficiency. Although this work is based on one commercial inverse treatment planning system, it would be easily transferable to other commercial systems because the underlying system principles are the same.
Acknowledgements
The authors wish to acknowledge Dr Alan Hounsell and Dr Mark Grattan for comments on the manuscript, Mats Asell of Nucletron for comments on some of the data and Mark Dunn for technical assistance on certain aspects of the project. C.K. McGarry is supported by a Health & Social Care Research & Development of the Public Health Agency Training Fellowship Award.