Introduction
Salinity tolerance in plants involves multiple processes conducted by different organs and manifested through a wide range of mechanisms, including morphological, physiological and biochemical adaptations (Tester & Davenport Reference Tester and Davenport2003). One of these aspects is the capacity for osmotic adjustment, which is a physiological adaptation of salt tolerant plants achieved through the synthesis of compatible solutes, including a wide range of organic compounds (sucrose, proline, glycine betaine and others), that do not interfere with metabolic activity, even at high cytosolic concentrations. The main function of compatible solute accumulation is the re-establishment of osmotic equilibrium between the saline medium and the intracellular compartments to avoid severe cell dehydration. Secondary functions of compatible solutes include the stabilization of the quaternary protein structures in biomembranes and serving as acceptors of free radicals (Munns & Tester Reference Munns and Tester2008, Ahmad et al. Reference Ahmad, Azooz and Prasad2013).
Salt tolerance is controlled by many genes through complex regulatory networks. One of the key responses to salt stress is to maintain cellular ion homeostasis by restricting the accumulation of toxic sodium cations (Na+). A well-defined signalling pathway required for control of ion homeostasis is the Salt Overly Sensitive (SOS) signalling pathway. SOS3, SOS2 and SOS1 are the key components of the SOS signalling pathway involved in Na+ extrusion. SOS3 encodes a myristoylated calcium-binding protein that appears to function as a primary calcium sensor that perceives an increase in cytosolic calcium (Ca2+) triggered by excess Na+ that has entered the cytoplasm. Upon binding with Ca2+, SOS3 is able to interact with and activate the serine/threonine protein kinase SOS2, which belongs to the SnRK3 family of protein kinases (sucrose non-fermenting-1-related protein kinase-3). SOS3–SOS2 interactions recruit SOS2 to the plasma membrane leading to activation of the downstream target SOS1, an Na+/H+ antiporter. This causes subsequent extrusion of excess Na+ from the cytosol. SOS1 is involved in exporting Na+ from the cytosol to the extracellular space to reduce the accumulation of Na+ in the cytoplasm (Zhu Reference Zhu2002), controlling the load of Na+ in the xylem and long-distance Na+ transport (Shi et al. Reference Shi, Quintero, Pardo and Zhu2002). When exposed to high NaCl levels, SOS1 gene expression is significantly up-regulated in the roots and, to a lesser extent, in the stems of seedlings (Shi et al. Reference Shi, Ishitani, Kim and Zhu2000). Other studies suggest a role in the direct extrusion of sodium into the environment through the epidermis of the roots, where cells lack large vacuoles (Hauser & Horie Reference Hauser and Horie2010).
Deschampsia antarctica Desv. (Poaceae) is one of two species of vascular plants that inhabit the Antarctic region. This plant is exposed to the harsh conditions of the Maritime Antarctic climate, such as extreme low temperatures, water deficit and high salinity (Alberdi et al. Reference Alberdi, Bravo, Gutiérrez, Gidekel and Corcuera2002). Physiological, biochemical and molecular studies have been carried out with the aim of understanding the adaptive mechanisms that allow this species to colonize and flourish in such an environment (Gidekel et al. Reference Gidekel, Destefano-Beltran, Garcia, Mujica, Leal, Cuba, Fuentes, Bravo, Corcuera, Alberdi, Concha and Gutiérrez2003, Pérez-Torres et al. Reference Pérez-Torres, Garcia, Dinamarca, Alberdi, Gutiérrez, Gidekel, Ivanov, Hüner, Corcuera and Bravo2004, Gielwanowska et al. Reference Gielwanowska, Szczuka, Bednara and Gorecki2005). Deschampsia antarctica plants subjected to low temperature, salt stress, osmotic stress and exogenous abscisic acid (ABA) produce increased levels of different dehydrins, primarily localized in vascular and epidermal tissues, or areas normally associated with ice nucleation. This suggests that the survival of this plant in the Antarctic could be due to the presence and accumulation of dehydrins in the leaves (Olave-Concha et al. Reference Olave-Concha, Bravo, Ruiz-Lara and Corcuera2005). Moreover, D. antarctica produces and accumulates apoplastic antifreeze proteins as a tolerance mechanism against freezing (Bravo & Griffith Reference Bravo and Griffith2005). This plant also accumulates high levels of sucrose, proline and fructans. Together these biochemical cryoprotectants may play a significant role in enabling plants to survive in Antarctic conditions (Bravo et al. Reference Bravo, Ulloa, Zuñiga, Casanova, Corcuera and Alberdi2001).
Deschampsia antarctica often grows close to the sea where it is often covered by waves during high winds or exposed to large amounts of sea spray (Beyer et al. Reference Beyer, Bölter and Seppelt2000, Alberdi et al. Reference Alberdi, Bravo, Gutiérrez, Gidekel and Corcuera2002). Gielwanowska et al. (Reference Gielwanowska, Szczuka, Bednara and Gorecki2005) observed that D. antarctica plants growing in different saline microhabitats presented marked differences in the anatomical and ultrastructural features of the leaves. Ruhland & Krna (Reference Ruhland and Krna2010) examined the effects of salinity and temperature on physiological parameters of D. antarctica and observed that there were few significant effects of salinity on the measured growth parameters and concentrations of free proline were greater with increasing salinity and temperature in D. antarctica. Olave-Concha et al. (Reference Olave-Concha, Bravo, Ruiz-Lara and Corcuera2005) observed that the maximum photochemical efficiency of photosystem II (PSII), measured as variable chlorophyll fluorescence, and maximum fluorescence ratio (Fv/Fm) did not exhibit statistically significant differences in plants exposed to NaCl concentrations ranging from 0.25–1.0 M NaCl. In previous studies conducted in our laboratory, we have observed that plants under high salinity exhibit exudation of salt crystals on the surfaces of their leaves (Fig. S1 found at http://dx.doi.org/10.1017/S0954102016000249). Therefore, D. antarctica could be considered a salt tolerant species and an excellent model for elucidating the regulating mechanisms behind plant salt tolerance. We postulate that D. antarctica is a salinity tolerant species that allows Na+ ions to diffuse into the roots where an SOS system extrudes Na+ from root cells and facilitates its movement through the xylem to the leaves. In the leaves, D. antarctica has morphological adaptations that contribute to exudation of excess salt. In this work, the leaf epidermis, physiological parameters and genes involved in sodium transport (SOS1, SOS2 and SOS3) were evaluated in D. antarctica plants exposed to 0.5 M and 1.0 M NaCl for 21 days.
Materials and methods
Plant samples, growth conditions and salt treatments
Deschampsia antarctica plants were collected during the summer in 2011 and 2013, near Collins Harbour on the south beach of Fildes Peninsula on King George Island, South Shetland Islands (62°10'05.6''S, 58°51'06.2''W). Whole plants were transported to the Laboratory of Plant Physiology and Molecular Biology at Universidad de La Frontera, where they were propagated in vitro as described by Cuba et al. (Reference Cuba, Gutiérrez-Moraga, Butendieck and Gidekel2005). Fresh leaves from D. antarctica were also collected from plants growing under natural conditions where the plants had been exposed to sea spray. Leaves were fixed in 2.5% glutaraldehyde (v/v) and the samples were stored at 4°C until analysis.
Rooted plants were taken from their respective in vitro propagation growth media (Agar plus MS). They were washed with distilled water to remove agar from the roots and transferred to pots with vermiculite for salt treatments. Plants were maintained at 13±2°C in a growth chamber with white florescent light tubes (36 W/33 Philips bulbs, irradiation at 80 µmol m-2 s-1), and 16 h/8 h light/dark periods. The plants were fertilized twice a week with Phostrogen (Solaris, Buckingham) 0.12 g l-1 dissolved in distilled water used as an irrigation solution. After two weeks of acclimatization in these conditions, NaCl was added to the irrigation solution to reach two final NaCl concentrations (0.5 and 1.0 M). Control plants were irrigated with Phostrogen without NaCl. For all experiments, groups of plants were harvested at three points (7, 14 and 21 days).
Differences between new and old leaves were assessed to identify possible differential expression of SOS genes. Central and folded leaves of the plant were considered new leaves, and full expanded leaves located at the plant base were considered old leaves (see Fig. S2 found at http://dx.doi.org/10.1017/S0954102016000249).
Scanning electron microscopy
The epidermis of full expanded leaves from the control, 0.5 M and 1.0 M NaCl groups were observed at 21 days. Leaf pieces of 3 cm in length were evaluated. These samples were fixed in 2.5% glutaraldehyde (v/v) and sent to the Advanced Microscopy Unit, Faculty of Biological Sciences, Pontificia Universidad Católica de Chile in Santiago City for dehydration using an increasing ethanol series and an acetone series before critical-point drying with CO2 (Sorvall Critical-Point Drying System, Newtown, CT). Subsequently, samples were covered with 99.99% gold/palladium (60:40 Au:Pd ratio) (Pelco, Watford) in a Sputter Pelco 9100 (Polaron Equipment, Watford). Finally, samples were mounted on 1.5 cm diameter scanning electron microscope (SEM) stubs and observed through an SEM (Hitachi Analytical TableTop Microscope TM3000). Trichome density on adaxial and abaxial surfaces were counted per square millimetre (n=5), and length was measured in μm.
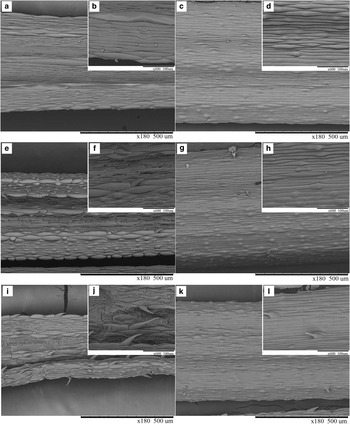
Scanning electronic microscopy of Deschampsia antarctica epidermis. a. & b. Adaxial and c. & d. abaxial epidermis of the control plants, e. & f. adaxial and g. & h. abaxial epidermis of the 0.5 M NaCl treated plants, i. & j. adaxial and k. & l. abaxial epidermis of the 1.0 M NaCl treated plants.

Determination of total sodium accumulation in leaves and roots
Sodium content was determined in leaves and roots at 7, 14 and 21 days. Samples were rinsed three times in distilled water, and dried at 60°C for 48 h (n=5). Samples were crushed in a stainless steel crusher, calcined at 500°C for 8 h, and treated with 2 M hydrochloric acid. To quantify the amount of Na+, a simultaneous multi-element atomic absorption spectrometer (969 UNICAM Atomic Absorption Spectrometer) was used.
Proline content in leaves
Free proline was determined colorimetrically in leaves as described by Bates et al. (Reference Bates, Waldren and Teare1973). Samples of c. 0.1–0.3 g of leaves (FW) from plants selected randomly (n=5) were independently macerated and homogenized with 10 ml of 3% sulfosalicylic acid and filtered through Whatman No. 1 filter paper. After this, 2 ml of the filtered material was combined with 2 ml acid ninhydrin reagent (2% ninhydrin dissolved in glacial acetic acid), placed in a water bath for 1 h, and left to cool on ice. Subsequently, 4 ml of toluene was added and mixed strongly by a vortex. The organic phase was carefully extracted by suction with a Pasteur pipette and measured in a spectrophotometer at 520 nm. Proline concentrations for each sample were determined based on an L-Proline (Sigma-Alrich, St Louis, MO, USA) calibration curve and calculated from the dry weight (DW) as:
 $$\eqalignno{ {{\rm \rmu} \rm M}\,{\rm proline/g}\,{\rm DW}\,{\rm =}\,[ {\left( {{\rm \rmu g}\,{\rm proline/ml}\,{\rm {\times}}\,{\rm ml}\,{\rm toluene}} \right) } /\cr \qquad { {\rm 115}{\rm .5}\,{\rm \rmu g/\rmu M}} \right]{\rm /}\left[ {{\rm DW}\,{\rm t}\,{\rm sample}\,{\rm g}} \right){\rm /5]}{\rm .}$$
Proline content was expressed on a DW basis to avoid variations due to hydration status of plant tissue. To estimate DW, the average total water content for each treatment group was used (87%, 84% and 82% for the control, 0.5 M and 1.0 M groups, respectively).
Fluorescence measurements
Fluorescence signals were generated by a pulse-amplitude Fluorescence Monitoring System (FMS2, Hansatech), where the fluorescence emission of leaves was measured for each treatment. Prior to measurements, plants were dark adapted for 30 minutes in a dark room and their Kautzky response obtained via a saturating pulse (800 mS, 9000 µmol photos m-2 S-1). Fo and Fm were obtained to estimate Fv in accordance with van Kooten & Snell (Reference Van Kooten and Snel1990). All measurements were taken from five individual plants at 7, 14 and 21 days.
Total RNA extraction for quantitative reverse transcription-polymerase chain reaction
The transcriptional levels of the SOS (1, 2 and 3) genes were evaluated in new and old leaves and roots at 7, 14 and 21 days under treatment conditions (n=3). The samples were collected and pulverized in a mortar with liquid nitrogen. Total RNA extraction was performed using the RNA-Solv Purification Reagent (Omega Bio-tek, Norcross, GA) according to the manufacturer’s instructions. Each sample was treated with an RNase-free DNase (Promega, Madison, WI) and purified through columns using the EZNA Total RNA Kit I (Omega Bio-tek). Concentration and integrity were evaluated, and quantitative reverse transcription-polymerase chain reaction (qRT-PCR) was performed using the purified RNA.
For cDNA synthesis, the commercial AffinityScript qRT-PCR kit (Agilent Technologies, Cedar Creek, TX) was used following the manufacturer’s instructions. Reverse transcription was performed with 1 µg of purified RNA and an oligo dT (120 ng) and a random primer (30 ng) in a total volume of 20 µl. The mixture was incubated for 5 min at 42°C followed by an additional 5 min at 95°C. Once the cDNA were obtained, these were diluted to 1/100 for future use.
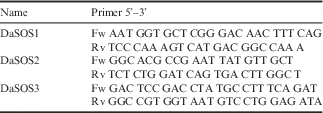
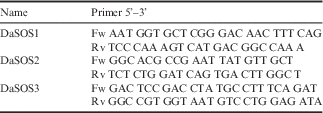
Real-time PCR was performed using 2 µl of the previously diluted cDNA, 0.5 µl of a primer mix (10 µM), 10 µl of Brilliant II SYBR Green (Agilent Technologies) and 7.5 µl of deionized water, each in a total volume of 20 µl. PCR product quantification was performed in the Stratagene Mx3000p (Agilent Technologies) using the following thermal cycles: 10 min at 95°C and 40 cycles of 15 s at 95°C, 15 s at 60°C and 15 s at 72°C. A no reverse transcription control (NRT) and a no template control (NTC) were used for each of the samples studied as controls. The reference genes used for normalization were α-tubulin and 18sRNA (Dinamarca et al. Reference Dinamarca, Sandoval-Alvarez, Gidekel and Gutiérrez-Moraga2013). Primers were designed using the sequences from the SOS family genes from D. antarctica obtained by amplification and sequencing of PCR products for conserved regions and were designed using the AmplifX 1.5.4 software (Table I).
Genes and primer pairs used in the qRT-PCR analysis.
Statistical analysis
Values reported for proline and Fv/Fm correspond to the means of five independent assays. Values reported for sodium content and gene expression correspond to the means of three independent assays. The Kruskal-Wallis test, followed by a Dunn’s post-test, was used for sodium, proline and Fv/Fm analyses. A t-test was used for the gene expression assays. Values of P<0.05 were considered statistically significant. Statistical analysis was performed using GraphPad Prism software version 5.00. All experiments were performed independently.
Results
Trichome presence in salt treated plants
The SEM analysis revealed morphological variations in the foliar surface between the treatment groups (Fig. 1). Leaves from plants in the control group had extended cells on both the adaxial and abaxial epidermises (Fig. 1a–d), and presented papillae on the abaxial epidermis and stomas preferentially on the adaxial epidermis. In contrast, leaves from plants treated with 0.5 M NaCl had an irregular surface with an increased number of papillae on the adaxial and abaxial epidermises (Fig. 1e–h). The extended cells in this group had voluminous extended cells which formed marked longitudinal ridges with the presence of some trichomes on the adaxial epidermis. The leaves from plants treated with 1.0 M of NaCl showed fewer papillae on the abaxial epidermis than the control group, extended cells on both surfaces and longitudinal ridges on the adaxial epidermis (Fig.1i–l). The extended cells in this group had less volume than those in the 0.5 M group, similar to those in the control group. This group also had a large number of trichomes on the adaxial and abaxial surfaces. Trichomes found on the leaves of NaCl treated plants were hooked, spiny, or needle-like in shape and of different lengths (Fig. 1f, j & l). Trichome density showed that only the 1.0 M NaCl treatment induced trichomes on the abaxial epidermis, where up to 9 trichomes mm-2 were observed. The trichome density on the adaxial epidermis was up to 6 and 18 trichomes mm-2 in the 0.5 and 1.0 M NaCl groups, respectively.
The presence of trichomes was evaluated in new and old leaves from plants treated with NaCl. Trichomes were only present in old leaves. Optical microscopy revealed that structural modifications of epithelial cells in NaCl treated plants resulted in the formation of trichomes. Trichomes were also found on the leaves of plants collected in situ in the Antarctic territory, but were fewer in number than on the leaves of NaCl (Fig. S3 found at http://dx.doi.org/10.1017/S0954102016000249), polyethylene glycol (PEG), cold (4°C) and ABA treated plants (Fig. S4 found at http://dx.doi.org/10.1017/S0954102016000249).
Accumulation of sodium in leaves and roots of salt treated plants
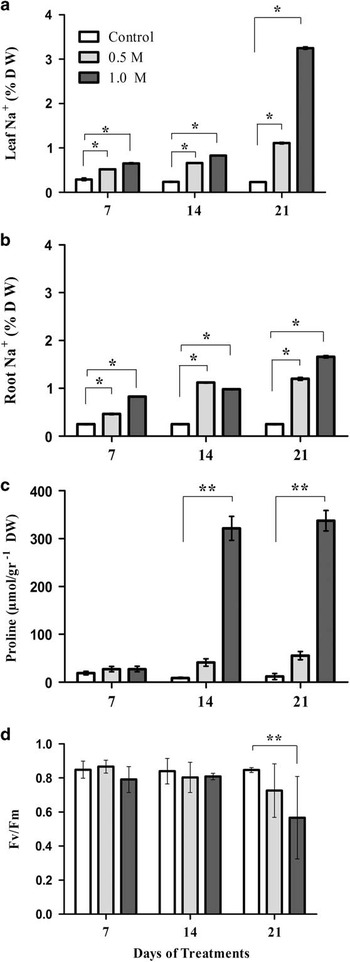
Gradual sodium accumulation was observed in D. antarctica plants treated with NaCl (P<0.05) (Fig. 2a & b). After 7 days of salt treatment, the Na+ concentration in the control group reached 0.3% on a DW basis in both leaves and roots. The Na+ concentration in leaves and roots was 0.5% and 0.4%, respectively, in plants in the 0.5 M NaCl group, and 0.6% and 0.8%, respectively, in the 1.0 M NaCl group.
Physiological parameters evaluated in Deschampsia antarctica. Effects of different concentrations of NaCl on a. Na+ accumulation in leaves, b. Na+ accumulation in roots, and c. free proline in leaves. d. Photochemical maximal efficiency of photosystem II (Fv/Fm). Vertical lines represent standard deviation. *P<0.05, **P<0.001. n=5. Between-group comparisons were only made at the same time point. DW: dry weight.

At 14 days, the Na+ concentration in the control group reached 0.2% in both leaves and roots. The Na+ concentration in leaves and roots was 0.6% and 1.1%, respectively, in plants in the 0.5 M NaCl group, and 0.8% and 0.9%, respectively, in the 1.0 M NaCl group.
Finally, at 21 days, the Na+ concentration in the control group was maintained at 0.2% in both leaves and roots. The Na+ concentration was 1.1% in both the leaves and roots of plants in the 0.5 M NaCl group, and 3.2% and 1.6%, respectively, in the 1.0 M NaCl group.
Proline content in the leaves of salt treated plants
Proline accumulated in the leaves of D. antarctica treated with NaCl (Fig. 2c). No significant differences in proline accumulation were observed at 7 days. However, at 14 days, a significant increase (P<0.01) was observed in plants under 1.0 M NaCl conditions, corresponding to an average level 36 times the level in control plants. Similarly, at 21 days, proline levels in plants treated with 1.0 M NaCl were 28 times the levels found in control plants. No significant differences in proline accumulation were observed in plants treated with 0.5 M NaCl relative to controls.
Fluorescence measurements
The effects of salt stress on the physiological state of the photosynthetic apparatus of plants exposed to different NaCl concentrations was studied measuring the maximum photochemical efficiency of PSII, using the variable chlorophyll fluorescence and the maximum fluorescence ratio (Fv/Fm) (Fig. 2d). Fv/Fm was only affected at 21 days of plant exposure to 1.0 M NaCl (P=0.0118), where Fv/Fm was 0.56 in plants treated with 1.0 M NaCl compared to 0.84 in control plants. There was no significant change in Fv/Fm in the 0.5 M NaCl treated plants at any time point.
Differential expression of SOS genes in tissues of salt treated versus control plants
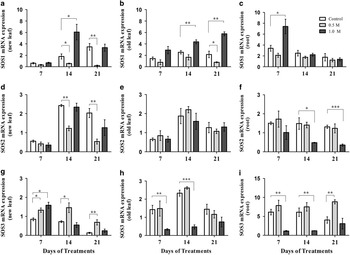
In new leaves (Fig. 3a), no differences in SOS1 expression were found between treatments at 7 days. SOS1 expression significantly decreased in plants treated with 0.5 M NaCl (P<0.05) and increased with 1.0 M NaCl (P<0.05; 2.3-fold increase compared to the control group) at 14 days. A significant decrease was observed (P<0.01) with 0.5 M NaCl at 21 days. In old leaves (Fig. 3b), a decrease (P<0.05) was observed at 0.5 M NaCl at 21 days. These older organs showed a sustained increase (P<0.01) in SOS1 expression with 1.0 M NaCl exposure over time (Fig. 3b). In roots (Fig. 3c), SOS1 expression was significantly increased in plants treated with 1.0 M NaCl at 7 days, with an increased expression of 1.1 times the control group. Plants treated with 0.5M NaCl did not show significant changes in the SOS1 expression relative to the control plants.
Effects of different concentrations of NaCl on SOS gene expression in Deschampsia antarctica. a., b. & c. SOS1, d., e. & f. SOS, g., h. & i. SOS3. Left-to-right: new leaves, old leaves and roots. Vertical lines represent standard deviation. *P<0.05, **P<0.001, ***P<0.0001. n=3. Between-group comparisons were only made at the same time point.

In new leaves (Fig. 3d), no differences in SOS2 expression were found between treatments at 7 days. However, a significant decrease (P<0.01) was observed with 0.5 M NaCl at 14 and 21 days. In old leaves (Fig. 3e), no differences were found between treatments. In roots (Fig. 3f), no differences were found between treatments at 7 days; however, a significant decrease was observed with 1.0 M NaCl at 14 (P<0.05) and 21 (P<0.001) days.
SOS3 expression significantly increased almost linearly with salinity in new leaves after 7 days of exposure (Fig. 3g). Higher SOS3 expression levels were sustained at 14 and 21 days with 0.5M NaCl; however, no differences were found with 1.0 M NaCl at 14 and 21 days. In old leaves (Fig. 3h), a significant decrease in SOS3 expression was observed with 1.0 M NaCl at 7 and 14 days. No significant differences were found between salt treatments in these older organs at 21 days. In roots (Fig. 3i), a significant decrease in SOS3 expression was observed with 1.0 M NaCl at 7 and 14 days (P=0.01). An increase in SOS3 expression was observed for 0.5 M NaCl (P=0.01) at 21 days. The SOS3 expression in roots was substantially higher than in leaves.
Discussion
The Antarctic continent is one of the most extreme habitats on the planet, and plant growth is therefore limited. However, there are two vascular plants that can tolerate and survive the conditions in the Maritime Antarctic, Colobanthus quitensis (Kunth) Bartl. (Caryophyllaceae) and D. antarctica (Poaceae). Deschampsia antarctica has been described as a species with high phenotypic plasticity associated with several morphological and biochemical features that change according to the plant’s growing conditions (Romero et al. Reference Romero, Casanova, Iturra, Reyes, Montenegro and Alberdi1999, Gielwanowska et al. Reference Gielwanowska, Szczuka, Bednara and Gorecki2005). It has been suggested that anatomical and ultrastructural characteristics of the leaf and changes which occur under stress are adaptations to the climatic conditions present in the Maritime Antarctic (Gielwanowska et al. Reference Gielwanowska, Szczuka, Bednara and Gorecki2005). Despite several studies of D. antarctica anatomy and morphology, the presence and formation of leaf trichomes had not been previously described. Scanning electron microscopy has been used to study Deschampsia species, D. antarctica included, and it has been observed that trichomes and hooks are generally absent in Deschampsia species, except in D. brasiliensis (Louis-Marie) Valencia and D. berteroana (Kunth) Trin. where needle-like and hooked trichomes were described (Finot et al. Reference Finot, Baez and Matthei2006). However, in this work, we have observed trichomes in the leaves of D. antarctica plants growing in the Antarctic (Fig. S3 found at http://dx.doi.org/10.1017/S0954102016000249).
Morphological changes, including an irregular surface with an increased papillae and trichome formation, were observed in the epidermis of leaves in response to NaCl treatment (Fig. 1). Trichome density increased with NaCl concentration, especially on the adaxial surface (Fig. 1i). Trichome shape was similar to that reported in Trisetum tonduzii Hitchc., Relchela panicoides Steud. and Dielsiochloa floribunda (Pilg.) Pilg. (Finot et al. Reference Finot, Baez and Matthei2006). The adaxial epidermis of plants treated with 0.5 M NaCl (Fig. 1e) was similar to the epidermis of Odyssea paucinervis (Nees) Stapf, a Poaceae that naturally grows in the salty soils of southern Africa, which has an adaxial epidermis with grooves, longitudinal ridges, papillae and needle-like trichomes (Somaru & Naidoo 2002), all characteristics of salt tolerant plants.
Salt usually exerts osmotic and ionic effects simultaneously in plants. Trichome induction was also observed in plants exposed to other stresses that produce osmotic effects, such as cold (4°C), ABA and PEG-6000 (Fig. S4). These observations suggest that the trichomes found in D. antarctica were likely to be part of the response to osmotic stress generated by NaCl treatment and not an exclusive response to NaCl treatment. In other species, similar results have been observed under water stress. For example, Quarrie & Jones (Reference Quarrie and Jones1977) compared the effects of ABA and water stress treatments on leaf morphology in a spring wheat and they observed that, in contrast with control plants, both ABA and water stress led to a marked increases in the frequency of trichomes on both leaf surfaces. Overall trichome density increased when Madia sativa Molina plants were grown under drought conditions (Gonzáles et al. Reference Gonzáles, Negritto, Suárez and Gianoli2008). Leaf trichomes have been related to an enhanced water economy in plants. Water stress tends to modify the different types of epidermal cells including the formation of trichomes, a mechanism that has an adaptive significance for conserving water (Quarrie & Jones Reference Quarrie and Jones1977). Diverse functions have been attributed to trichomes, including the elimination of excess ions by glandular trichomes (Adams et al. Reference Adams, Nelson, Yamada, Chmara, Jensen, Bohnert and Griffiths1998, Shabala & Mackay Reference Shabala and Mackay2011). Our results suggest that trichomes found in D. antarctica could be related to the exudation of salt crystals from the leaf surfaces, observed in previous studies in our laboratory (Fig. S1). However, further studies are needed to confirm this observation.
Hyperosmolality is the primary effect of salt stress in a plant, causing water deficit and ion disequilibrium that adversely affects basic metabolic and physiological functions (Hasegawa et al. Reference Hasegawa, Bressan, Zhu and Bohnert2000, Munns & Tester Reference Munns and Tester2008). Sodium is a cytotoxin that destabilizes membranes and proteins, and negatively affects fundamental cellular and physiological processes, such as cell division and expansion, primary and secondary metabolism, and mineral nutrient homeostasis. High Na+ levels cause intracellular K+ deficiency and [K+]/[Na+] imbalance, Na+ competes with K+ uptake even through high-affinity K+ transport systems. Sodium is preferentially accumulated in vacuoles and exerts an osmotic effect in salt tolerant plants (Hasegawa et al. Reference Hasegawa, Bressan, Zhu and Bohnert2000). Sodium accumulation in leaves has been described in salt tolerant plants. We reported significant total sodium content increase in the leaves of plants treated with NaCl (Fig. 2a). Increased levels of sodium up to 4.8 times the control group were observed in the 0.5 M NaCl treatment. These NaCl levels did not appear to be toxic for D. antarctica because the plants did not exhibit any visual injury or typical symptoms of salt stress. The physiological parameters evaluated in plants treated with 0.5 M NaCl were similar to those observed in control plants (Fig. 2c & d). At 0.5 M NaCl, the maximum photochemical efficiency of PSII did not exhibit statistically significant differences from the control plants (Fig. 2d). Similar results have been obtained for the maximum photochemical efficiency of PSII in D. antarctica at this concentration of NaCl previously (Olave-Concha et al. Reference Olave-Concha, Bravo, Ruiz-Lara and Corcuera2005, Ruhland & Krna Reference Ruhland and Krna2010). This shows that D. antarctica can tolerate high NaCl concentrations.
In plants exposed to 1.0 M NaCl, an increased level of sodium in the leaves of up to 14 times the control group was observed (Fig. 2a). Assuming that these sodium values have a homogeneous distribution within the plant and based on the percentage of total water present in those plants (corresponding to 85% in the control group and 82% in plants treated with 1.0 M NaCl) (data not shown), we can calculate the Na+ concentration (leaves: 0.023 M, 0.108 M and 0.305 M Na+ in the control, 0.5 M and 1.0 M groups, respectively; roots: 0.023 M, 0.117 M and 0.157 M Na+ in the control, 0.5 M and 1.0 M groups, respectively). We propose that as sodium enters the NaCl treated plants through the roots it is transported through the xylem and accumulates preferentially in the leaves. Sodium accumulation in leaves was proportionally higher than in roots with 1.0 M NaCl treatment (Fig. 2a & b). The capacity for sodium accumulation in leaves has been proposed as one mechanism of tolerance to salinity for some plant species (Hasegawa et al. Reference Hasegawa, Bressan, Zhu and Bohnert2000, Munns & Tester Reference Munns and Tester2008). Moreover, the maximum photochemical efficiency of PSII was only affected at 21 days with 1.0 M of NaCl (Fig. 2d), indicating that high salinity levels affect photochemical efficiency. However, the value obtained (Fv/Fm=0.56) does not indicate severe damage to PSII. Our results are consistent with the robustness of the photosynthetic apparatus that has been reported in D. antarctica (Pérez-Torres et al. Reference Pérez-Torres, Garcia, Dinamarca, Alberdi, Gutiérrez, Gidekel, Ivanov, Hüner, Corcuera and Bravo2004). Based on our observations, we consider D. antarctica as a salt tolerant plant.
High salt concentrations decrease the osmotic potential of a soil solution. Therefore, in order for plants to obtain water from this environment and to prevent water stress, the plants require osmotic adjustment mechanisms. Plants adjust their water potential as a response to osmotic stress by reducing cellular osmotic potential. Accumulation of high concentrations of Na+ salts in the vacuole must be accompanied by osmotic adjustment in the cytosol, otherwise the cytosol will be dehydrated by water flow into the vacuole. Osmotic adjustment is achieved by the accumulation of compatible solutes, such as glycine, betaine and proline, in the cytoplasm (Tester & Davenport Reference Tester and Davenport2003, Munns & Tester Reference Munns and Tester2008). Proline accumulation is one mechanism of adaptation to abiotic stresses in plants and is involved in various protective functions during stress tolerance, such as osmoprotection, redox balance and signalling (Munns & Tester Reference Munns and Tester2008). We observed that proline content in D. antarctica increased up to 36-fold in plants subjected to 1.0 M NaCl relative to the control plants (Fig 2c). It seems unlikely to be a coincidence that the increased proline levels were observed in plants with high levels of Na+ accumulation in the leaves and a low Fv/Fm ratio (Fig. 2).
High levels of sucrose and proline are needed for maintenance of a high degree of stress tolerance (Bravo et al. Reference Bravo, Ulloa, Zuñiga, Casanova, Corcuera and Alberdi2001). It has been reported that D. antarctica plants exposed to low temperatures under laboratory conditions at long photoperiods accumulate polysaccharides, sucrose and proline (Bravo et al. Reference Bravo, Ulloa, Zuñiga, Casanova, Corcuera and Alberdi2001). Ruhland & Krna (Reference Ruhland and Krna2010) observed that the concentration of free proline in the leaves and roots of D. antarctica increased with increasing salinity and temperature. In this study, increases in proline were not statistically significantly different in plants exposed to 0.5 M NaCl (Fig. 2c). It is likely that either 0.5 M NaCl is not toxic to D. antarctica, or osmotic adjustment is being carried out by other osmolytes, such as sugars, which were not measured here but have been observed in previous studies (Bravo et al. Reference Bravo, Ulloa, Zuñiga, Casanova, Corcuera and Alberdi2001). Studies have indicated that proline accumulation in plants is due to both increased synthesis and decreased degradation during salt stress (Mattioni et al. Reference Mattioni, Lacerenza, Troccoli, De Leonardis and Di Fonzo1997, Ahmad et al. Reference Ahmad, Azooz and Prasad2013). We observed increased proline levels with increasing salinity. Other studies have reported increases in proline concentrations in D. antarctica in response to cold stress and changes in day length (Bravo et al. Reference Bravo, Ulloa, Zuñiga, Casanova, Corcuera and Alberdi2001), and under osmotic stress conditions (Lee et al. Reference Lee, Lee, Noh, Park, Park, Kim, Kim and Yim2014). This suggests that free proline could contribute to the osmotic adjustment of D. antarctica and hence its survival in the environmental conditions of the Antarctic region.
Sodium accumulation observed in the roots and leaves of D. antarctica (Fig. 2a & b) suggests that a sodium transporter mechanism is involved. The SOS signalling pathway plays an important role in long-distance Na+ transport from roots to shoots under saline conditions, where SOS1 antiporters control the load of Na+ in the xylem for posterior long-distance transport (Shi et al. Reference Shi, Quintero, Pardo and Zhu2002). Increased SOS1 expression has been reported in response to salt treatments in Arabidopsis and Thellungiella sp. (Oh et al. Reference Oh, Leidi, Zhang, Hwamg, Li, Quintero, Jiang, D’Urzo, Lee, Zhao, Bahk, Bressan, Yun, Pardo and Bohnert2009). Overexpression of the SOS1 gene increases salt tolerance in non-tolerant plants, and its transcription levels increase under treatment with NaCl, with greater levels reported in wild-type plants (Shi et al. Reference Shi, Lee, Wu and Zhu2003, Yang et al. Reference Yang, Chen, Zhou, Yin, Li, Xin, Hong, Zhu and Gong2009). In this study, the differential expression of SOS pathway genes were evaluated (Fig. 3). Increased SOS1 expression was observed in plants treated with 1.0 M NaCl in all tissues evaluated (Fig. 3a–c). Moreover, we observed increased Na+ levels in leaves and roots (Fig. 2a & b), suggesting that the sodium flux through the plant may be regulated by SOS1 activity. In transgenic Arabidopsis plants, SOS1 was expressed preferentially in epidermal cells at the root tip, and under mild salt stress, SOS1 mutant accumulated less Na+ than the wild-type in shoots (Shi et al. Reference Shi, Quintero, Pardo and Zhu2002). In Aeluropus lagopoides (L.), SOS1 expression was induced by salinity in both roots and shoots, and it reached the highest level in shoots (Jannesar et al. Reference Jannesar, Razavi and Saboora2014). Therefore, increased SOS1 activity as a response to salinity has been amply demonstrated in different plants.
We have observed that D. antarctica plants under saline stress exhibit exudation of salt crystals on the surface of their old leaves after several days of treatments (Fig. S1). Moreover, a sustained increase in SOS1 expression was observed in old leaves (Fig. 3b); this SOS1 activity might contribute in the exclusion of excess Na+ as salt crystals through the leaves of plants exposed to high NaCl concentrations after several days. Coincidentally, high NaCl concentrations induced trichome formation (Fig.1i) that could be directly involved in salt exudation. Sodium accumulation observed in the leaves of plants treated with NaCl (Fig. 2a) suggests that the activity of proteins that allow Na+ unloading in the xylem and accumulation in leaves. Therefore, SOS1 activity must be co-ordinated with other Na+ transporters, such as the high-affinity potassium transporter (HKT1) and vacuolar H+/Na+ antiporter (NHX1), that allow entry and compartmentalization of Na+ to the cell, respectively. A functional link between the SOS pathway, NHX1 and HKT1 has been described previously (Zhu Reference Zhu2002, Munns & Tester Reference Munns and Tester2008, Ahmad et al. Reference Ahmad, Azooz and Prasad2013).
It has been reported that the SOS2 gene is required for intracellular Na+ and K+ homeostasis, and it forms a complex with SOS3 that regulates the expression level of SOS1 (Liu et al. Reference Liu, Ishitani, Halfter, Kim and Zhu2000, Shi et al. Reference Shi, Quintero, Pardo and Zhu2002). Moreover, SOS1 may act both dependently and independently of SOS2/SOS3 regulation (Shabala & Mackay Reference Shabala and Mackay2011). Here, an increase in SOS2 gene expression was not observed, and it may be that the SOS2 protein was already present in the plant and did not require transcriptional activation. Mutations in SOS2 cause Na+ and K+ imbalance and dramatically reduce tolerance to high levels of Na+ stress (Liu et al. Reference Liu, Ishitani, Halfter, Kim and Zhu2000). It has been postulated that SOS2 might encode a regulatory protein that controls the expression and/or activities of certain K+ and Na+ transporters (Zhu et al. Reference Zhu, Liu and Xiong1998). We did not observe increased SOS2 levels in plants treated with NaCl compared to control plants (Fig. 3d–f). Expression of SOS2 in all treatment groups suggests that SOS2 is not regulated by NaCl in D. antarctica.
It is known that SOS3 plays an important role in salt tolerance by regulating the homeostasis of Na+/K+ and its preferential localization in roots, suggesting that SOS3 has a function in protecting roots and mediation of lateral root development under salt stress (Zhao et al. Reference Zhao, Wang, Zhang and Li2010). We observed significant increases in SOS3 in new leaves and roots of plants treated with NaCl (Fig. 3g & i). Its expression was substantially higher in roots, possibly indicating that the functions of SOS3 could be related to protecting these tissues. These results are consistent with studies that indicate that SOS3 mainly functions in root tissue (Quan et al. Reference Quan, Lin, Mendoza, Zhang, Cao, Yang, Shang, Chen, Pardo and Guo2007). The increased expression of SOS3 in new leaves (Fig. 3g), did not coincide with increased expression of SOS1 (Fig. 3a), but the SOS3–SOS2 complex may also regulate the activity of other transporters involved in ion homeostasis, such as the suppression of HKT1 activity (Tester & Davenport Reference Tester and Davenport2003). HKT1 inactivation in new leaves allows control of the sodium entry in these tissues, avoiding the toxic effects of Na+ in the cytosol, and protecting tissues that are not yet fully developed. Higher levels of SOS3 and SOS1 expression observed in roots (Fig. 3c & i) reduces Na+ accumulation, which is consistent with the lower Na+ levels observed in the roots of NaCl treated plants (Fig. 2b).
Based on these results, we propose the following response model: excess NaCl in the soil diffuses into the roots of D. antarctica, inducing increased SOS1 gene expression in roots. Initial SOS1 activity in roots promotes the movement of Na+ into the xylem, and its transport to the leaves. The SOS1 transport activity is, therefore, responsible for the sodium levels observed in leaves. The gradual increase in SOS1 expression in old leaves could promote the exudation of salt crystals on to the surface. Moreover, an increase in SOS3 gene expression in new leaves may be involved in their protection through suppression of HKT1, thereby reducing Na+ uptake in the cell thus avoiding accumulation of toxic Na+ levels in the cytoplasm of new leaf cells.
Finally, we conclude that, in D. antarctica, after sodium ions diffuse into the roots they are translocated to the leaves. The sodium flux into the xylem may be controlled by SOS1 gene activity, which would explain the gradual increase of sodium observed in the leaves of plants exposed to high salinity. Moreover, the osmotic effects of salt treatment cause morphological changes in the leaves, triggering the formation of trichomes that may be involved in salt exudation through the leaves under saline conditions. This could explain the appearance of salt crystals on the surface of leaves, but this assumption needs to be tested. Future research may provide us with a better understanding of the role of trichomes under saline conditions.
Acknowledgements
The authors thank Charles Guy and Pablo Dumont for their help in the translation and proofreading of the manuscript. The authors thank the electronic transmission microscopy service from Pontificia Universidad Católica de Chile. The authors also extend thanks to the reviewers. Financial support for this work was provided by the Chilean Commission for Scientific and Technological Research (CONICYT- 24121490 code), and Chilean Antarctic Institute (INACH- DG_01-13 code), doctoral fellowships and DIUFRO DI13-0048 project.
Author contributions
All authors contributed extensively to the work presented in this manuscript. D. Tapia-Valdebenito designed and executed all of the experiments, analysed the data, and wrote and edited the manuscript. L.A. Bravo supervised the study, collaborated in designing the experiments, analysing and interpreting data, and editing the manuscript. P. Arce-Johnson supervised the study and edited the manuscript. A. Gutierrez-Moraga collaborated in designing the experiments, analysing and discussing data, and editing the manuscript.
Supplemental material
Supplemental figures will be found at http://dx.doi.org/10.1017/S0954102016000249.