I. INTRODUCTION
Understanding the mechanical properties of nanoscale composite thin films has become an increasingly important topic. The potential applications of nanoscale thin films cover a broad range of fields, including fuel cells, solar technology, flexible electronics, and even biomechanics. Since all the aforementioned applications require materials with their characteristic length being at the same scale as their microstructure, the mechanical behavior of these new materials will be significantly different than their bulk counterparts. Several studies (both computational and experimental) on copper (Cu)/niobium (Nb) and Cu/nickel (Ni) multilayersReference Misra, Demkowicz, Wang and Hoagland1–Reference Misra and Hoagland7 have shown that, when the individual layer thickness approaches a few nanometers, the films exhibit yield or flow strengths in excess of 2 GPa, significantly higher than that of bulk Cu, Ni, or Nb. These multilayers are “stacked” to form structures with a fraction of millimeter’s total thickness and strengths that approach the theoretical limit. However, despite experimental evidence showing high strengths, the understanding of the underlying mechanisms responsible for this unique behavior is still limited. Better comprehension of the mechanical behavior of this class of materials and its dependence on the layer thickness is crucial in the development of enhanced and more reliable products.
Historically, size effects in polycrystalline materials have been modeled using the Hall–Petch relation where the material strength depends on the spacing of barriers to dislocation motion described by the grain size diameter or the film thickness and a material specific strengthening constant. This relation is based on the assumption that the strengthening is caused by the pileup of dislocations against the barrier and it works well for grain sizes or layer thicknesses on the order of 100 nm. Below that size, dislocation sources and pileups are less likely to exist and the Hall–Petch relation fails to predict the material strengthening. This idea of a breakdown in the Hall–Petch effect (strengthening of a material by grain refinement) has been proposed by several authors.Reference Schuh, Nieh and Yamasaki8–Reference Wang, Li, Sui and Mao12 All of them indicate that another mechanism, such as the confined slip of dislocations inside each layer,Reference Nix13, Reference Akasheh, Zbib, Hirth, Hoagland and Misra14 must be responsible for the continuous material hardening occurred at theses sizes. At these dimensions (ranging from a few tens of nanometers to a few nanometers), the restrictions imposed by the small layer thicknesses limits the motion of dislocations to two dimensions resulting to a logarithmic strength dependence on the layer thickness.Reference Freund15 However, as the layer thickness decreases further the free length of the threading dislocation decreases and the resolved shear stress required to move the dislocation increases; the confined slip theory over predicts the yield strength of the material at layer thicknesses under 5–6 nm. The reason of the over prediction is that at those sizes, the interfaces occupy a very high amount of the thin film volume (up to 20%) and, therefore, the interaction of dislocations with the interfaces and the interfacial shearing become important. In this regime, the strength no longer depends solely on the layer thickness.
Consequently, the interfacial properties become very important when dealing with thin films where the individual layer thickness is below a few nanometers. On the basis of the crystallographic structures of the adjoined layers, the interfaces can be classified into two types: coherent and incoherent. Coherent interfaces are formed when the two layers have the same crystal structure and are epitaxially oriented so that the slip vectors and planes are continuous at the interface (a typical configuration is the cube-on-cube face-centered cubic (fcc)/fcc Cu/Ni multilayer composites). In this case the two layers are constrained so that no misfit dislocations can form to relax the residual stresses due to the lattice mismatch, resulting to the development of high stresses along the interface. Coherent interfaces show very large strengths associated with the lattice and modulus mismatch between the two layers.Reference Hoagland, Mitchell, Hirth and Kung16 In incoherent interfaces, the slip systems of the two adjoined layers are not continuous because of a difference in lattice structure and/or large lattice parameter mismatch, e.g., the fcc/body-centered cubic (bcc) Cu/Nb system with Kurdjumov–Sachs (KS) orientation. Incoherent interfaces are opaque to dislocations and act to trap them, which in turn lead to the shearing of the interface.Reference Hoagland, Kurtz and Henager2 In the limit of its ability to absorb matrix dislocations, an incoherent interface will crack leading to brittle-type failure. The type of the interface is used to characterize the type of the multilayer film: coherent and incoherent multilayers. Coherent systems are more ductile, whereas incoherent are generally stronger.
A thin film system that has both types of interfaces, thus combining the advantages of coherent and incoherent systems, may be regarded as a hybrid system. The resulting material is expected to be stronger than the fcc/fcc system and more ductile than the fcc/bcc system. Some preliminary results (both experimental and computational) show the potential of composite coherent/incoherent systems for increasing the toughness of nanoscale thin films.Reference Mastorakos, Zbib and Bahr17 Within this framework, the purpose of this work is to study the effect of the layer thickness on the deformation behavior of the hybrid systems using nanoindentation and to explain the results employing molecular dynamics simulations.
II. EXPERIMENTAL PROCEDURES
Films of Cu/Ni, Cu/Nb, and Cu/Ni/Nb were deposited by sequential direct current magnetron sputtering at nominally room temperature onto thermally oxidized Si wafers. The individual layer thickness for the Cu/Ni and the Cu/Nb films was 20 nm, whereas for the trilayers thicknesses ranged from 5 to 30 nm. To study the effect of the Nb layer thickness on the overall mechanical behavior of the trilayers, another set of films was prepared with the thickness of the Cu and Ni layers maintained at 5 nm, whereas that of the Nb layer was varied between 1 and 4 nm. For all the multilayers used in this study a total film thickness of 2 μm was reached.Reference Overman, Overman, Zbib and Bahr18
The strength of all structures was evaluated using nanoindentation with a calibrated Berkovich tip. The experiments were conducted with a Hysitron Triboindenter (HYSITRON Inc., Minneapolis, MN) utilizing the partial unloading technique to evaluate the mechanical properties as a function of depth. Fifteen different depths were probed and a minimum of 36 indents were used for each film. The hardness values reported here are averages of values measured at contact depths that correspond to a depth of ∼5% of the total film thickness. At this depth the influence from both the substrate and the surface roughness on the measured properties should be minimal.
III. EXPERIMENTAL RESULTS
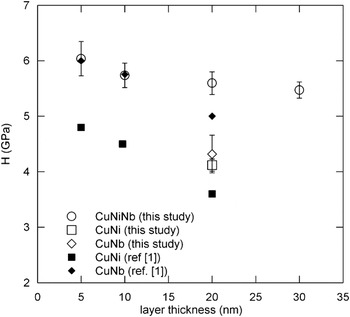
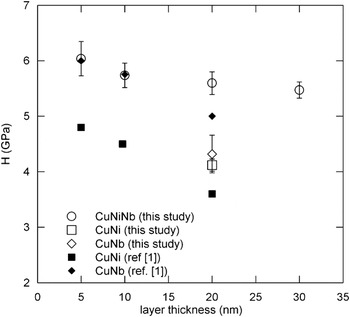
In Fig. 1 the hardness of the multilayers used in this study, as measured in the nanoindentation experiments, are presented along with reported values in literature for Cu/Ni and Cu/Nb films fabricated under the same experimental conditions.Reference Misra, Kung, Hammon, Hoagland and Nastasi5 For the larger layer thicknesses, the 20- and 30-nm layer thicknesses, the trilayer films are stronger than the Cu/Nb films. As the layer thickness decreases the hardness of the trilayer films becomes comparable to values reported in literature for the Cu/Nb multilayers. The strength of the trilayer films, which combine both coherent (Cu/Ni) and incoherent (Cu/Nb) interfaces, does not lay between the strength values reported for the strictly incoherent and coherent films with the same layer thickness as one might intuitively expect from a simple rule of mixtures. As the strengthening of the multilayers, at these length scales, originates from dislocation interactions this result points to different or additional mechanisms that operate in the case of the trilayer films improving their strength.
The hardness of the multilayers, measured in the nanoindentation experiments, as a function of the individual layer thickness. The results are compared with reported values in literature for the Cu–Ni and Cu–Nb case.
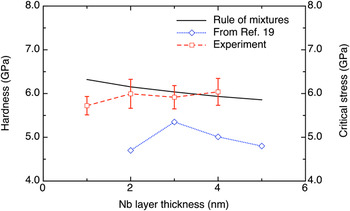
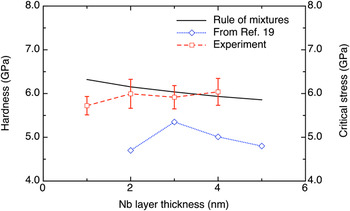
The nanoindentation data for the trilayer films, where the Cu and Ni layers are kept at 5 nm and the Nb layer thickness is varied, show that the thickness of the bcc layer used in the hybrid structure affects the observed strength. This is presented in Fig. 2 where it is shown that there is a critical Nb layer thickness below which the thin films soften. This is more or less in agreement with the results of atomistic simulationsReference Mastorakos, Abdolrahim and Zbib19 that predict the softening of the materials as the Nb layer thickness decreases to <2 nm. This behavior, which is not well-described by a simple rule of mixtures (also plotted in Fig. 2), is attributed to the role of the interfaces that govern the deformation behavior at small layer thicknesses. In particular at very small thicknesses, the whole layer behaves as an interface that shears under the application of external stress, therefore, resulting to the softening of the nanocomposite as discussed in Ref.Reference Mastorakos, Abdolrahim and Zbib19.
The experimental hardness and computational shear strength of the trilayer for the case where only the Nb layer varies as a function of the Nb layer thickness. The Cu and Ni layer thicknesses are kept constant at 5 nm. Simulation results from Ref. Reference Mastorakos, Abdolrahim and Zbib19. The hardness from the law of mixtures was calculated as  where f is the volume fraction of each material and H the hardness of the bulk material.
IV. SIMULATION SETUP AND CONFIGURATION
Molecular dynamics simulations were performed in an attempt to qualitatively explain the experimental findings. Because of the nature of molecular dynamics simulations and, in particular, the high strain rates involved during the simulations we do not expect to quantitatively match the experimental observations. However, the simulation results should follow similar trends to the experimental findings. That is enough evidence that the mechanisms observed in the atomistic simulations, and are responsible for the mechanical behavior of the materials under consideration, are similar to the ones responsible for the experimental findings. In this work the Large-scale Atomic/Molecular Massively Parallel SimulatorReference Plimpton20 was used with the Embedded Atom MethodReference Daw and Baskes21 potentials given in Refs. Reference Voter, Chen, Siegel, Weertman and Sinclair22–Reference Demkowicz and Hoagland27. Fully periodic boundary conditions were used in all cases, and the temperature of the structures was kept constant at 1 K using a Nose/Hoover temperature thermostat.Reference Melchionna, Ciccotti and Holian28 The choice of temperature was made to keep the thermal fluctuations to a minimum. The orientations of both fcc and bcc layers used were those reported in the literature for these types of systems.Reference Henager, Kuntz and Hoagland29–Reference Anderson, Bingert, Misra and Hirth31 In the coherent Cu/Ni type of layers both Cu and Ni have the same cube-on-cube orientation, with the x-axis being along the <110> direction, the y- and z-axes along the  and
 directions, respectively, and the interface being normal to the x–z-plane. For the case of the incoherent Cu/Nb type of layer, the structure is oriented in a KS crystallographic orientation corresponding to {111}Cu‖{110}Nb‖ interface plane and <110>Cu‖<111>Nb in the interface plane.
A. The formation of the coherent interface
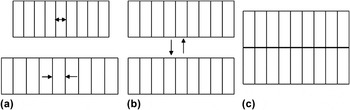
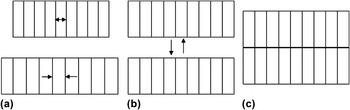
When creating a coherent interface, the coherency strains naturally develop in both layersReference Hoagland, Mitchell, Hirth and Kung16, Reference Misra, Hirth and Kung32 due to the lattice mismatch between the Cu and Ni, which must be taken into account. The coherency strains, εx = εz = 0.0122 and εy = −0.01487 for the Ni and εx = εz = −0.0144 and εy = 0.01979 for the Cu layer, are very large and result in the development of stresses of about 2.38 GPa (tensile) in the Ni and −2.38 GPa (compressive) in the Cu layer.Reference Hoagland, Mitchell, Hirth and Kung16 Another reason for the development of such high stresses is that the thickness of the individual layer is too small for misfit dislocations to form, which would relax the developed stresses. Therefore, the number of atomic columns inside both layers that form the coherent interface should be the same. To form the interface, the two layers were first formed and rotated to match the desired orientation. Then, the abovementioned coherency strains were applied in both layers to achieve registry. Finally, the two layers were brought together and the structure was relaxed. This technique is shown schematically in Fig. 3.
The stages to create the coherent interface. (a) Initially, the two layers are stretched and compressed to achieve registry. (b) The two layers, having now the same size, are brought together. (c) The coherent interface is formed by relaxing the resulted structure.
B. The formation of the incoherent interface
In the case of the incoherent fcc/bcc interface, coherency stresses do not develop in the interface and misfit dislocations are not formed. However, when periodic boundary conditions are to be used, internal stresses can develop artificially because of the misfit of the two layers. To prevent this, a minimization technique was used to find the optimum number of fcc and bcc columns that minimize the developed stresses. In a configuration where the interface is parallel to the x–z-plane (e.g., the interfacial vector is parallel to y-direction), the σy normal stress component must be zero. Using Hooke’s Law and taking into account that there are two layers, an fcc and a bcc, the following equations for the stresses hold:






where C ij (i,j=1?3) are the coefficients of the stiffness tensor and we are assuming that there are no shear stresses developed on the incoherent interface. Taking into consideration that the stresses perpendicular the interface should be zero, Eqs. (2) and (5) yield:


Additionally, the equilibrium equations should hold:


where  and
 are the thicknesses of the fcc and bcc layers, respectively, and the stresses are given by Eqs. (1), (3), (4), and (6). Finally, after the straining the two layers must have the same in-plane sizes, or


where  are the number of atomic planes in the fcc and bcc layer along the x- and z-directions and
 the lattice spacing of the fcc and bcc layers along the x- and z-directions. Equations (7) through (12) form a system of six equations with six unknown strains (εx fcc, εy fcc, εz fcc, εx bcc, εy bcc, and εz bcc), assuming that
 are given. To find the number of atomic planes in the fcc and bcc layers, a minimization technique is used. Specifically, first
 is found for a given total lengths along x- and z-dimensions. Then, keeping these lengths fixed, we obtain
 Having found the optimum number of layers, Eqs. (7) through (12) are solved to find how much each layer must be strained to achieve full registry between the two layers. These strains, which were used in the performed simulations, varied between 10−5 and 10−4.
C. The formation of the hybrid interface
The hybrid structure has both coherent and incoherent interfaces. Therefore, a combination of the two methods described above must be used. As the coherency stresses develop for the fcc interface, the formation of the hybrid started from the coherent fcc layers with the bcc layer subsequently positioned on top of the fcc. The optimization method used to form the incoherent system was used again, but now in the place of the fcc layer was the fcc/fcc system with the lattice spacing being the spacing of the coherent lattice after the application of the coherency strains (Fig. 3). By following this method the absence of large strains (and large stresses) in the bcc layer was ensured.
V. SIMULATION RESULTS AND DISCUSSION
To identify the effect of the layer thickness on the strength of the hybrid nanocomposite, five different structures were produced with thicknesses of 3, 5, 8, 10, and 12 nm for the Cu, Ni, and Nb layers. The number of atoms varied depending on the structure from 100,000 to 3,500,000. The choice of the structures was based on the experimental results shown in Fig. 1. The experimental observations exhibit a hardness that is relatively stable up to a layer thickness of 10 nm and then increases as the layer thickness decreases. Therefore, a 12-nm layer thickness structure was chosen as a representative of the structures with thicknesses at the range of 10–30 nm. Before the loading was applied, the structures were first relaxed by placing them in a thermal bath to achieve equilibrium. Upon relaxation, the structures were allowed to expand, thus slightly altering their original dimensions. The final relaxed dimensions were in all cases very close to the initial ones, except the 12-nm layer thickness Cu/Ni/Nb that expanded to 13-nm individual layer thickness on average. Then, all the structures were loaded uniaxially with a constant strain rate of 107 s−1. The loading was applied by displacing the x-side of the structures at a constant rate and allowing them to relax for 1 ps before applying the next displacement. The loading was continued until a final strain of at least 15% was achieved. This strain level is necessary to ensure that dislocations will nucleate inside the initially dislocation-free specimens and start to propagate inside all the layers.
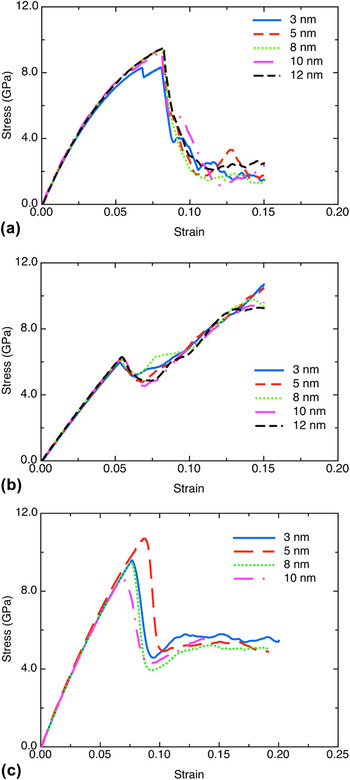
The stress–strain curves, shown in Fig. 4, reveal a pattern that is same for all types of thin films studied, i.e., initial elastic loading followed by a drop in stress when the first dislocation is nucleated and starts to propagate. However, the similarities stop here, because the coherent thin films exhibit a constant stress after the propagation of the first dislocation and the incoherent films exhibit hardening that is related to the inability of the dislocations to cross the incoherent interface. The hybrid films exhibit the same hardening behavior although less pronounced, which is related to the relatively larger space available for dislocation motion due to the two fcc layers (compared to one fcc layer in the incoherent films). These results, combined with the experimental observations, imply that dislocation nucleation should govern the observed hardness behavior and especially the softening detected below a critical individual layer thickness.
(a) Stress–strain curves for the Cu/Ni case. (b) Stress–strain curves for the Cu/Nb. (c) Stress–strain curves for the Cu/Ni/Nb case.
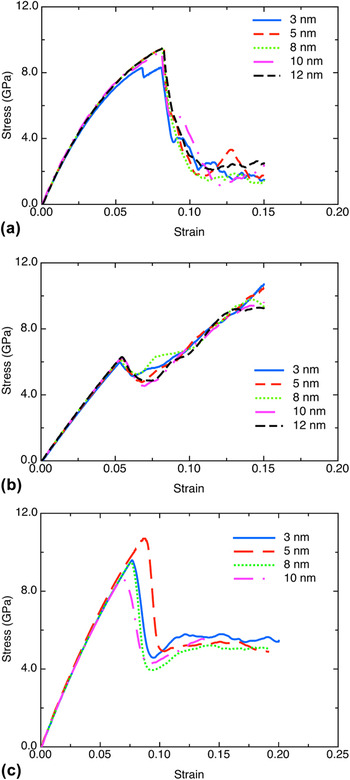
The stress–strain curves for the case of the Cu/Ni and Cu/Nb structures are shown in Figs. 4(a) and 4(b), respectively. In the Cu/Ni case, at a stress of about 4.1 GPa (where the curve loses its linearity) dislocations are nucleated and start to propagate inside the Cu layer first. Then the Ni layer follows and the dislocation density inside the material increases rapidly resulting to an abrupt drop in stress as shown in Fig. 4(a). This drop in stress is about 8 GPa and occurs at a strain of about 0.09. After that the dislocations move freely inside both layers. The initial dislocation-free specimen exhibits a rapid increase in dislocation density during the continuing loading. This is in agreement with experimental observations in nanomaterialsReference Lu, Chen, Huang and Lu33 and results to the strengthening of the material as the layer thickness increases and it will be explained in more detail below.
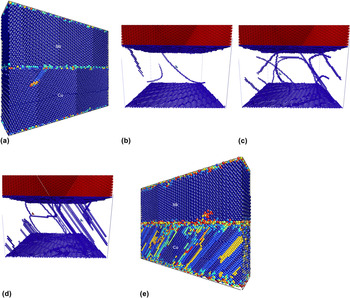
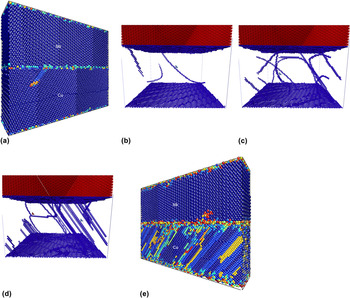
In the case of Cu/Nb, the first dislocation is produced at a stress of about 6.4 GPa again inside the Cu layer and at a strain of about 0.05 [Fig. 5(a)]. This difference in stress, which is about 2.3 GPa higher than the stress at which the first dislocation nucleated inside the Cu in the Cu/Ni case, is explained by the presence of coherency stresses inside the Cu layer in the Cu/Ni (∼2.38 GPa). The stress drop of 2 GPa is attributed to the motion of the few initially nucleated dislocations inside the Cu layer. Then, as the dislocations cannot cross the incoherent interface and are restricted to move only inside the Cu layer, as is shown in Figs. 5(c)–5(e), the material hardens. Eventually, and at stresses ranging between 8 and 12 GPa (depending on the layer thickness), dislocations start to nucleate and propagate inside the Nb layer resulting to a stress drop at the same strain of about 0.15 for all the thicknesses [Fig. 5(b)].
(a) Cu/Nb structure at a strain of 0.05. The first dislocation starts to propagate inside the Cu layer. (b) At 0.05 strain dislocations nucleate from the interface and move inside the Cu layer. (c) At a strain of 0.06 the dislocations propagate perpendicular to the interface. (d) At a strain of 0.12 dislocations move perpendicular to the interface (blue arrow) or intersect and create junctions (red arrow). The Nb layer is still dislocation free and that explains the continuing hardening of the material. (e) The structure at the strain of 0.15. Now the first dislocation is nucleated inside the Nb layer. In all cases the atoms are colored according to their central symmetry parameter.
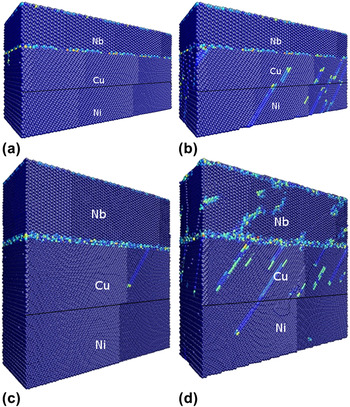
In the case of the hybrid Cu/Ni/Nb thin film, again the first dislocation is nucleated inside the Cu layer at a stress of 4.1 GPa (the same as in the Cu/Ni film). Again this is attributed to the nucleation and motion of dislocations inside the Cu layer. The dislocation density increases since now there is enough space to move due to the presence of the Ni layer under the Cu. However, the incoherent interface does not again allow the free movement of dislocations. This results in hardening that is not very pronounced because dislocations now have enough space to propagate inside the other two layers. The stress–strain curves for the Cu/Ni/Nb case are shown in Fig. 4(c).
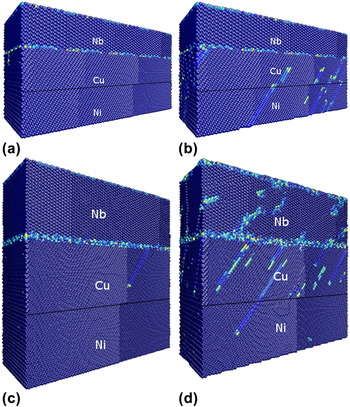
Although hardening is not so severe in this case, it is non-negligible and its rate increases as the layer thickness decreases as expected due to the decreasing available space for dislocations to move inside the fcc layers. Figure 6 shows the 5- and 10-nm Cu/Ni/Nb structures at strains of 0.075 and 0.1, right after the first dislocation is nucleated inside the copper layer.
Cu/Ni/Nb case. (a) 5-nm structure at a strain of 0.07, (b) 5-nm structure at a strain of 0.1, (c) 10-nm structure at a strain of 0.07, and (d) 10-nm structure at a strain of 0.1. The atoms are colored according to their central symmetry parameter.
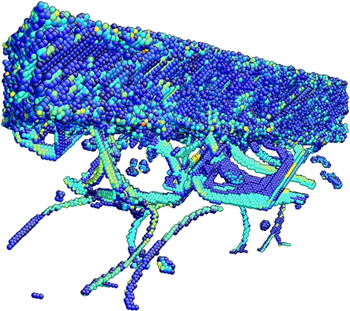
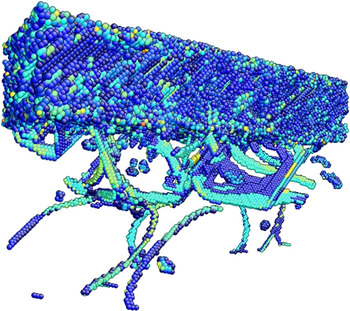
In all the three cases discussed above the initial load was subsequently removed and the structures were allowed to relax. The result was a distribution of residual dislocations inside all layers, as shown in Fig. 7. This process produces a structure closer to that found experimentally, where before the mechanical testing most nanocomposites have significant pre-existing dislocation densities.Reference Nyilas, Misra and Ungar34 Then the relaxed structures were reloaded uniaxially and the stress–strain curves were produced for all five cases.
The distribution of residual dislocations for the case of 8-nm hybrid structure. Only the atoms that based on their central symmetry parameter belong to the dislocations are shown.
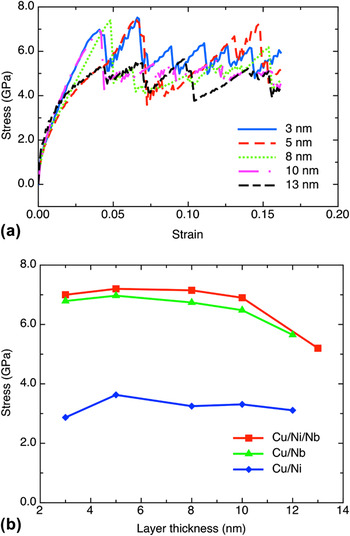
The stress–strain curves now look more like regular elastic–plastic curves with some hardening [Fig. 8(a)], typical for experimental microtensile tests of similar materials.Reference Mara, Bhattacharyya, Hoagland and Misra35 This is because now the initial structures are not dislocation free, and since the energy required for a dislocation to propagate is lower than that to nucleate the material will yield at a lower stress. The Cu/Nb exhibits a yield stress that increases as the layer thickness decreases and varies from 6.1 GPa for the layer thickness of 12 nm to 7 GPa for the layer thickness of 5 nm and drops to 6.9 GPa at 3 nm. On the other hand, the Cu/Ni shows a generally constant yield stress of 3.6 GPa that also drops to 2.9 GPa for the 3-nm multilayer. The hybrid structure displays a yield stress varying from about 5.2 GPa for the layer thickness of 13 nm to 7.2 GPa for the layer thickness of 5 nm, which is higher than that of Cu/Ni and about the same as that of Cu/Nb. Again the stress drops for the 3-nm trilayer as in the bilayers. The compiled results are shown in Fig. 8(b). As the yield stress is generally related to the hardness of the material measured by nanoidentation, this behavior is in accordance to the experimental results presented earlier.
(a) Stress–strain curves of the Cu/Ni/Nb. The straight lines correspond to the average stress for each case. (b) The plastic stress of the Cu/Ni, Cu/Nb, and Cu/Ni/Nb structures as a function of the layer thickness.
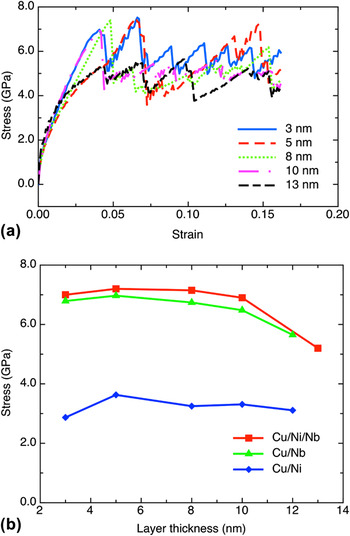
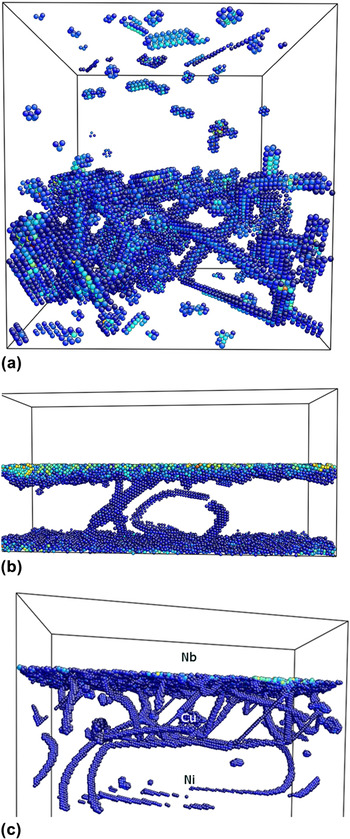
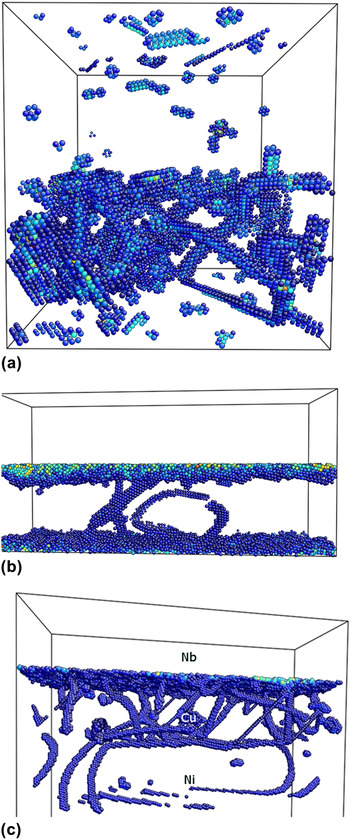
Overall, the simulations reveal that as the layer thickness decreases, the films become stronger. In all cases, this is true up to a thickness of 5 nm. Films with thinner layers (as in the case of an individual layer thickness of 3 nm) are generally softer than the film with 5-nm layer thickness. This is attributed to the extending shear of the interface in the case of incoherent filmsReference Mastorakos, Abdolrahim and Zbib19 or to the interface crossing of single dislocations for the case of coherent films because the confined layer slip stress exceeds the interfacial barrier stress.Reference Misra, Hirth and Kung32 Furthermore, and as shown in Fig. 9, where the dislocation content inside the fcc layer for all the studied structures is plotted, the dislocation density inside the Cu/Ni/Nb structure is higher than that inside the Cu/Nb and comparable to that of the Cu/Ni structures. This explains the observed hardening behavior as the individual layer thickness decreases. The hybrid structure has about the same available space for the dislocations to propagate as the coherent structure, but the addition of the incoherent interface strengthens the material and makes it stronger than the Cu/Ni. On the other hand, the hybrid structure has more dislocations inside the fcc layers than the incoherent structure, therefore, has a higher dislocation density. Consequently, the hybrid structure will be stronger, as the increased dislocation density will result to the addition of pinning sites during this process that would not occur in a monocomponent fcc layer with the same thickness but lower density. The subsequent deformation will require additional stresses to overcome the increased dislocation density in the softer fcc layers.Reference Bellou, Overman, Zbib, Bahr and Misra36 However, this effect needs more clarification and it will be addressed in a future article, where a more comprehensive model for the addition of strengthening from coherent and incoherent interfaces will be presented.
Dislocation content inside the face-centered cubic layers for the 8-nm layer thickness structures. (a) Cu/Ni, (b) Cu/Nb, and (c) Cu/Ni/Nb. All the structures are plotted at the same strain and the atoms are colored according to their central symmetry parameter. In the Cu/Ni/Nb structure the Nb is on the top.
VI. CONCLUSIONS
In this work, metallic multilayer structures with different interfaces (coherent, incoherent, and hybrid) were experimentally tested using nanoindentation. The results show that the strength of the structures increases as the layer thickness decreases. The comparison between the hybrid structures and the coherent and incoherent ones with the same layer thicknesses revealed two distinct behaviors. Then, using molecular dynamics simulations five structures from each type were formed and loaded uniaxially to obtain the stress–strain curves. The simulation results qualitatively agree with the experimental findings. Specifically, at individual layer thicknesses above 3 nm the Cu/Ni/Nb is the strongest followed closely by the Cu/Nb. In all cases, the Cu/Ni is proved to be the weakest of all. This does not change even when the structures are relaxed and loaded again with residual dislocations inside. The results reveal that the addition of bcc Nb to Cu/Ni results to the improvement of the coherent Cu/Ni structure, increasing its strength by about 30%. However, the strength does not increase monotonically as the layer thickness decreases, because of the critical role of the interface that shears in the films with bcc layers and allows the dislocations to cross in the films with fcc layers, therefore, softening the material.
ACKNOWLEDGMENT
This work was supported by the U.S. Department of Energy under Grant No. DE-FG02-07ER46435. The authors acknowledge R.G. Hoagland for many fruitful discussions and A. Misra and the Materials Science and Technology Division at Los Alamos National Laboratory for the manufacturing of the specimens.