1 Introduction
Modern political campaigns rely on advertisements of various forms, including leaflets, emails, and videos, to get their messages heard and mobilize voters. In particular, video advertisements are one of the most popular platforms because they allow political campaigns to use both audio and visuals to send messages to targeted voters through television and especially the Internet. Given their importance in electoral campaigns, many researchers have studied various aspects of video advertisements. Examples include their mobilizing and persuasive effects (Gerber et al. Reference Gerber, Gimpel, Green and Shaw2011), the impacts of their negativity (Fridkin and Kenney Reference Fridkin and Kenney2011), and their issue dimensions (Banda Reference Banda2015). Substantive questions of interest include how campaigns determine contents of ads and how different ads affect the opinion and behavior of voters.
Although the popularity of Internet advertisements is rapidly growing, most existing studies analyzed television ads by relying upon the comprehensive data provided by the Wesleyan Media Project (WMP),Footnote 1 which succeeded the Wisconsin Advertising Project (e.g., Kang et al. Reference Kang, Fowler, Franz and Ridout2017; Kaplan, Park, and Ridout Reference Kaplan, Park and Ridout2006; Krupnikov Reference Krupnikov2011; Meirick et al. Reference Meirick2018; Schaffner Reference Schaffner2005; Sides and Karch Reference Sides and Karch2008).Footnote 2 The WMP datasets cover all federal and gubernatorial elections and some recent state-level elections that date back to 2010. The datasets include a number of variables related to the contents of ads such as issue mentions, opponent appearance, mood of background music, and negativity. In addition, the datasets also contain information about the airing of each advertisement, such as broadcast time and frequency, the media market in which it was aired, and the name of the TV program that was running at the time of its airing.
The content-related variables are manually coded by a group of research assistants who watch a large number of video files and record their coding results through a web-based platform. The source video files are provided by the Campaign Media Analysis Group (CMAG) of Kantar Media, a private corporation that specializes in the collection and analysis of TV ads airings. The WMP data appear to be of high quality. For the 2014 election cycle, for example, the average intercoder agreement, based on a sample of 1,319 double-coded videos for 144 variables, is reported to be 95.8% (Wesleyan Media Project 2017).
While the WMP data have made important contributions to research on TV advertisements, manually coding more than a hundred variables for each of the video files is a laborious and expensive process.Footnote 3 This is of particular concern especially if researchers wish to apply the same manual coding approach to the increasing number of online video advertisements.
To address these shortcomings, we propose to automate the coding of political campaign video advertisements. Applying state-of-the-art machine learning methods, we extract various audio and image features from each video file and code them to reproduce the original variables in the WMP data. Our methods are implemented in an open-source Python package campvideo, which allows users to classify any subset of these variables for their own data. The package is freely available at https://github.com/atarr3/campvideo. By directly comparing the results of our automated coding with the WMP human coding, we show that machine coding is comparable to human coding for such variables as issue mention, opponent mention, and face recognition, and slightly less accurate for negativity. Although the mood classification of background music has a room for improvement, this variable has a considerable degree of disagreement even among human coders.
By conducting an empirical validation study for machine classification of campaign advertisement videos, we contribute to the rapidly growing political science literature that moves beyond conventional data formats into a diversified set of data from audio and visual features that can be extracted from a wide variety of video sources (e.g., Dietrich Reference Dietrich2021; Dietrich, Enos, and Sen Reference Dietrich, Enos and Sen2018; Grabe and Bucy Reference Grabe and Bucy2009; Joo, Bucy, and Seidel Reference Joo, Bucy and Seidel2019; Knox and Lucas Reference Knox and Lucas2021; Torres Reference Torres2018; Torres and Cantu Reference Torres and Cantu2021; Williams, Casas, and Wilkerson Reference Williams, Casas and Wilkerson2020). In addition, we also join the discussion on the promise and challenges of utilizing machine learning algorithms to automate data generation, feature detection, classification, and other tasks where manual procedures are either inefficient or untenable (e.g., Cohn, Ambadar, and Ekman Reference Cohn, Ambadar, Ekman, Coan and Allen2007; Luo et al. Reference Luo, Xing, Milan, Zhang, Liu, Zhao and Kim2021; Matz et al. Reference Matz, Segalin, Stillwell, Müller and Bos2019; Schwemmer et al. Reference Schwemmer, Knight, Bello-Pardo, Oklobdzija, Schoonvelde and Lockhart2020). The rich human coding data from the WMP project provide an unusual opportunity to directly compare automated coding with human coding using a large number of video files across a number of variables (see Proksch, Wratil, and Wäckerle Reference Proksch, Wratil and Wäckerle2019 for a validation study of automatic speech recognition [ASR]). Our findings suggest that coding tasks done by student research assistants can be accomplished by machines to a similar degree of accuracy. We believe that social scientists should take advantage of this recent technological advancement in all aspects of research projects from data collection to analysis.
Overall Workflow
We briefly summarize the overall workflow of our empirical validation study. Since the CMAG video files are of low resolution and are not suitable for automated coding, we first obtain high-resolution video files from the official YouTube channels of political campaigns (Section 2). We use an audio matching algorithm to select a subset of video files that are high-resolution versions of the CMAG videos, which serve as our validation dataset. Although the coverage is far from perfect, a majority of the CMAG videos that were aired for general elections and sponsored by the candidates or their parties are found on YouTube.
Once the validation dataset is constructed, we extract audio and visual features from each video file (Section 3). We combine image texts extracted from visual frames and textual data obtained through automatic audio transcription in order to identify political, economic, and other important issues mentioned in each video. In addition, we use face recognition to detect appearances of the candidates and their opponents, as well as some well-known politicians such as Barack Obama. The moods of music used in the ads are classified based on the audio features. Lastly, we use both textual and music features to classify whether or not a video represents a negative advertisement. For each of these automated coding tasks, we evaluate its accuracy by directly comparing the results of machine coding with those of human coding, including the original variables provided by the WMP and in some cases, judgments made by a group of workers recruited through Amazon’s Mechanical Turk (Section 4).
2 The Validation Data
In this section, we describe how we constructed the campaign advertisement video files used for our validation study. Our primary data source is the official YouTube channels of candidates, which provide high-resolution campaign ad videos free of charge. To create the validation dataset, we match the downloaded video files against the comprehensive set of lower quality CMAG video files used by human coders for the WMP. The matching process identifies a set of videos that are high-resolution versions of the video files used by the WMP.
2.1 Data Acquisition
The video data used for this paper come from two different sources. First, we obtained a set of campaign advertisement video files aired for Presidential, Congressional, and gubernatorial races during 2012 and 2014 election cycles archived by the CMAG.Footnote 4 This set of video files, which are part of the data available from the WMP for a small fee, has a comprehensive coverage for all the television commercials aired in each of the designated media markets.
Unfortunately, these CMAG videos were downscaled to 480p in video resolution, and the audio was down-sampled to 8 kHz, which is comparable to the quality of telephone audio. Using such low-quality data would lead to worse performance, particularly for face recognition, which recommends at least
 $80 \times 80$
face sizes (Schroff, Kalenichenko, and Philbin Reference Schroff, Kalenichenko and Philbin2015), and speech transcription, which recommends audio with at least 16-kHz sampling rate.Footnote
5
While 480p is still large enough to contain faces of the recommended size, there is still a greater chance of error in comparison to the native 720p resolution of the campaign ads. We therefore emphasize that the study conducted in this paper focuses on the automated coding of modern political campaign ads, and the automated coding of historical, low-quality ads is a topic left for future research.
To address these issues, we use YouTube as an alternative source of data. When compared to the CMAG video files used by the WMP, the campaign commercial video files that are publicly available at YouTube are free of charge and are typically of much higher quality. We first manually identify as many official YouTube channels of candidates as possible. These channels list various videos uploaded by the candidates’ campaigns. From each of these channels, we download all video files that are approximately 15, 30, or 60 seconds long, using
 $\pm 5$
-second-buffers around the target to allow for small deviations from the standard lengths. These length restrictions based on the standard formats of TV commercial clips used by advertisers allow us to filter out many of the irrelevant videos, such as free-form online advertisements, clips of townhall meetings, and media coverage/interviews. Identifying the official channels and downloading the videos took place incrementally, with the initial phase beginning in July 2016 and the final verification stretching out until March 2017. Appendix S1 of the Supplementary Material summarizes the channels and video files found on YouTube using the procedure described above.
2.2 Matching the YouTube Data to the CMAG Videos
To directly compare automated coding with the WMP coding, we further subset the retrieved YouTube videos by matching them to the CMAG videos for each candidate. The matching process filters out irrelevant videos that happen to fall within the length ranges we chose. Since a video file consists of both visual frames and audio encodings, matching one video to another in their entirety is a complicated process. In particular, given the substantial difference in image quality between these two sets of videos, we exclusively use the audio portions of the videos as the basis for declaring matches. While there are some cases where two videos with almost identical audio portions have small differences in the visual components, such as added captions or the names of the different locations within the election district, such minor visual differences rarely change the main contents of messages.
Compared to matching with both visual and audio portions, audio matching is a simpler task, and there exist multiple, highly robust algorithms with near-perfect accuracy (Cano et al. Reference Cano, Batlle, Kalker and Haitsma2005; Wang et al. Reference Wang2003). Robustness is particularly important as the difference between YouTube and CMAG audio quality is substantial. We choose the spectral fingerprinting algorithm of Haitsma and Kalker (Reference Haitsma and Kalker2002) primarily for its relative ease of implementation and perform matching between the YouTube and CMAG video collections. Spectral fingerprinting performs feature extraction by reducing a high-dimensional raw audio signal to a low-dimensional “fingerprint” representative of the frequency content of the audio with minimal loss in information pertaining to the audio track’s identity. Appendix S2 of the Supplementary Material describes the process through which the spectral fingerprint is calculated, whereas Appendix S3 of the Supplementary Material explains the details of the matching procedure itself.
We empirically evaluate the accuracy of the matching procedure by randomly selecting 100 cases where matches were declared and another 100 cases where no suitable match was found. After manual verification, we found that the results are correct in all 200 instances, thus indicating the success of our matching procedure. Although our matching procedure yields accurate results, one issue is the presence of multiple versions of substantively identical video files in the CMAG dataset. For example, when a candidate modifies a video to address different counties or cities within a state, the CMAG dataset treats this as a new video file. This coding practice is not ideal for our purposes because we wish to validate our automated coding method using substantively different videos. Across the 2012 and 2014 election cycles, we find 338 pairs of CMAG videos declared as matches and consolidated them as single video files.
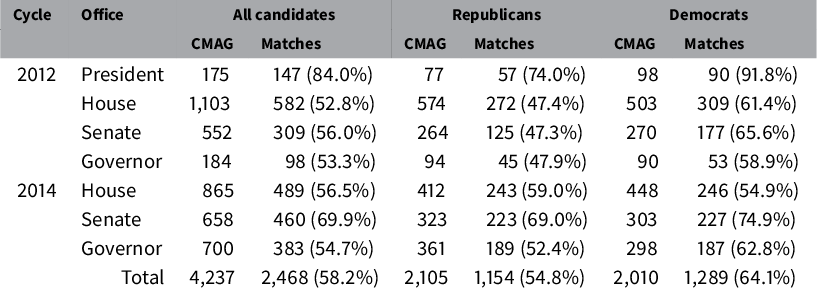
Table 1 presents the number and percentage of CMAG videos in the WMP dataset, for which we found identical but higher-resolution versions at the candidates’ official YouTube channels. In the 2012 general elections, the coverage rate is the highest for the videos by the Presidential candidates with 84%, while it generally hovers around 55% for the other candidates. In the 2014 election cycle, we were able to find about 70% of videos for Senate candidates, whereas the coverage rate stays similar to that of the 2012 elections for the House and Gubernatorial elections. For most elections reported, we retrieved higher proportions of videos sponsored by Democratic candidates than those run by Republican candidates, with the exception of the House races in 2014; on average, we have about 55% of all Republican TV ads recovered and 64% of those from Democrats.
Coverage of political advertisement videos available at YouTube. The table presents the number and percentage of CMAG videos in the WMP dataset for which we found identical but higher-resolution versions at YouTube. Among the three categories of columns, the first represents the numbers for all candidates, the second for Republican candidates, and the last for Democratic candidates. Note that the first category also includes third-party or independent candidates.

3 Feature Construction
To analyze video files, the first step is to construct relevant audio and visual features. In this section, we describe the methods we use for feature extraction and construction. Although we discuss visual and audio features in that order, they can be independently extracted. The same point applies to different visual and audio features described in each subsection.
3.1 Visual Features
3.1.1 Video Summarization
Video data are comprised of both audio and visual components. While audio data come in the form of a digital signal, as discussed in Section 2.2, visual data come in the form of a sequence of images, called frames. Most of the videos in our YouTube dataset were generated under a frame rate of either 24 or 30 frames per second at a resolution of
 $1,280 \times 720$
pixels. Since a standard campaign advertisement runs for 30 or 60 seconds, each video contains 720–1,800 frames, which amounts to several gigabytes of visual information.
Processing and analyzing this amount of data can be cumbersome and computationally expensive, especially when scaling up analysis to political campaigns, which generate tens of thousands of ads every election cycle.Footnote 6 While existing algorithms might be able to handle this amount of data, our study focuses on automating tasks that do not depend on motional information in the video, namely candidate and image text recognition. For these tasks, consecutive frames contain roughly identical visual information pertaining to these variables, and therefore there is significant redundancy in the frame data.
To improve efficiency in analyzing the visual content of ads, we use the video summarization procedure to obtain a smaller set of frames that captures most of the relevant visual information contained in the video. We note that this approach, while suitable for the variables considered in this study, results in an information loss. Specifically, summarization does not capture the temporal and motional qualities of videos, which still carry important information about the content of the ad and may be useful in other tasks.
We use the algorithm of Chakraborty, Tickoo, and Iyer (Reference Chakraborty, Tickoo and Iyer2015) for its simplicity, ease of tuning, and flexibility in controlling the number of frames in the summary. This algorithm allows us to sacrifice summary uniqueness at the benefit of reducing the chance of missing frames containing crucial information, helping mitigate one source of misclassification error in our automated coding tasks. Another benefit of this algorithm is that it is designed to work on low-resolution videos, which greatly reduces the amount of computation needed to generate the summary. Appendix S4 of the Supplementary Material describes the details of the algorithm and computation. Although there exist alternative algorithms, the empirical performance comparison of these algorithms is beyond the scope of this paper (see Baskurt and Samet Reference Baskurt and Samet2019 for a review). In our own studies, summarization resulted in a roughly 97%–99% reduction in the number of frames, and computation took approximately 20–40 seconds for each video. These results suggest summarization may yield significant efficiency gains over methods which analyze all frames in the video.
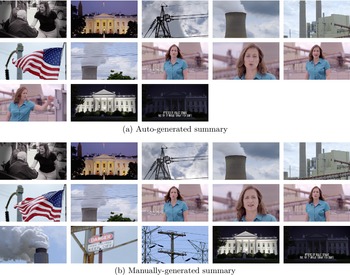
To evaluate the performance of our video summarization procedure, we compare the results of our autogenerated video summarization against those of manual summarization for a random sample of 40 video files from our validation dataset. We acknowledge that this study is too small to draw any strong conclusions about our approach, but it is still helpful in understanding if video summarization leads to a substantial loss in important visual information. We watch each sampled video carefully and select frames that we think are representative of the visual contents. Our selection criteria is based on the idea that since a video consists of a series of shots, each of which represents uninterrupted segments of frames featuring a fixed camera angle that run between two edits or cuts, it can be effectively summarized by a single frame. Therefore, we construct the manual summary by selecting a single frame for each shot.
The complete results are presented in Appendix S7 of the Supplementary Material. Figure 1 presents an example, which corresponds to the worst performance by automated video summarization among our 40 sampled videos. The original video file is taken from a campaign ad for Natalie Tennant in the 2014 senatorial election in West Virginia. We find that in this case the autogenerated summary is missing three images toward the end of the ad, one showing a smokestack, one showing a sign, and the final one showing power lines. In the original ad, these images were shown in rapid succession and were difficult to spot while viewing. Additionally, their omission is not consequential because there are several other images earlier in the summary showing similar content. For the other 39 comparisons, the performance of automated video summarization is even better, capturing most of the visual information contained in each video file.
Autogenerated summary and Manually generated summary.

3.1.2 Image Text Recognition
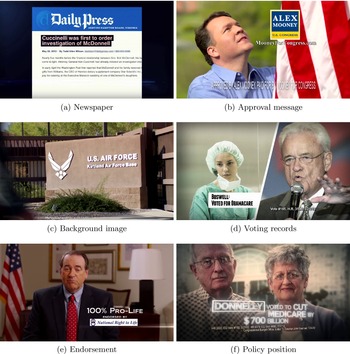
Many campaign advertisements use image texts or on-screen texts to provide additional information, emphasize certain contents of ads, and display approval messages and endorsements. Since our goal is to analyze the contents of ads, it is important to extract image texts and use them as features that supplement audio texts for our classification tasks. Figure 2 presents some examples of frames containing image texts, ranging from the use of newspaper to the display of policy position and endorsement.Footnote 7
Examples of image texts. Source: see footnote 7.

We use the Google Cloud Platform (GCP) Vision APIFootnote 8 to perform image text detection on each frame in a given video summary and obtain the raw text data. The GCP is a cloud-computing service that offers a wide variety of data processing tasks for a small fee. Because the GCP is a proprietary service, little to no information is available about the algorithms they use. However, many believe that the Vision API algorithms are based on convolutional neural networks (CNNs), which is the standard approach in the current literature on image text detection and recognition (Ye and Doermann Reference Ye and Doermann2015; Zhu, Yao, and Bai Reference Zhu, Yao and Bai2016).
We illustrate the performance of the API using the examples shown in Figure 2. While the performance of the algorithm is not perfect, it captures most of image texts. Specifically, the API is able to recover all texts in the frames of Figure 2a,c,e, while missing just a few words in the frames of Figure 2b,d,f. In some cases, the API is too accurate. The algorithm detected all of the small document texts in the newspaper shown in the frame of Figure 2a, which human coders would not be able to process in a short amount of time. In order to mitigate this issue, we ignore detected text whose height is less than 3.5% of the total image height, and we retain only the first 25 detected bounding boxes.
The algorithm also tends to miss texts which blend into the background. For example, the API fails to detect “Approved by Alex Mooney. Paid for by Mooney for Congress” in the frame of Figure 2b, which uses narrow fonts and mixes with different backgrounds. The algorithm also misses the date, “3/21/10,” in the frame of Figure 2d while correctly detecting all the other words. In addition, the API misses the phrase “Donnelly voted to cut” in the frame of Figure 2f perhaps because of the box used around the “Donnelly” and its fuzzy fonts. Fortunately, in this and many other cases, the missed phrase was also spoken by people in the video.
Finally, we note that poor video summarization can impact the performance of image text detection. If the image quality of selected frames is poor, or if frames containing text are missing from the summary, any algorithm will have a difficult time detecting the correct image text.
3.1.3 Face Recognition
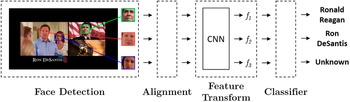
We also perform face recognition to determine candidate and opponent appearances in the ad. This automates the coding of the WMP variables, which indicate whether particular politicians are mentioned or pictured in ads. Detecting the presence of opposing candidates is of particular interest as this is usually an indicator of an attack ad. Our facial recognition procedure consists of several steps as illustrated in Figure 3. First, we use a CNN to detect faces in each summary frame, producing a set of cropped images. Second, we transform the face images to a standard size and pose using estimated landmark feature locations, which correspond to different features of the face, such as the corners of the mouth and eyes, the tip of the nose, or the eyebrows. Third, we use another CNN to compute a feature representation in
 $\mathbb {R}^d$
for each of the detected faces. Finally, we use these features as inputs to a pre-trained classifier to determine the identity of the detected face.
System diagram for face recognition. An example is taken from a campaign video for Republican candidate Ron DeSantis for the 2012 House election in Florida’s sixth district. First, faces are detected in the source image, producing a set of cropped images. Second, the faces are centered, scaled, and aligned so that the eyes are level. Third, the aligned faces are fed into a convolutional neural network, which computes a vector representation
 $f_j$
of the detected face j in the feature transform step. Finally, the identity of the face is determined using a pretrained classifier.

We now describe the process for detecting faces and computing the feature representation, leaving discussion on classification and its results to Section 4.3. Face detection and recognition is performed using the Python package face_recognition,Footnote 9 which provides simple implementations of the face detection and recognition algorithms from the C++ library dlib (King Reference King2009). This library uses a CNN for face detection, an ensemble of gradient boosted regression trees for face alignment (Kazemi and Sullivan Reference Kazemi and Sullivan2014), and the FaceNet algorithm for the feature computation (Schroff et al. Reference Schroff, Kalenichenko and Philbin2015). We note that this algorithm is identical to the one used in Xi et al. (Reference Xi, Ma, Liou, Steinert-Threlkeld, Anastasopoulos and Joo2020).
Following suggestions in the FaceNet paper, classification was performed using Euclidean distance thresholding between the features for the detected faces in the ad and precomputed features corresponding to reference images of the candidates. We chose the one-versus-rest approach for classification due to its simplicity in implementation. The validation results in both Schroff et al. (Reference Schroff, Kalenichenko and Philbin2015) and this paper show low false detection rates, suggesting that the algorithm may also be able to distinguish faces well in a categorical classification setting. While there are many other face detection (see Jin and Tan Reference Jin and Tan2017) and face recognition (see Wang and Deng Reference Wang and Deng2018) algorithms, we opted to use the above methods due to the availability of a high-quality, open-source implementation with pretrained models. Appendix S5 of the Supplementary Material provides a brief summary of our algorithms for face detection, face alignment, and face recognition.
Using the face_recognition implementations for these algorithms, for each video summary, we compute face embeddings for all faces detected across the summary, generating a facial feature set to be used for face identification. We note that like image text detection, face detection and recognition will also be negatively impacted by a poor quality summary.
3.2 Audio Features
Audio data contain critical information about the content of a campaign advertisement. A typical ad features a narrator, often the candidate, discussing their policy positions and highlighting issues with their opponent. Another prominent component is music. Nearly, all campaign ads use music to set the tone of the ad. For example, ominous and tense music is often used as a backdrop for an attack against the opponent. Below, we discuss the methods we use to extract transcripts from the audio and to compute features that capture the overall tone of the audio. We also discuss how text features are computed from transcripts.
3.2.1 Speech Transcription
We use the GCP Video Intelligence API to generate transcripts for each video in our dataset.Footnote 10 While YouTube may now provide high-quality transcripts for all uploaded videos, this system was in its early stages when the 2012 and 2014 election ads were posted on YouTube. We found the performance of YouTube’s transcription service during this period to be underwhelming in comparison to the GCP Video Intelligence API. This speech transcription algorithm takes a video as input and returns its estimate of the transcript for the video, without punctuation. Like the Vision API discussed in Section 3.1.2, an exact description on its algorithm for ASR is not available, though the literature suggests they are using a type of neural network called long short-term memory (Soltau et al. Reference Soltau, Liao and Sak2016; Xiong et al. Reference Xiong2016).
The GCP Video Intelligence API has a feature that allows the user to also provide phrases expected to appear in the video to help improve the accuracy of the transcription. This is useful in our application since one of our goals is to detect candidate or opponent mentions in the ad. Since names are not commonly used words and some candidate names are derived from other languages, it can be difficult for ASR systems to accurately recognize them. For each video, we provide the names of both the primary party candidates and the leading independent candidate. The list of names was collected from Wikipedia pages on the corresponding elections, which contained the names of candidates as used during the campaign cycle, as opposed to their birth name (e.g., Bernie Sanders versus Bernard Sanders).
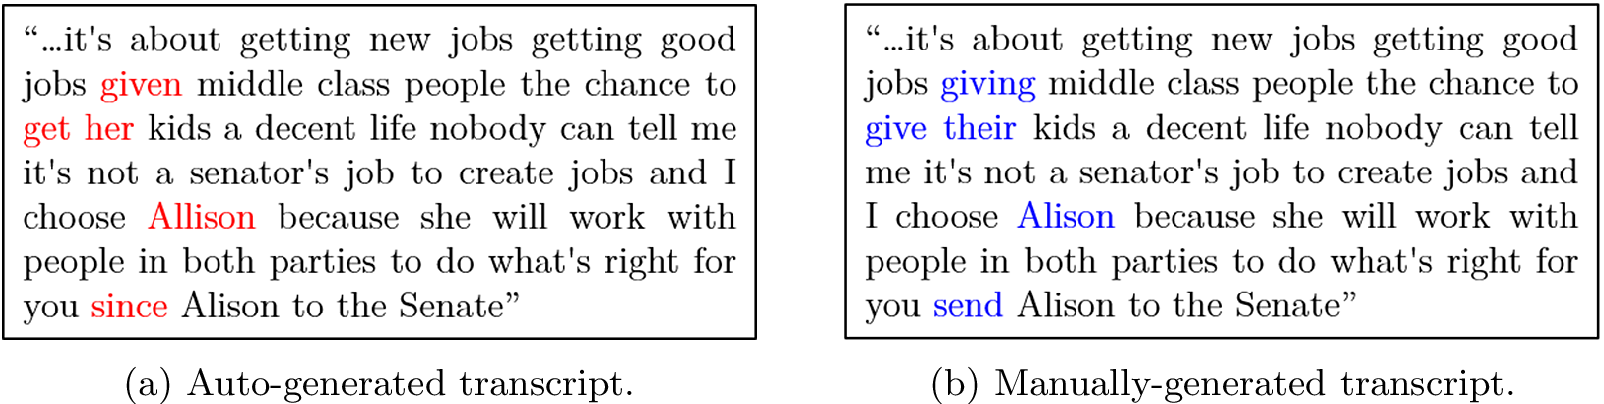
The literature suggests that these ASR systems can achieve very low error rates (Prabhavalkar et al. Reference Prabhavalkar, Rao, Sainath, Li, Johnson and Jaitly2017). Proksch et al. (Reference Proksch, Wratil and Wäckerle2019) analyze political speech in EU State of the Union debates and show that using the GCP’s autogenerated transcripts for bag-of-words text models is comparable to using the human annotation. We also find GCP’s algorithm to be accurate and suitable for our task. The most common error is mixing up similar-sounding words, but these errors often do not diminish the substantive meaning of the text. Figure 4 shows an example of a transcript obtained using the video intelligence API and its ground truth, illustrating the accuracy of the GCP’s transcription.
Autogenerated transcript and Manually generated transcript.

3.2.2 Text Features
We use the transcripts generated from Google’s ASR algorithm to perform several video classification tasks, that is, issue mentions (Section 4.1), opponent mentions (Section 4.2), and ad negativity (Section 4.5). For the first two tasks, we employ keyword-based methods using only the raw transcripts, but for ad negativity, we construct text features and train a classifier. In this section, we describe the procedure for computing these text features used for ad negativity classification.
We use a bag-of-words for our input feature. We chose this feature over more advanced alternatives, such as sentence embeddings, because the computer-generated contained no punctuation, which would have severely degraded the performance of any syntax-based method. Instead, we focus on using natural language processing techniques to preprocess and filter the text, producing a concise vocabulary for computing a vector of word counts. We achieve this using the Python package spacy.Footnote 11
Specifically, we begin by annotating the raw text with part-of-speech tagging and named entity recognition, separating the named entities from the rest of the text. This allows us to tokenize the sentence without splitting up n-grams that should be kept together, such as Social Security or Affordable Care Act. After annotating the text, we filter out tokens that carry no meaning in regard to the sentiment of the ad. In particular, we remove named entities corresponding to people, with the exception of Barack Obama, Ronald Reagan, and Nancy Pelosi, because they were often used to emphasize a favored or opposing candidate’s ideology.Footnote 12 Lastly, the filtered tokens not corresponding to entities are passed through a lemmatizer to recover the dictionary form (i.e., the basic form found in the dictionary) in order to condense similar words into a single token.
3.2.3 Music Features
In addition to text, the type of the music used in the video also provides useful information about the tone or purpose of the given ad. Hence, we apply the algorithm of Ren, Ming-Ju, and Jang (Reference Ren, Ming-Ju and Jang2015) to compute features that are useful for classifying the types of the music (see the references therein for other algorithms). We choose this algorithm based on its performance in the Music Information Retrieval Evaluation eXchange (MIREX). The MIREX is a community-driven framework for the scientific evaluation of systems and algorithms for various problems in the domain of machine learning in audio and music information retrieval (Downie Reference Downie2008).
Like the spectral fingerprinting method described in Section 2.2, the music features are based on the spectrogram of the audio signal. We first obtain the audio signals from the video. Before the FFT step in computing the spectrogram, each frame is passed through a pre-emphasis filter, which boosts the high-frequency components. This operation helps to distinguish high-frequency components of a signal from noise in the spectrum that tend to have weaker magnitude than the low-frequency components. After pre-emphasis, we follow the same procedure as the one used in Section 2.2; the frames are weighted by a Hamming window, and the 1,024-point FFT, followed by the computation of an absolute value producing the spectrogram.
The music features consist of several characterizations of spectrogram with the goal of capturing the different perceptual qualities of the audio, such as pitch, timbre, tempo, or rhythm. We can categorize these features as short-term or long-term. The short-term features are used to measure the timbral qualities of the audio signal and are characterized by the shape of the spectrum. In contrast, the long-term features characterize perceptual audio qualities which occur on a longer time scale than timbre, such as rhythm and tempo. Table S6.2 in Appendix S6 of the Supplementary Material presents a summary of these audio features and the same appendix provides the full mathematical description of the features. Combining the short-term and long-term features, we obtain a
 $452$
-dimensional feature vector and use it for our music mood classification, described later in Section 4.4, and sentiment analysis, described in Section 4.5.
4 Validation Results
In this section, we present the validation results, evaluating the performance of automated coding against that of human coding. Appendix S8 of the Supplementary Material provides the full question asked to human coders for all variables analyzed in this section.
4.1 Issue Mention
A key set of variables in the WMP datasets indicate whether or not a TV advertisement mentions or pictures certain political issues and actors of interest. These variables can be broadly classified into three categories. The first set of variables indicate whether each of 10 prominent actors, including Barack Obama, Nancy Pelosi, Mitch McConnell, Democrats, and Republicans, are mentioned verbatim and/or pictured. The second set of variables represent whether each of 12 politically charged words or phrases, such as Tea Party, Change, Conservative, Wall Street, and Big Government, are also mentioned verbatim. The final set of variables indicate whether 61 issues, including Tax, Jobs/Employment, Gun Control, Drugs, and Immigration, are discussed, even if they are not mentioned verbatim.
Taking the case of gun control for illustration, simply looking for the exact mention of the two-word phrase gun control may not sufficiently capture the instances of the issue being mentioned, as candidates often express their opinions on the matter via different wordings or phrases. If a candidate speaks about protecting the right to keep and bear arms or criticizes Congress for having too close a tie with The National Rifle Association of America (NRA), for example, they are taking two opposing stances on gun control issue. Such instances should be reflected in our coding of the corresponding variable.
Similar to the analysis conducted in Proksch et al. (Reference Proksch, Wratil and Wäckerle2019), our goal in this section is to assess the quality the automated transcripts for use in basic text analysis tasks, so for issue mentions, we opt to use a straightforward approach. Specifically, we automate the coding of these variables by simply checking whether at least one keyword is mentioned in each video. While the WMP codebook provides the issue labels (i.e., issues, names of political actors, and phrases), they do not always constitute useful keywords. Thus, we choose a set of relevant words and phrases as keywords and in certain cases exclude the use of these keywords in irrelevant contexts (e.g., Wall Street Journal does not count as a mention of Wall Street). We note that for issue detection, we do not stem or lemmatize the text, as doing so would result in making subtle distinctions between uses of the same keywords and phrases. For example, stemming would make it impossible to distinguish “He is not doing a good job as our Governor” and “We must stop importing our jobs overseas” in their uses of the word “job.” The complete list of keywords we use appears in Table S9.4 in Appendix S9 of the Supplementary Material.
Given the set of keywords, we code an issue mention variable as 1 if at least one of the keywords is either mentioned in the audio transcript or pictured in the image texts extracted from each video file (and 0 otherwise). Note that in classification, we exclude image text mentions of Congress and Wall Street to decrease false positives due to more frequent out-of-context references. We also incorporate the facial recognition algorithm to complement the text in classifying Barack Obama.
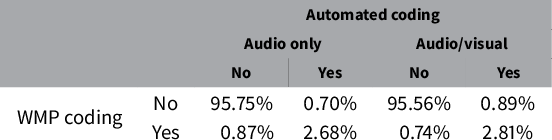
We first examine the overall level of agreement between the WMP issue mention variables and our automated coding of them across 204,844 (
 $= 2,468 \times 83$
) video-issue pairs using only the audio data. Table 2 shows that they agree in more than 98% of all video-issue pairs considered. The use of image text and face recognition to complement audio transcript results in 661 (0.32% overall) additional positive findings. Of these samples, WMP codes 254 (38%) of them as Yes, and the remaining 407 (62%) as No. Although the overall agreement rate is high, this is in part due to the fact that many values of issue mention variables are zero: each video only mentions a small number of issues.
Comparison of the issue mention variable between the WMP and automated codings. The value in each cell corresponds to the proportion of the four different combinations of results from the WMP and automated coding schemes. The first two columns show the results when we only use audio transcripts to automatically detect keywords, and the remaining two columns are for when audio transcripts, image text, and face recognition are used. The overall accuracy is 98.43% (left) and 98.37% (right). There are a total of
 $204,844$
video-issue pairs across 83 issues.

A more informative metric may be the false positive rate (FPR) and false negative rate (FNR). If we assume that the WMP coding is actually correct, then the FPR (i.e., the proportion of Yes for the automated coding among the cases the WMP codes No) of less than
 $1\%$
and the FNR (i.e., the proportion of No by automated coding among the cases the WMP codes Yes) of
 $24\%$
. Using both audio and visual data, the FNR decreases to
 $21\%$
and the FPR increases slightly but still remains less than
 $1\%$
. The FNR value is relatively high, suggesting that our approach struggles in detecting issue mentions that human coders do. This error is likely due to our simple, keyword-based approach, which may struggle when issue mentions occur in more subtle contexts. Appendix S11 of the Supplementary Material provides a more thorough breakdown of the causes for error. We find that misunderstood contexts was the leading cause of false negatives, while human error in WMP coding was the leading cause of false positives. We also find that machine coding was correct in the majority of disagreement cases.
However, it is also possible that both humans and machines may incorrectly code some variables. We use Amazon Mechanical Turk to further validate both automated and manual codings. To do this, we randomly sample 500 video-issue pairs such that 210 pairs represent the cases of agreement, whereas the remaining 290 pairs correspond to the cases of disagreement with 176 false positives (i.e., automated coding gives Yes, while human coding gives No) and 114 false negatives (i.e., automated coding gives No, while human coding gives Yes). Each issue-video pair is reviewed by five different individuals who were granted the qualification of MTurk Masters. An example script including instructions as seen by MTurkers can be found in Figure S10.5 in Appendix S10 of the Supplementary Material.
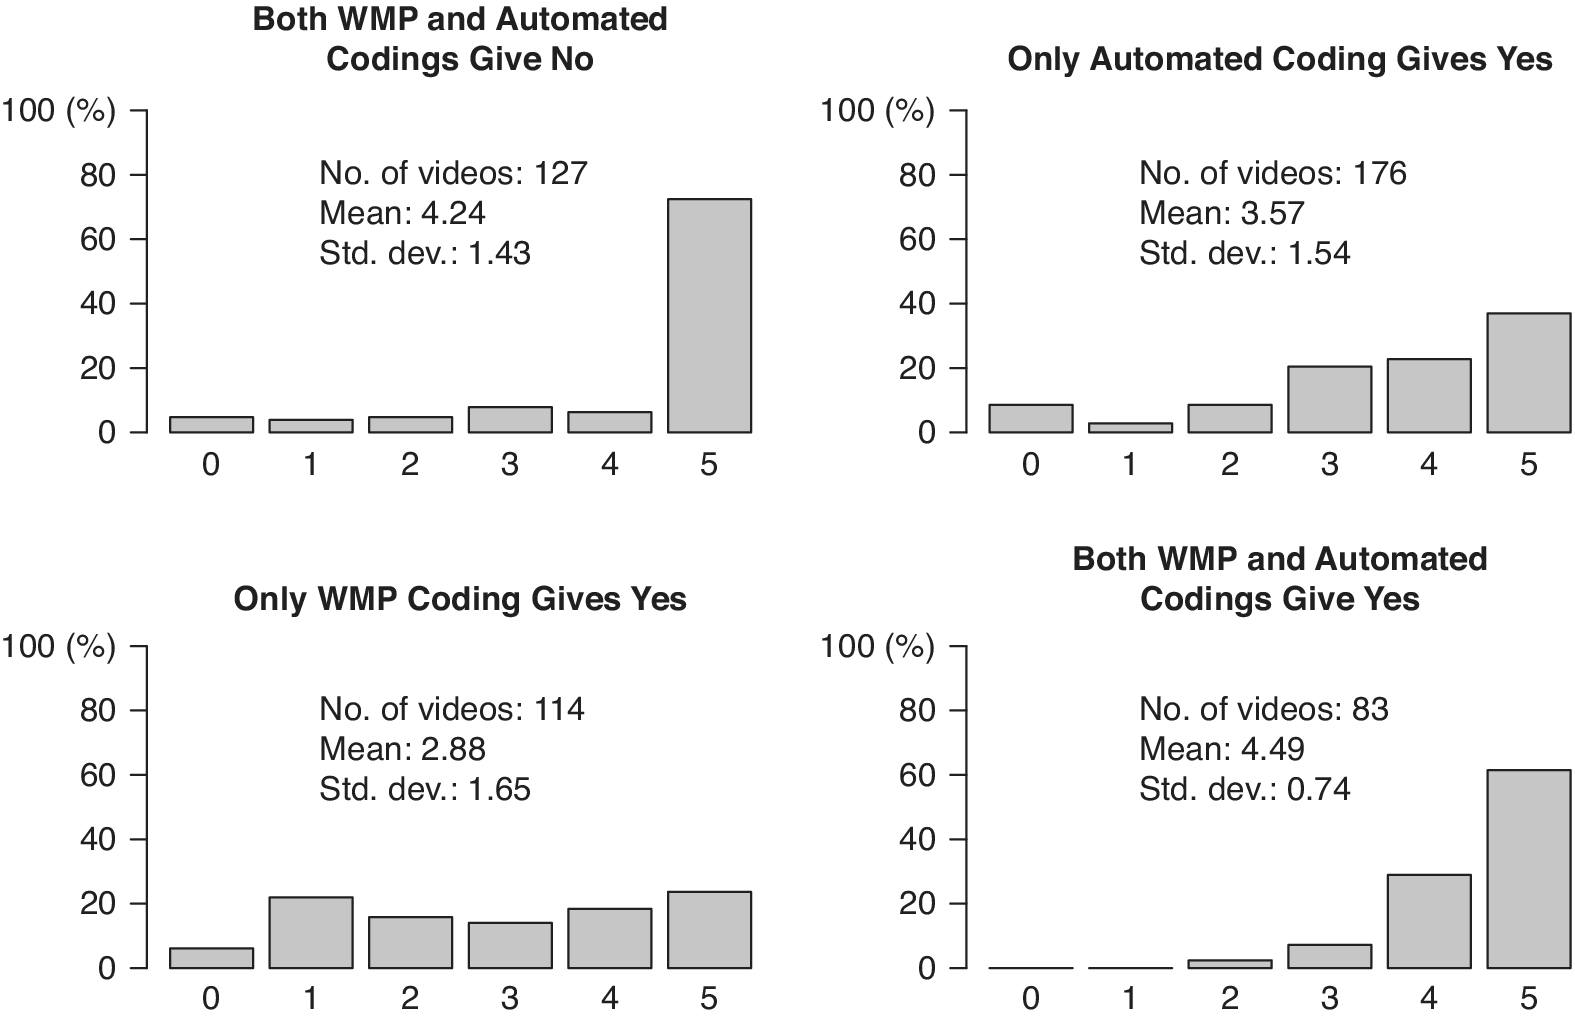
Figure 5 presents a bar plot of the number of MTurkers who agree with the automated coding in each of the four different agreement conditions. When the WMP and automated codings agree with each other (the two diagonal plots), many MTurkers reach the same judgment, as can be seen by the numbers concentrated around 4 or 5. When the WMP and automated codings disagree with each other (off-diagonal plots), we find that the MTurkers often disagree with one another and are more likely to agree with the automated coding. The results suggest that the automated coding is more accurate than the WMP coding in cases of disagreement between the two coding schemes.
Number of MTurkers who are in agreement with automated coding for issue mentions. The four cases are based on the agreement and lack thereof between the WMP and automated codings. A total number of MTurkers for each task (hence the maximum possible number of MTurkers who agree with automated coding) is 5. The texts within each plot show the number of issue-video pairs included in each sample as well as the mean and standard deviation of the number of MTurkers in agreement with the automated coding.

4.2 Opponent Mention
The WMP datasets also include a separate variable that determines whether the ad mentions the opponent in the main part of an ad excluding the section corresponding to the oral approval. Our automated coding algorithm is exactly the same as with issue mentions, except that the keywords used are three different forms of the opponent’s last name: last name itself, possessive, and possessive without an apostrophe. For example, if the name of the opponent is Jane Roe, then we use “Roe,” “Roe’s,” and “Roes.” We include the possessive form without an apostrophe in order to account for the instances where audio transcription or image text detection algorithm misinterprets the possessive as a plural and thus incorrectly suppresses the apostrophe.
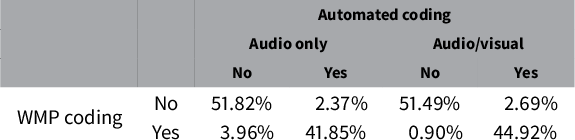
Table 3 shows that the automated coding agrees with the original WMP coding in over 96% of the cases when both audio transcripts and on-screen text detection are combined. When compared to the case of the issue mention variable, we find that there is a better balance between positive and negative cases. A total of 88 (4% overall) disagreements are recorded, with three quarters of them in the false positive condition. We also see that using image text detection to complement audio transcript boosted the performance of the coding algorithm, leading to an increase of 75 (3% overall) in the true positive condition and an increase of 8 (0.4% overall) in the false positive condition.
Comparison of the opponent mention variable between the WMP and automated codings. The value in each cell corresponds to the proportion of the four different combinations of results from the two coding schemes. The first two columns show the results when we only use audio transcripts to detect keywords, and the remaining two columns are for when both audio transcripts and on-screen text are used. The overall accuracy is 93.67% (left) and 96.41% (right). A total of 2,449 videos were considered, after discarding 19 videos for which the WMP variable was missing.

Finally, we examine the common causes for errors in Appendix S12 of the Supplementary Material. We found that human error in the WMP labeling was the most common cause of false positives, and mistakes in the automated transcription were the leading cause of false negatives. In any case, our method is correct in the majority of disagreement cases, which demonstrates that the performance of automated coding of the opponent mention variable exceeds that of WMP human coding.
4.3 Face Recognition
Our goal with face recognition is to detect whether or not the favored candidate and opponent appear in the campaign ad. Unfortunately, the WMP does not encode these variables in their dataset, instead only tracking when favored candidates or opponents appear in the main part of an ad, excluding the section corresponding to the oral approval. For opponent references, the nuance in the WMP definition is irrelevant, since mentions and depictions rarely appear in the oral approval. For favored candidate references, however, this poses a problem in our ability to evaluate our face recognition algorithm, since favored candidates often only appear during the oral approval. To address this issue, we combine the favored candidate variable with another WMP indicator variable that codes whether the favored candidate is seen directly speaking to the audience during the oral approval section. Note that this combined variable is still coded as No even when the candidate appears during the approval message if they do not directly address the audience, so it is not an exact replacement for favored candidate appearance. Nevertheless, we evaluate the ability of the face recognition algorithm to correctly detect favored and opposing candidate faces, regardless of which segments of the ad they appear in, by comparing it against this combined variable for favored candidate depictions and the original variable for opponent depictions.
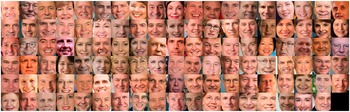
We automatically detect candidate and opponent appearances for ads aired in the 2012 and 2014 Senate elections, for which we have at least one YouTube video matched to a WMP video file. We first collected the images of 113 Senate candidates by scraping the Wikipedia pages dedicated to the corresponding elections. In cases where the pictures were either missing, outdated, or of low quality, these were replaced by manual searches on the Internet. Figure 6 presents a montage of all images for these candidates. Finally, we applied the face recognition algorithm described in Section 3.1.3, declaring a match when the Euclidean distance between face encodings for a detected face and the reference image is below some threshold t. We chose t via supervised learning. First, we constructed the training data using the minimum distance between all detected face encodings and the reference encoding for the opposing candidate as features and the corresponding WMP variable as class labels. We then fit a linear Support Vector Machine (SVM) to the data and obtained a value of
 $t=0.5139$
.Footnote
13
We plot the Receiver Operating Characteristic (ROC) curves in Appendix S13 of the Supplementary Material for both candidate variables, showing the trade-off between FPR and TPR as the threshold is varied.
Montage of collected images of 113 Senate candidates from the 2012 and 2014 election cycles. The candidates are arranged in the alphabetical order, from Todd Akin in the top left to Mark Zaccaria in the bottom right.

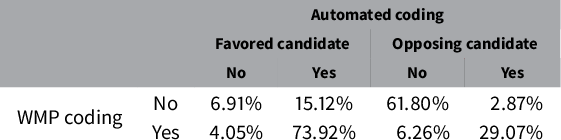
Table 4 shows the patterns of agreements and disagreements between the WMP and automated codings of the candidate appearance variables. For favored candidates, the two modes of coding agree in about 81% of the cases. Among the cases of disagreement, the automated face recognition returns Yes in most of the samples. The overall agreement rate is higher for the opposing candidates, with the two agreeing on about 91% of the cases. Most of the disagreements correspond to the cases in which the face recognition algorithm returns No. We examine the disagreement cases in Appendix S13 of the Supplementary Material, finding that 64% of the errors are due to detected candidates in the oral approval segment and human error in the WMP labels. After accounting for these issues, the accuracy for favored and opposing candidate appearances increases to 96% and 94%, respectively.
Comparison of candidate appearance variables between the WMP and automated face recognition. The value in each cell corresponds to the proportion of the four different combinations of results from the WMP and automated coding schemes. The first two columns are for the appearance of the favored candidates, and the remaining two columns are for the appearance of opposing candidates. The overall accuracy is 80.83% (left) and 90.87% (right). Total sample size is 767.

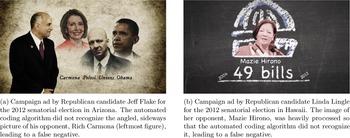
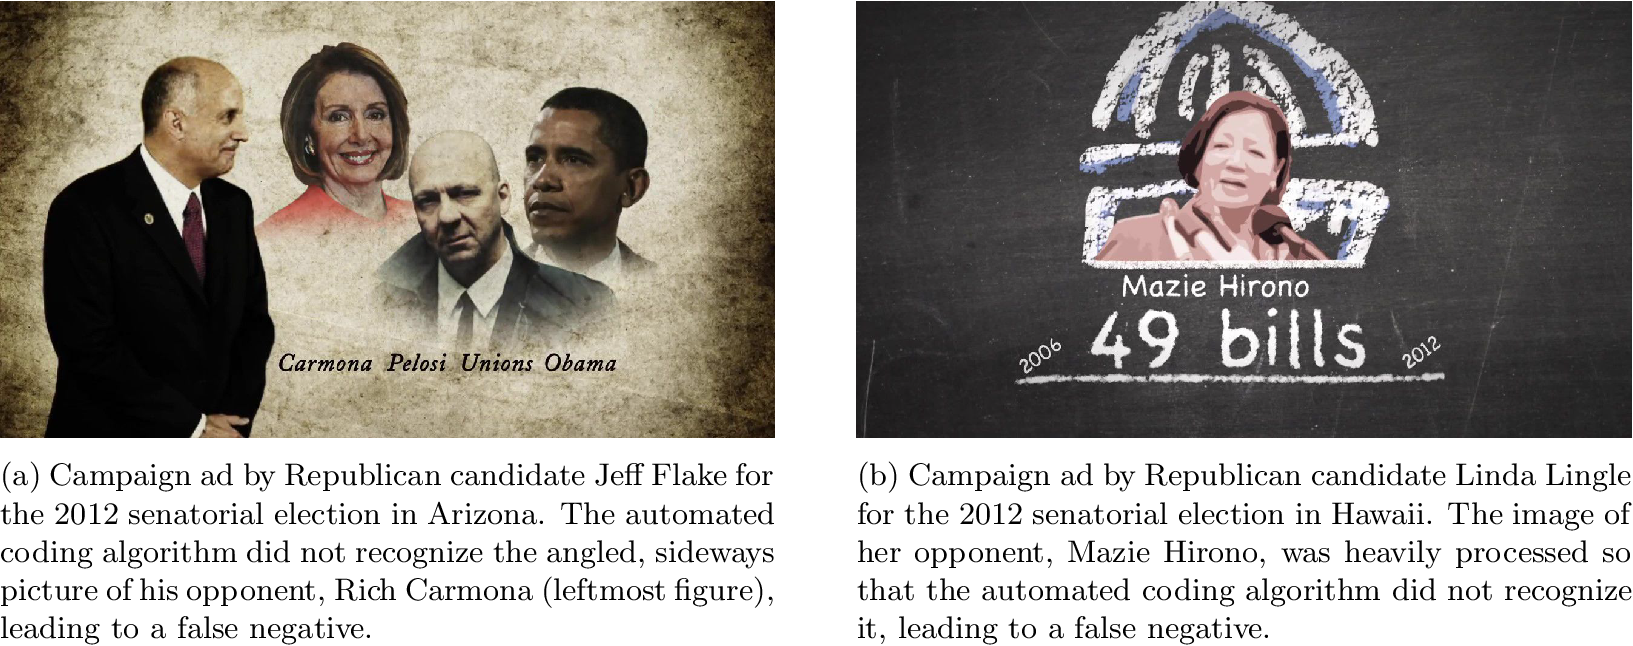
The impressive performance of the face recognition algorithm may seem surprising given that many frames are discarded in the summarization process. However, candidates and opponents are often prominently displayed in neutral pose in campaign ads to help viewers recognize, which makes face recognition a relatively easy task in this application. Two illustrative examples of the most common issues that lead to false negatives appear in Figure 7. These examples highlight the shortcomings of the face recognition algorithm, which struggles when the candidate appearance occurs in nonstandard pose (left image) or when there is visual noise in the image (right image). Another hypothesis for the misclassification of the right image is bias in face recognition systems, which have been shown to struggle with minorities (e.g., Grother et al. Reference Grother, Ngan and Hanaoka2019). However, in many of these cases, the minimum distance between detected face encodings and the reference encoding was near the threshold.
Examples illustrating the mistake of the automated coding for the candidate appearance variable.
4.4 Music Mood Classification
Many political campaign ads have background music. The WMP dataset contains three binary variables that describe its mood as “ominous/tense,” “uplifting,” and “sad/sorrowful.” The WMP coding of these three categories of music are not mutually exclusive: among 2,250 videos for which at least one type of music is indicated, 358 (16%) of them have more than one category selected by the coders. The three classes are relatively imbalanced as well: “uplifting” music was most frequently coded with 1,586 videos (70%), followed by “ominous/tense” music with 712 videos (32%), and “sad/sorrowful” music with 312 videos (14%).
We take a supervised learning approach by training an SVM classifier with balanced class weights and radial basis function. We tune the hyperparameters via a fivefold cross-validated grid search with the loss function optimized for accuracy for the “ominous/tense” and “uplifting” classifiers and balanced accuracy for the “sad/sorrowful” classifier. The music features used for classification are described in Section 3.2.3, and the music encoding is done independently for each category.
Table 5 presents the proportion of agreements and disagreements between the original WMP and automated codings. Overall, the average rate of agreement is similar across the three types of music: 74% for “ominous/tense” music, 76% for “uplifting” music, and 74% for “sad/sorrowful” music. As alluded to above, the frequency of each type of musical moods is different, with the uplifting music being detected by both coding schemes in the majority of the sampled videos, while the corresponding numbers are lower for “ominous/tense” and “sad/sorrowful” music. Among the disagreement cases, the classifier is more likely to return No compared to the WMP coding for “ominous/tense” music and Yes for “uplifting” and “sad/sorrowful” music.
Comparison of the music mood variables between the WMP and automated codings. The value in each cell corresponds to the proportion of the four different combinations of results from the WMP and automated coding schemes. The three two-by-two matrices correspond to the three different moods of music used in the WMP data. The overall accuracy is 73.56% (left), 76.44% (middle), and 74.22% (right). The results shown here are from the test dataset of size 450.

Compared to the other classification tasks, the rate of agreement with the original WMP coding is lower for this music mood classification task. This is because music mood classification is known to be a difficult task, with the current state-of-the-art machine-learning approaches achieving about 70% classification accuracy for the benchmark MIREX dataset (Ren et al. Reference Ren, Ming-Ju and Jang2015). Another possible reason for the low performance is that the features used are not suitable for mood classification, which was observed in Mehr et al. (Reference Mehr2019). However, even human coders who generally achieve better classification accuracy do not come to complete agreement as to the type of music a given ad contains. The WMP reports the intercoder agreement rates of 83.9%, 88.8%, and 89.5% for the “ominous/tense,” “uplifting,” and “sad/sorrowful” categories, respectively, based on the 903 double-coded samples from the 2012 election cycle. The corresponding numbers for the samples of the 2014 election cycle are 89.0%, 89.8%, and 91.5%.
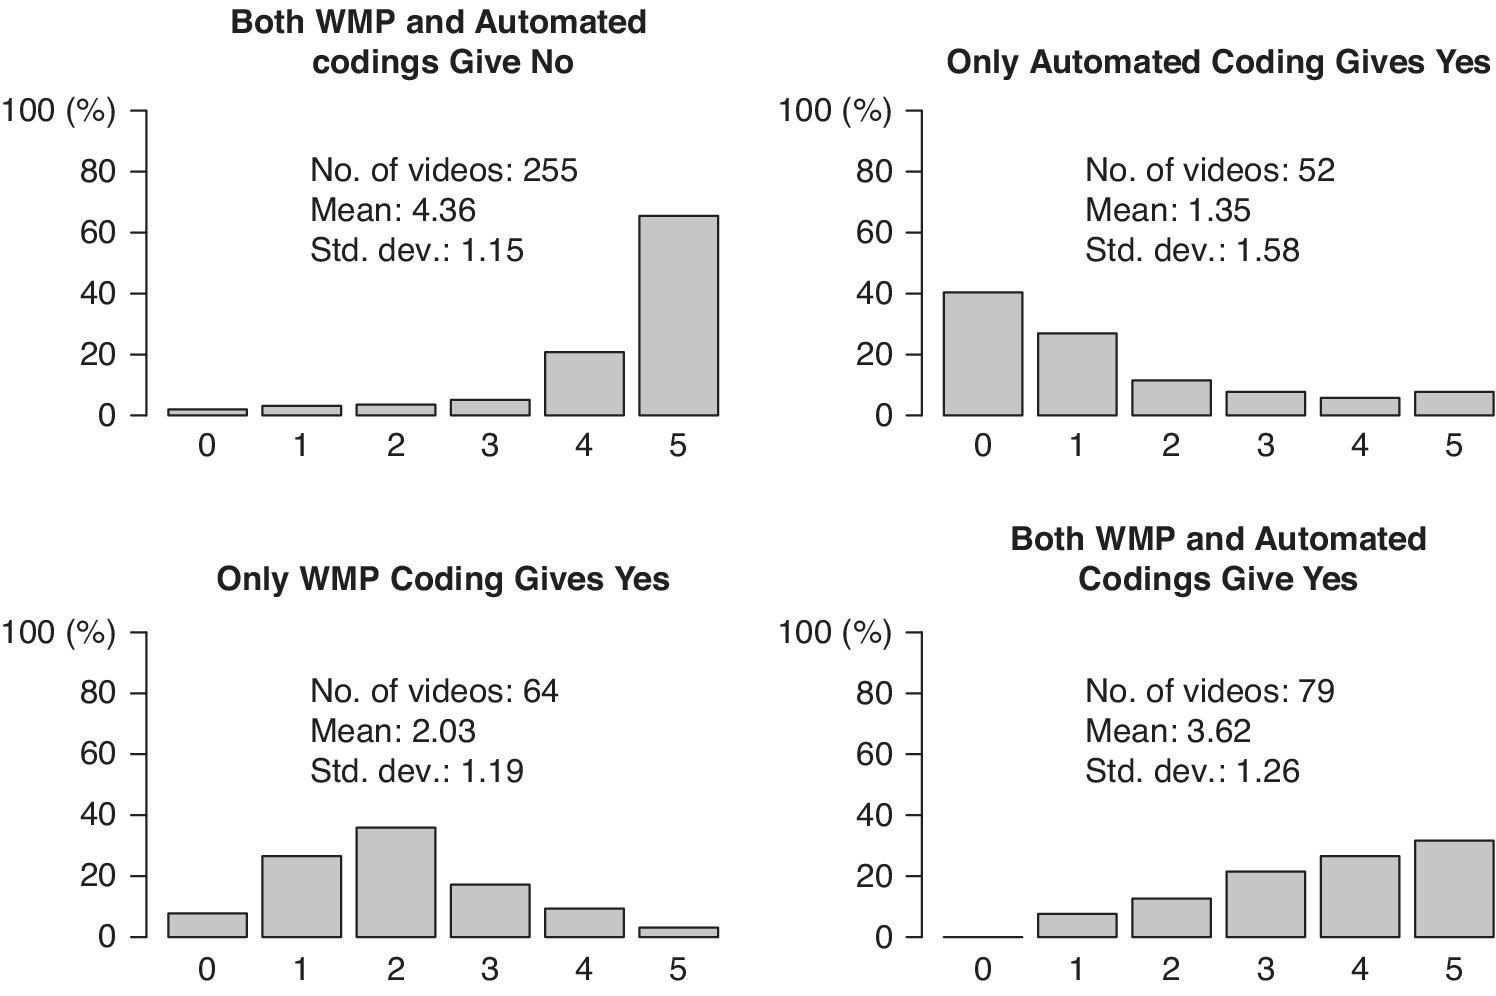
Given the inherent difficulty of establishing the ground truth for this variable, we use the Amazon Mechanical Turk as another source of coding. We assign five different MTurk coders with Masters qualification to each of the 450 videos included in the validation dataset and ask them to code whether the ad contains any of the three types of music. An example script along with instructions as seen by MTurkers can be found in Figure S10.6 in Appendix S10 of the Supplementary Material. Figure 8 shows the distribution of the number of MTurkers in agreement with the automated coding under the four patterns of agreement for the “ominous/tense” category (corresponding plots for the other two categories can be found in Figures S14.9 and S14.10 in Appendix S14 of the Supplementary Material). The figure suggests that the MTurkers are likely to agree when both the WMP and automated codings return the same result, although the responses are more evenly distributed for the cases where both codings give “Yes.” In the cases where the two codings disagree with each other, the MTurkers are more inclined to agree with the WMP coding, especially when only the WMP coding returns “No.” This suggests that the performance of the automated mood classifier may be falling short of the human standards for music mood classification.
Number of MTurkers who are in agreement with automated coding for ominous/tense music. Four cases are based on the agreement between the WMP and automated codings. The total number of MTurkers for each task is 5. The texts within each plot show the number of videos included in each sample as well as the mean and standard deviation of the number of MTurkers in agreement with the automated coding.

The underperformance of automated coding is expected given the difficulty of this task. When we aggregate the MTurk coder responses into a binary variable based on the majority opinion in each case, the rates of agreement with the WMP coding are about 86% across all three categories (see Table S14.5 in Appendix S14 of the Supplementary Material), which is slightly lower than the intercoder agreement rate reported by the WMP. This suggests that even human coders may struggle with this task.
4.5 Advertisement Negativity
As a final validation exercise, we classify the negativity of campaign ads with a pretrained classifier. Alternatively, one may classify negativity using a dictionary-based approach, such as the Lexicoder Sentiment Dictionary (Young and Soroka Reference Young and Soroka2012), which tend to have better generalization performance and may be better suited for classifying negativity in election cycles outside those studied in this paper. However, our results using Lexicoder Sentiment Dictionary (LSD), which are presented in Appendix S14.3 of the Supplementary Material, showed significantly worse performance than supervised learning, suggesting that our data may not be well suited to such an approach.
The WMP data contain two variables that are related to negativity. One classifies the tone of the advertisement as “positive,” “negative,” or “contrast.” This variable is provided by the CMAG and thus is not coded directly by the WMP. The other variable, which is coded by the WMP research team, classifies the purpose of the advertisement as “contrast,” “promote,” or “attack.” In this paper, we automate the former variable, which better conforms to a classical definition of sentiment analysis. We remove all ads labeled as “contrast” for simplicity, as they will have a mixture of both positive and negative contents. The remaining videos were assigned labels of
 $1$
if positive and
 $0$
if negative.
We examine five different models: Naive Bayes classifier, linear SVM, nonlinear SVM with radial basis function, k-nearest neighbors classifier (KNN), and random forest. For the inputs to these classifiers, we use three sets of features: the text feature as described in Section 3.2.2, music feature vector as described in Section 3.2.3, and a combined feature formed by concatenating the text and music features. In constructing the text feature, we consider both the word counts and the tf-idf feature.
We control for overfitting through feature selection based on the mutual information criterion, and we exclude all terms which appear only once in the data. We trained the five models on a random sample consisting of 80% of the WMP data entries and left the remaining 20% as the test set. The tuning parameters for each of the classifiers are optimized through fivefold cross-validation by maximizing accuracy score over a dense grid of values. For classifiers which rely on distance measures between samples for classification (SVM and KNN), we standardize the features prior to the training procedure.
Table 6 shows the proportion of agreements between the original WMP and automated codings for nonlinear SVM, which had the highest overall agreement among the three models used. Results for linear SVM, KNN, random forest, and naive Bayes classifier are found in Table S14.6 in Appendix S14 of the Supplementary Material. The results suggest that text features are effective for classifying ads into positive and negative ones, achieving an agreement rate of 84%, with more false positives than false negatives under all three features. As expected, music features are less effective, yielding only an agreement rate of 75%. Combining text features with music features does not significantly improve the performance of text features alone. We speculate that this is due to the fact that the music features we use are not designed specifically for detecting dark music often used for negative ads. Future research may consider new features that are targeted at this task. Nevertheless, the relatively high rates of agreement between the automated and human codings suggest that machine coding can be used to effectively classify positive and negative ads.
Comparison of the ad negativity variable between the WMP and automated codings using the nonlinear SVM. The value in each cell corresponds to the proportion of the four different combinations of results from the WMP and automated coding schemes. The three two-by-two matrices correspond to the three types of input data used to train the models. The overall accuracy is 84.12% (left), 74.88% (middle), and 84.12% (right). The results shown here are from the test dataset of size 422.

4.6 Impact on Downstream Analysis
Since the ultimate goal for automating the coding of political campaign advertisements is to provide scholars with an alternative data source for their own research, we examine the impact of using machine-generated data on subsequent analysis. Specifically, we replicate the study in Kaplan et al. (Reference Kaplan, Park and Ridout2006), which analyzes the different factors that lead to issue convergence in campaigns, using videos from the Senate elections in the 2012 and 2014 cycles. We compare the results between analysis using our automated data and the original WMP data. Our results, which are presented in Appendix S14.4 of the Supplementary Material, found no substantive differences under the two data sources, suggesting that our machine-coded data are a reliable alternative data source.
5 Concluding Remarks
We have shown that many of the human-coded variables from the WMP can be automatically coded by state-of-the-art machine learning methods without sacrificing significant accuracy. We believe that the use of automated coding will greatly improve the efficiency and scale of research on political advertisements. In particular, we hope that the methods used in this paper can shorten the time gap between an election cycle and the availability of high-quality data amenable to various content analysis. A similar machine learning approach can also be used in other areas of social science research as more video data become publicly available at YouTube and elsewhere on the Internet. Within political science, other potential applications include political speeches and TV debates.
Over the last two decades, the Wisconsin Advertisement Project (WAP) and WMP provided valuable resources for scholars who study political campaigns. As shown in this paper, these datasets also serve as ideal training and test datasets for researchers who wish to investigate the accuracy of cutting-edge machine learning methods. The performance of the automated coding algorithms in replicating the human-coded variables from the WAP and WMP varies from one task to another, and researchers can uniquely adapt the algorithms to maximize the quality of automated coding depending on their specific research agenda. For tasks that are difficult for both humans and machines, such as music mood classification, it might be necessary for the researchers to obtain a larger size of training data than is considered here. Future research should be mindful of the differences and limitations of machine coding in comparison to human coding.
Acknowledgments
We thank Dean Knox, Travis Ridout, and seminar participants at Harvard University for helpful comments and discussions. Imai thanks the National Science Foundation (SES-2148928) for partial support. We also thank Austin Colorite, Avner Goldstein, Allison Halter, Vilma Jimenez, Grace Rehaut, David Ribar, Tyler Simko, Rafael Tafur, and Shun Yamaya for their valuable research assistance.
Data Availability Statement
Replication materials can be found on Dataverse at: https://doi.org/10.7910/DVN/6SWKPR (Tarr, Imai, and Hwang Reference Tarr, Imai and Hwang2022). Open-source Python package campvideo is available for implementing the proposed methodology (https://github.com/atarr3/campvideo).
Supplementary Material
For supplementary material accompanying this paper, please visit https://doi.org/10.1017/pan.2022.26.