INTRODUCTION
Most of the Mediterranean Sea is oligotrophic (Minas & Bonin, Reference Minas, Bonin, Minas and Nival1988), and its hydrological regime has been extensively studied (Bethoux & Prieur, Reference Bethoux and Prieur1983). The water column is well stratified in summer, well mixed in winter, and transition periods of stratification occur during spring and late autumn–early winter. These changes in the hydrological regime are highly related to dynamics of phytoplankton communities (Rassoulzadegan, Reference Rassoulzadegan1979; Morel & Andre, Reference Morel and Andre1991). For decades, it has been demonstrated that the seasonal succession of phytoplankton communities were governed by a combination of physical, chemical and biological factors both in marine and freshwater ecosystems (Aleya, Reference Aleya1991; Reynolds, Reference Reynolds1997; Meiners et al., Reference Meiners, Gradinger, Fehling, Civitarese and Spindler2003). For example, the physical forcing has been shown to favour the quick development of opportunistic diatoms (Estrada et al., Reference Estrada, Varela, Salat, Cruzado and Arias1999; Gomez et al., Reference Gomez, Echevarrià, Garcia, Prieto, Ruiz, Reul, Jiménez-Gomez and Valera2000), which are of considerable importance for fisheries and carbon budget at higher scales (Claustre et al., Reference Claustre, Kerhervé, Marty, Prieur and Hecq1994). These diatoms which are generally large-sized develop within a well-structured herbivorous food chain favouring the transfer of energy to exploitable trophic levels, whereas dominance of small phytoplankton has been shown to favour the microbial food web (Sherr & Sherr, Reference Sherr and Sherr1988; Cushing, Reference Cushing1989; Elloumi et al., Reference Elloumi, Guermazi, Ayadi, Bouaïn and Aleya2008). The study on the seasonal succession of phytoplankton communities is therefore important to understand the main deterministic factors that govern the biological productivity of marine systems. In the Gulf of Gabès, which contributes 65% of the national fish production in Tunisia (CGP, 1996), these studies mainly dealt with the community structure of phytoplankton under the summer-stratified conditions (Bel Hassen et al., Reference Bel Hassen, Drira, Hamza, Ayadi, Akrout and Issaoui2008; Drira et al., Reference Drira, Hamza, Bel Hassen, Ayadi, Bouaïn and Aleya2008), while investigations on the seasonal variations of phytoplankton assemblages coupled with hydrodynamics and nutrient concentrations are totally lacking.
In this study, the seasonal succession of the microphytoplankton composition and diversity as well as their relationships to the hydrographic structure and the nutrient availability were investigated from 2005 and 2007 in the coastal and open sea areas of the Gulf of Gabès. It was hypothesized that microphytoplankton taxa should exhibit interspecific differences in their responses to both the hydrographic structures and ambient nutrients, which affect their ecological status, and that these differences might show a clear seasonal periodicity.
MATERIALS AND METHODS
Field sampling
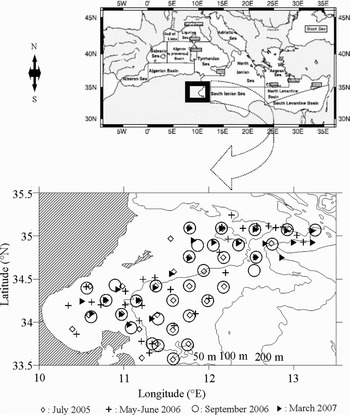
Samplings were carried out aboard the RV ‘Hannibal’. To examine spatial trends, water samples from 26 to 34 stations per cruise encompassing the continental shelf area between 20 m and 200 m in the Gulf of Gabès, Tunisia (eastern Mediterranean Sea, between 35°N and 33°N) were obtained in July 2005, May–June 2006, September 2006 and March 2007 (Figure 1). In each station, measurements of temperature, salinity, dissolved oxygen and sigma-t were collected with a conductivity–temperature–depth profiler (CTD: SBE 9, Sea-Bird Electronics, USA) equipped with a 12 l Niskin bottle rosette sampler lowered from the surface to the near bottom. Water samples for physico-chemical analyses and phytoplankton examination were collected from 3 depths (surface, middle of water column and near bottom) in costal stations less than 50 m in depth and from 5 depths (surface, –10 m, –20 m, thermocline and near bottom) in oceanic stations of which depth exceeded 50 m. Samples for nutrient analyses (120 ml) were preserved immediately upon collection (–20°C, in the dark), and those for phytoplankton enumeration (1 l) were preserved with Lugol (4%) iodine solution (Bourrelly, Reference Bourrelly1985) and stored in the dark at low temperature (4°C) until analysis. Water samples (2 l) for chlorophyll-a analysis were filtered by vacuum filtration onto Whatman GF/F glass fibre filter, and filters were then immediately stored at –20°C.
Geographical map focusing on the phytoplankton sampling stations in the Gulf of Gabès during the four cruises between 2005 and 2007.

Samples analysis
The pH was measured immediately after sampling using a Met Röhm® type pH meter. Nutrients (NO2−, NO3−, NH4+, PO43− and Si(OH)4) were analysed with a Bran and Luebbe type 3 autoanalyser. The concentrations of suspended matter were determined by measuring the dry weight of the residue after filtration of 1 l of seawater onto Whatman GF/C membrane filters. Chlorophyll-a analyses were performed by HPLC according to Pinckney et al. (Reference Pinckney, Richardson, Millie and Paerl2001), the analytical method was fully described in Bel Hassen et al. (Reference Bel Hassen, Drira, Hamza, Ayadi, Akrout and Issaoui2008).
Phytoplankton enumeration
Sub-samples (50 ml) were counted under an inverted microscope after settling for 24 to 48 hours using the Utermöhl method (Reference Utermöhl1958). The identification of algal taxa was achieved according to Tregouboff & Rose (Reference Tregouboff and Rose1957), Huber-Pestalozzi (Reference Huber-Pestalozzi1968), Dodge (Reference Dodge1985), Balech (Reference Balech1988) and Tomas et al. (Reference Tomas, Hasle, Steidinger, Syvertsen and Tangen1996). Biovolumes, which were calculated from microscopic measurements of length and width, and assuming simple geometrical shapes (Lohman, Reference Lohman1908; Hillebrand et al., Reference Hillebrand, Dürselen, Kirschtel, Pollingher and Zohary1999), were converted to carbon biomass with the conversion factors proposed by Menden-Deuer & Lessard (Reference Menden-Deuer and Lessard2000): 1 µm3 = 0.216 × 10⁻⁶ µgC, for all phytoplankton taxa except diatoms, and 1 µm3 = 0.288 × 10⁻⁶ µgC, for diatoms. The community structure was assessed by the Shannon & Weaner (Reference Shannon and Weaner1949) diversity index.
Statistical analysis
Pearson's rank-correlation was performed using XL-Stat software to determine, for each sampling period, the correlations between the different phytoplankton group abundance and the physico-chemical parameters.
The co-inertia analysis which is a direct extension of multiple regressions to the modelling of multivariate response matrix (Legendre & Legendre, Reference Legendre and Legendre1998) was performed to examine the correlation between an array of response variables (in this study the four sampled periods) and of independent explanatory variables (phytoplankton abundance) conditional to a third matrix (here physico-chemical parameters), keeping physico-chemical effect constant. The overall canonical relationship between data matrices was tested with a permutation test and the total variation was partitioned into variations due to different phytoplankton taxa, to physico-chemical variables and to the co-variation between the four sampling periods, following Peres-Neto et al. (Reference Peres-Neto, Legendre, Dray and Borcard2006). Computing and graphical displays were performed using R 2.4 (R-Development Core Team, 2006), the packages ade4 1.4.2 (Chessel et al., Reference Chessel, Dufour and Thioulouse2004) and vegan 1.8-3 (Oksanen et al., Reference Oksanen, Kindt, Legendre and O'Hara2006). In order to prepare the analysis, data matrices were explored using principal component analysis to picture the co-variations between the four sampled periods and between the phytoplankton data and the physico-chemical parameters.
RESULTS
Physico-chemical parameters
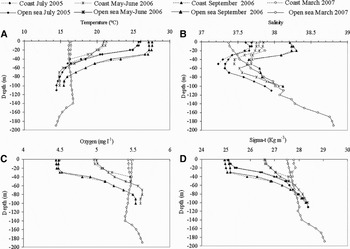
The vertical profiles from the mean values of temperature, salinity, sigma-t and dissolved oxygen, determined from coastal samples (less than 50 m, in depth) and mean open sea samples (more than 50 m, in depth), during the four sampled periods are given in Figure 2. The water temperature (Figure 2A) showed quite similar variations in both coastal and open sea samples during the entire survey period. The surface water temperature increased gradually from March to September. The start of stratification occurred in May–June with a thermocline establishing at 20 m in depth, but deepening into 25 m in July and even more than 30 m in September. The mean salinity profiles (Figure 2B) were similar in July and September, both in coastal and open sea samples, but they differed markedly in May–June and March. In May–June, water salinity at 20 m was higher in the coastal area than in the open sea but the reverse case was found in deeper water samples. During March, the water column was well-mixed and the salinity decreased with depth in the coastal area but increased in the open sea. During the four cruises, the concentrations of dissolved oxygen increased gradually from the surface to bottom layers in both coastal and oceanic areas (Figure 2C) Oxygen concentrations were low (<5 mg l−1) in the upper 50 m during September. The mean sigma-t profiles (Figure 2D) showed a slight difference between the coastal and oceanic areas only in May–June and March. Sigma-t profiles were strongly affected by temperature at the beginning of the water stratification in May–June (r =–0.747, P < 0.0001, df = 28), July (r = –0.825, P < 0.0001, df = 31) and September (r = –0.908, P < 0.0001, df = 32). However, sigma-t and salinity of coastal samples were significantly correlated (r = 0.965, P < 0.05, df = 24) under the well-mixed conditions in March. In the open sea, sigma-t correlated with both temperature (r = 0.416, P < 0.05, df = 24) and salinity (r = 0.967, P < 0.05, df = 24).
Average vertical distribution of water temperature (A), salinity (B), dissolved oxygen (C) and sigma-t (D) in coastal and open sea areas in the Gulf of Gabès between 2005 and 2007. (Dissolved oxygen during July 2005 was not shown in Fig. 2C.)

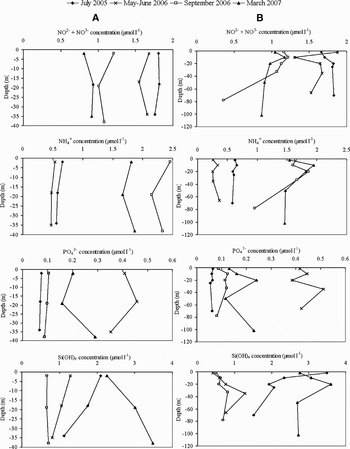
The chemical parameters analysed during this study are summarized in Figure 3. In the coastal area, the nutrient vertical distribution was quite homogeneous, while a slight decrease in concentrations occurred with depth in the open sea. The concentrations of NO3− + NO2− were more important during May–June and July than during September and March, whereas NH4+ concentrations exhibited a different trend. PO43-concentrations were low (0.15 µmol l−1) during the well-stratified conditions (July and September), but reached a maximum of 0.5 µmol l−1 during May–June. This translated into higher (>10) N/P ratios during stratification (upper 30 m) than during May–June (<10). The highest concentrations of Si(OH)4 were recorded during March and July (3.5 µmol l−1), and the lowest (<1.5 µmol l−1) during May–June and September. The Si:N:P ratio calculated in this study was higher in May–June and March than in July and September, not exceeding 0.25 (3.48:2.77:0.29). This value is very lower than the Si:N:P = 16:16:1 Redfield ratio.
Average vertical distribution of nutrient compounds (nitrite + nitrate, ammonium, ortho-phosphate, silicate, N:P and S:N:P ratios), chlorophyll-a, pH and suspended matter in coastal (A) and open sea (B) areas in the Gulf of Gabès between 2005 and 2007.

The mean concentrations of chlorophyll-a determined during the thermal stratification from both coast and open sea samples were < 200 ng l−1. They were high during May–June with a sub-surface chlorophyll maximum found up to 15 m in the coastal area, and a deep chlorophyll maximum DCM (500 ng l−1) found up to 40 m in the open sea area. The mean pH values were generally more alkaline in the coastal samples than in the open sea samples, suggesting a more pronounced photosynthetic activity along the coast. The mean concentrations of the suspended matter ranged around 10.8 mg l−1 (in the upper 20 m of the open sea, July 2005) to 102.6 mg l−1 (in the bottom of open sea, September 2006). Overall, the suspended matter showed a negative correlation with the concentrations of chlorophyll-a throughout the study period, except September in which the correlation between both parameters became positive (r = 0.326, P < 0.05, df = 32).
Phytoplankton population dynamics
A total of 173 taxa were identified throughout the study period. They consisted mainly of 120 Dinophyceae, 41 Bacillariophyceae and 8 Cyanobacteriae. Other groups such as Dictyochophyceae, Euglenophyceae, Coccolithophorideae and Chlorophyceae were poorly represented (one species each; Table 1).
List and frequency of the phytoplankton species observed between 2005 and 2007.

V, very abundant (30–100%); A, abundant (10–30%); C, common (5–10%); R, rare (1–5%); X, present occasionally (0–1); –, not detected.
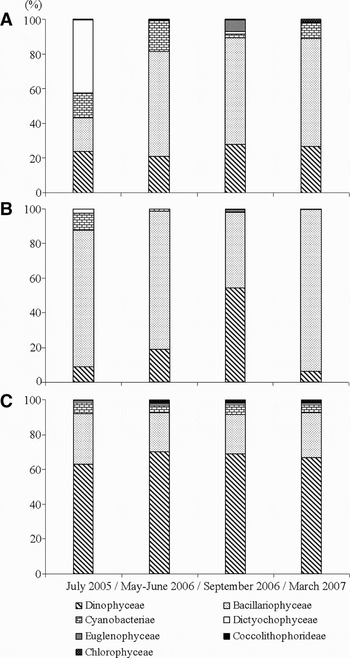
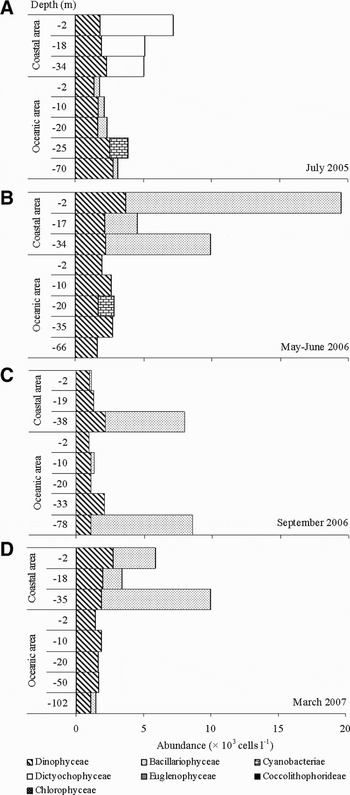
The phytoplankton abundance varied from 2 × 10³ to 21 × 103 cells l−1 (mean±SD = 6.5 × 10³±4.7 × 10³). The highest phytoplankton abundance (21 × 103 cells l−1) was recorded in May–June due to an important proliferation of Bacillariophyceae (19 × 103 cells l−1), with Guinardia delicatula contributing 43% of the phytoplankton total abundance (Table 1; Figures 4A, 5B). The Bacillariophyceae were the most important group in terms of abundance during the entire survey period (varied from 61% to 62% of to total phytoplankton abundances), except July (19%), in which Dictyochophyceae dominated the communities (41% of total phytoplankton abundance) (Figures 4A, 5A). We also found a highly significant correlation between the total phytoplankton abundance and diatoms throughout the sampling periods and especially in May–June 2006 (r = 0.970, P < 0.0001, df = 28) and March 2007 (r = 0.968, P < 0.0001, df = 28). The Dinophyceae were the second important group in terms of abundances accounting for 21% to 28% of total phytoplankton abundance, in May–June and September, respectively (Figure 4A).
Relative percentages of the different phytoplankton groups in terms of abundance (A), biomass (B) and taxonomic composition (C) in the Gulf of Gabès between 2005 and 2007.

Average vertical distribution of the different phytoplankton groups sampled in both coastal and open sea areas in the Gulf of Gabès between 2005 and 2007.

In terms of biomass, the mean values varied from 26.06 µgC l−1, in September to 2 × 10² µgC l−1, in July (mean±SD = 1.36 × 10²±0.81 × 10² µgC l−1). The Bacillariophyceae contributed 80% and 94% of the total phytoplankton biomass in May–June and March, respectively (Figure 4B). This was due to the large size of the dominant species that were present at this time, such as Guinardia delicatula (126±86 µm). In September, the abundances of Bacillariophyceae were high (61% of total phytoplankton abundance), while in terms of biomass, the Dinophyceae took advantage, representing 54% of the total phytoplankton biomass (Figure 4B). During this period, small-sized species such as Navicula sp. (25±13 µm), which represented 14% of the total phytoplankton abundance co-occurred with large Dinophyceae such as Polykrikos sp. (91±57 µm) and Ceratium furca (124±45 µm).
Dinophyceae contributed between 63% and 70% of total taxa number, whereas Bacillariophyceae represented between 22% and 29% (Figure 4C). Dinophyceae distributed throughout the water column in both coastal and open areas (Figure 5), and the dinocysts recorded during the four cruises, represented 5% to 12% of the total phytoplankton abundance. They were most abundant during the stratified period in July (12% of total phytoplankton abundance) (Table 1). Bacillariophyceae, when present, were also found throughout the water column, but they did not exhibit a clear trend in their vertical distribution (Figure 5). Cyanobacteriae were markedly present during May–June and July, probably favoured by the presence of a thermocline between 20 and 25 m. Dictyochophyceae appeared only in July 2005 and were represented by one species Dictyocha fibula (41% of total phytoplankton community) found along the coast and distributed throughout the entire water column. The other groups such as Euglenophyceae, Coccolithophorideae and Chlorophyceae presented low abundances throughout the water column and during the entire study period (Figures 4A, 5). Both phytoplankton abundances and biomass decreased along the coast–open sea gradient during May–June and March, whereas during the strong stratification that occurred in July and September, high values were recorded in both coastal and open sea areas (Figure 6). The highest phytoplankton abundances were recorded in the coastal area during May–June (10.58 × 10⁴ cells l−1), July (8.31 × 10⁴ cells l−1) and September (5.05 × 10⁴ cells l−1). In addition, both total phytoplankton abundances and biomass were correlated more strongly in the coastal than in the open sea area (Figure 6). A significant correlation was found between the phytoplankton abundance and biomass in the coastal area during May–June 2006 (r = 0.970, P < 0.05, df = 28). The diversity index did not show a clear distribution pattern from the coast to the open sea area, being homogeneous in mixing conditions (March), but variable as stratification established (Figure 6).
Phytoplankton abundance, biomass and diversity index along a coast–open sea gradient in the Gulf of Gabès between 2005 and 2007.

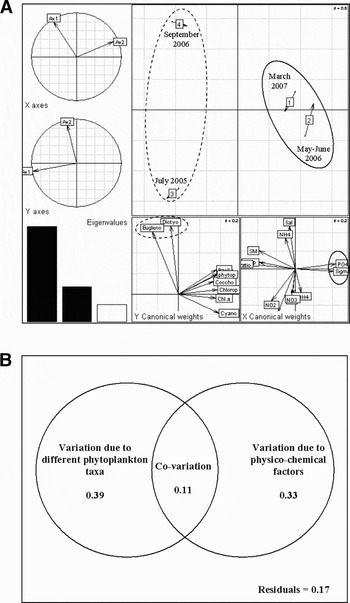
The co-inertia plot (Figure 7A) illustrates close relationships between the composition of phytoplankton communities and the abiotic characteristics of the water column during the four sampling periods. The overall model explained 83% of the total variation (permutation test, P = 0.25, 1000 replicates). This variation was due to microphytoplankton taxa (39%) and to physical and chemical variability (33%) (Figure 7B). The March and May–June sampling periods showed close links between sigma-t, phosphate concentrations and the phytoplankton composition which was illustrated by the position of Bacillariophyceae around the Y axis (Figure 7B). In contrast, during July and September, this component axis was surrounded by the numerically dominant Dictyochophyceae and Euglenophyceae.
Co-inertia plot for the biotic and abiotic parameters changes for the four sampling periods (A) and partition of the different phytoplankton taxa and physico-chemical factors (B).

DISCUSSION
Phytoplankton dynamics coupled to the physical and chemical variability
The investigated cruises were not continuous in time, the July cruise being conducted one year before the other spring–summer cruises. Nevertheless, the water physical characteristics were quite similar to those of the September cruise and, even more, they constituted a continuum in the spring–summer transition with an evident progression in stratification. The nitrogen availability in July was similar to that in May–June with a dominance of nitrate over ammonium concentrations. Moreover, in July the low phosphate concentration was similar to that in September. If it was assumed that the July cruise constituted the continuum between May–June and September, it could be inferred that phosphate was the first limiting nutrient factor in the Gulf of Gabès, as reflected by the high N/P ratio during the strong stratification in July and September. In addition, the maximum concentration of chlorophyll-a was recorded during the transition from the mixed to the stratified condition which characterized the May–June period. During this period, the concentrations of chlorophyll-a correlated positively with the concentrations of phosphate in both coastal and offshore areas (r = 0.798, P < 0.05, df = 28) and (r = 0.830, P < 0.05, df = 28), respectively, strengthening our thought that the phytoplankton biomass was closely dependent on this element during the productive period. These results support the assumption that P is the limiting element for phytoplankton growth in the Mediterranean summer, as was already suggested in the western (Berland et al., Reference Berland, Bonin and Maestrini1980; Thingstad et al., Reference Thingstad, Zweifel and Rassoulzadegan1998; Marty et al., Reference Marty, Chiaverini, Pizay and Avril2002) and eastern Mediterranean (Krom et al., Reference Krom, Brenner, Kress and Gordon1991). Furthermore, the potential resource limitation effect on phytoplankton growth was established in regard to the composition of diatomaceous organic matter. The accepted standard molar ratios between dissolved inorganic nitrogen, silicate and phosphorus for marine diatoms biomass is Si:N:P = 16:16:1, when nutrient levels are sufficient (Redfield et al., Reference Redfield, Ketchum, Richards and Hill1963).
The deep chlorophyll maximum (DCM) observed during May–June at a depth almost of 40 m in the offshore area, was associated with nitrate and phosphate as well as with the prevalence of dinoflagellates (Figure 3). This suggests that this group could be as opportunistic as diatoms as far as taking advantage of nutrient availability is concerned. At this particular water depth, the dinoflagellate assemblages consisted of high numbers of Peridinium, Karlodinium and Gyrodinium. These genera have been reported to occur under high phosphate availability (Satsmadjis & Friligos, Reference Satsmadjis and Frigilos1983; Costas & Lopez-Rodas, Reference Costas and Lopez-Rodas1991). Moreover, Gyrodinium and Gymnodinium appeared while phosphate concentrations were high and nitrogen resources were reduced in the Gulf of Tunis (Daly-Yahia et al., Reference Daly-Yahia Kéfi, Souissi, Gomez and Daly Yahia2005), suggesting that the proliferation of dinoflagellates at the DCM was mainly phosphate-driven.
During our survey, diatoms occurred during the water mixing and preferentially during semi-mixing mainly in the coastal areas. Other studies reported that most diatom blooms were confined to the period of transition between mixed and stratified conditions, offering the best compromise between light and nutrient availability (Claustre et al., Reference Claustre, Kerhervé, Marty, Prieur and Hecq1994; Bustillos-Guzman et al., Reference Bustillos-Guzman, Claustre and Marty1995). This feature was also described during the beginning of the water stabilization which occurred between late winter and early spring in various marine ecosystems, and associated with the prevalence of diatoms (Margalef & Castellvi, Reference Margalef and Castellvi1967; Lévy et al., Reference Lévy, Mémery and André1998). However, during the hydrological transition period, a scarcity of diatoms was found mainly at the DCM in the offshore compartment (Figure 5). This finding may be explained by the low silicate concentrations (Figure 3), which fell below the reported half-saturation value for silicate incorporation by diatoms: Km = 1 to 5 µmol l−1 (Fisher et al., Reference Fisher, Harding, Stanley and Ward1988). Cyanobacteriae were markedly present during May–June and July, probably favoured by the presence of a thermocline between 20 and 25 m (Figure 5A, B). Indeed, numerous records of the presence of cyanobacteriae under the stratified conditions have already been reported in the open ocean (Neveux et al., Reference Neveux, Vaulot, Courties and Fukai1989; Campbell & Vaulot, Reference Campbell and Vaulot1993; Claustre & Marty, Reference Claustre and Marty1995; Jacquet et al., Reference Jacquet, Lennon, Marie and Vaulot1998). Furthermore, a preferential occurrence of cyanobacteriae under the semi-mixed conditions was also reported in a coastal north-western Mediterranean site (Bustillos-Guzman et al., Reference Bustillos-Guzman, Claustre and Marty1995; Marty et al., Reference Marty, Chiaverini, Pizay and Avril2002).
Vertical and horizontal phytoplankton distributions
In this study, the striking feature in the seasonal distribution of the identified phytoplankton was the persistence of dinoflagellates in high numbers throughout the sampled depths, either in coastal or offshore areas (Figures 4, 5). This finding revealed that this group proved to be remarkably ubiquitous and may adapt to a large range of hydrographic features. In particular, the continuum of dinoflagellates may be explained by the motility of the cells allowing them to explore different depth layers. The ubiquity of flagellates (including dinoflagellates) with regards to depth was already reported in the eastern Alboran Sea (Claustre et al., Reference Claustre, Kerhervé, Marty, Prieur and Hecq1994) and in the Gulf of Gabès (Bel Hassen et al., Reference Bel Hassen, Drira, Hamza, Ayadi, Akrout and Issaoui2008). In contrast to ubiquitous dinoflagellates, cyanobacteriae were confined to the thermocline in the offshore area (Figure 5A, B). In fact, the recorded species were generally large colony-forming prokaryotes such as the filamentous Anabaena and Peusodoanabaena, which were able to overcome sedimentation losses under stratified conditions. Furthermore, their presence at this particular depth (–25 m) was associated with high nitrate concentrations (Figure 3) (r = 0.312, P < 0.05, df = 31). The results indicated that nutrients played an important role in governing their vertical distribution.
Both abundance and biomass of the phytoplankton showed a decrease along the coast–offshore gradient during March (mixed water) and May–June (start of stratification) in the coastal area. This was mainly due to the high contribution of large cell-sized diatoms in terms of biomass, in the coastal area (Figures 4, 5). Conversely, the important biomass obtained in the offshore over-stratification was associated with the presence of small-sized phytoplankton such as Navicula sp. (25±13 µm). Earlier studies have reported that phytoplankton in the open ocean was dominated by small-celled plankton (i.e. flagellates), whereas, coastal and productive areas were dominated by large cells such as diatoms (Malone, Reference Malone1971). Recently HPLC analyses have demonstrated that the assemblages of nano- and pico-planktonic phytoplankton, namely chlorophytes and prasinophytes, were the major contributors of the total of autotrophic biomass during July 2005 in the Gulf of Gabès (Bel Hassen et al., Reference Bel Hassen, Drira, Hamza, Ayadi, Akrout and Issaoui2008).
Furthermore, the increase in the concentrations of the suspended matter was positively related to chlorophyll-a in the offshore area during the September stratification (r = 0.326, P < 0.05, df = 32). This determined that the sampled particulate matter might have contained a high fraction of organic detritus, which originated probably from grazer's metabolism. This suggestion was reinforced by the elevated ammonium concentrations (Figure 3), which associated with minimum dissolved oxygen (Figure 2C). This was more likely due to the degradation of organic matter by the microbial organisms which released ammonium (Kirchman et al., Reference Kirchman, Keil and Wheeler1989). These observations were in agreement with the model proposed by Fogg (Reference Fogg1991), in which the biomass control in the small-sized phytoplankton is carried out by grazers and more likely by the microbial loop.
Inter-annual variability of the phytoplankton composition
The co-inertia analysis was highly informative in this study because it clearly showed that in spite of the similarity found between the hydrological features (thermal stratification and water physical characteristics) in July and September, the phytoplankton community was dominated by Dictyochophyceae in July, and Euglenophyceae in September (Figure 7A). These discrepancies between the two sampled periods appeared mainly in the coastal area and were attributed to the proliferation of the species Dictyocha fibula, which accounted for 41% of the total phytoplankton abundance in July. This species was also reported in several coastal ecosystems, such as the Ville-Franche Bay (Gomez & Gorsky, Reference Gomez and Gorsky2003), the Mersin Bay (Eker & Kideys, Reference Eker and Kideys2000), the Mexican Pacific coasts (Hernandez-Becerril & Brovo-Sierra, Reference Hernandez-Becerril and Bravo-Sierra2001) and the North Pacific (Onodera & Takahashi, Reference Onodera and Takahashi2005), where this species co-occurred with D. californica. The proliferation of Dictyochophyceae was described to be temperature-dependent (Gomez & Gorsky, Reference Gomez and Gorsky2003). However, in our study, the difference in the coastal surface temperature between September and July averaged only 1°C (Figure 2A), and thus was not high enough to help explain our findings. Therefore, it might be inferred that the coastal zone was more subjected to external forcing.
CONCLUSION
This study demonstrates that the hydrographic structures (from mixing to complete stratification) were associated with the spatial and temporal variations of the microphytoplankton communities in the Gulf of Gabès. Diatoms proliferated mainly under the semi-mixed conditions, and seemed to be governed by the silicate availability in the offshore area. Cyanobacteriae occurred preferentially under the semi-mixed conditions during the establishment of thermocline. Dinoflagellates appeared to be the most stable group in terms of abundance, being able to adapt to a wide range of hydrographical features.
ACKNOWLEDGEMENTS
This work was supported by the Tunisian funded project POEMM (LR02INSTM04), which was conducted in the National Institute of Marine Sciences and Technologies (INSTM) and Plankton and Microbiology of Aquatic Ecosystems Research Unit of the University of Sfax. The authors wish to thank the crew of the RV ‘Hannibal’ for their assistance. This study was conducted within the framework of the PhD of Z.D. (University of Franche-Comté: France–University of Sfax: Tunisia).