


Introduction
Sea ice in marginal ice zones is of particular climatic interest due to its high variability and potential early susceptibility to manifestations of climate change. This work describes use of a simple model to study variability in the marginal ice zone south of 75°N off eastern Canada. The studied regions (Baffin Bay, Davis Strait and Labrador Sea) have been climatically anomalous for several decades, showing changes approximately out of phase with contemporary global and overall Arctic variations. In addition, recent regional trends toward lower winter temperatures and larger ice extents have been contrary to expectations from most general circulation model (GGM) simulations of increased atmospheric greenhouse-gas content (Reference WalshWalsh, 1993; Reference Marko, Fissel, Wadhams, Kelly and BrownMarko and others. 1994a). Insights were sought on the relative importance of atmospheric and oceanographic variability, respectively, in controlling observed linkages among mid-winter ice extents in Davis Strait, spring ice extents off Labrador and Newfoundland and annual numbers of icebergs reaching 48°N (Reference Marko, Fissel, Wadhams, Kelly and BrownMarko and others, 1994a). At issue is the degree to which advection from areas far upstream determines spring ice extents south of 55°N as opposed to growth south of 60°N, as assumed by Reference Ikeda, Yao and SymondsIkeda and others (1988). Our approach compared ice volumes observed during three winter early-spring seasons with simulation results obtained using a box model driven by surface air temperature and wind data. This treatment ignored year-to-year variations in the ocean currents and heat fluxes, thereby offering indirect measures of the importance of such variations by comparisons with observations.
Description of the Box Model
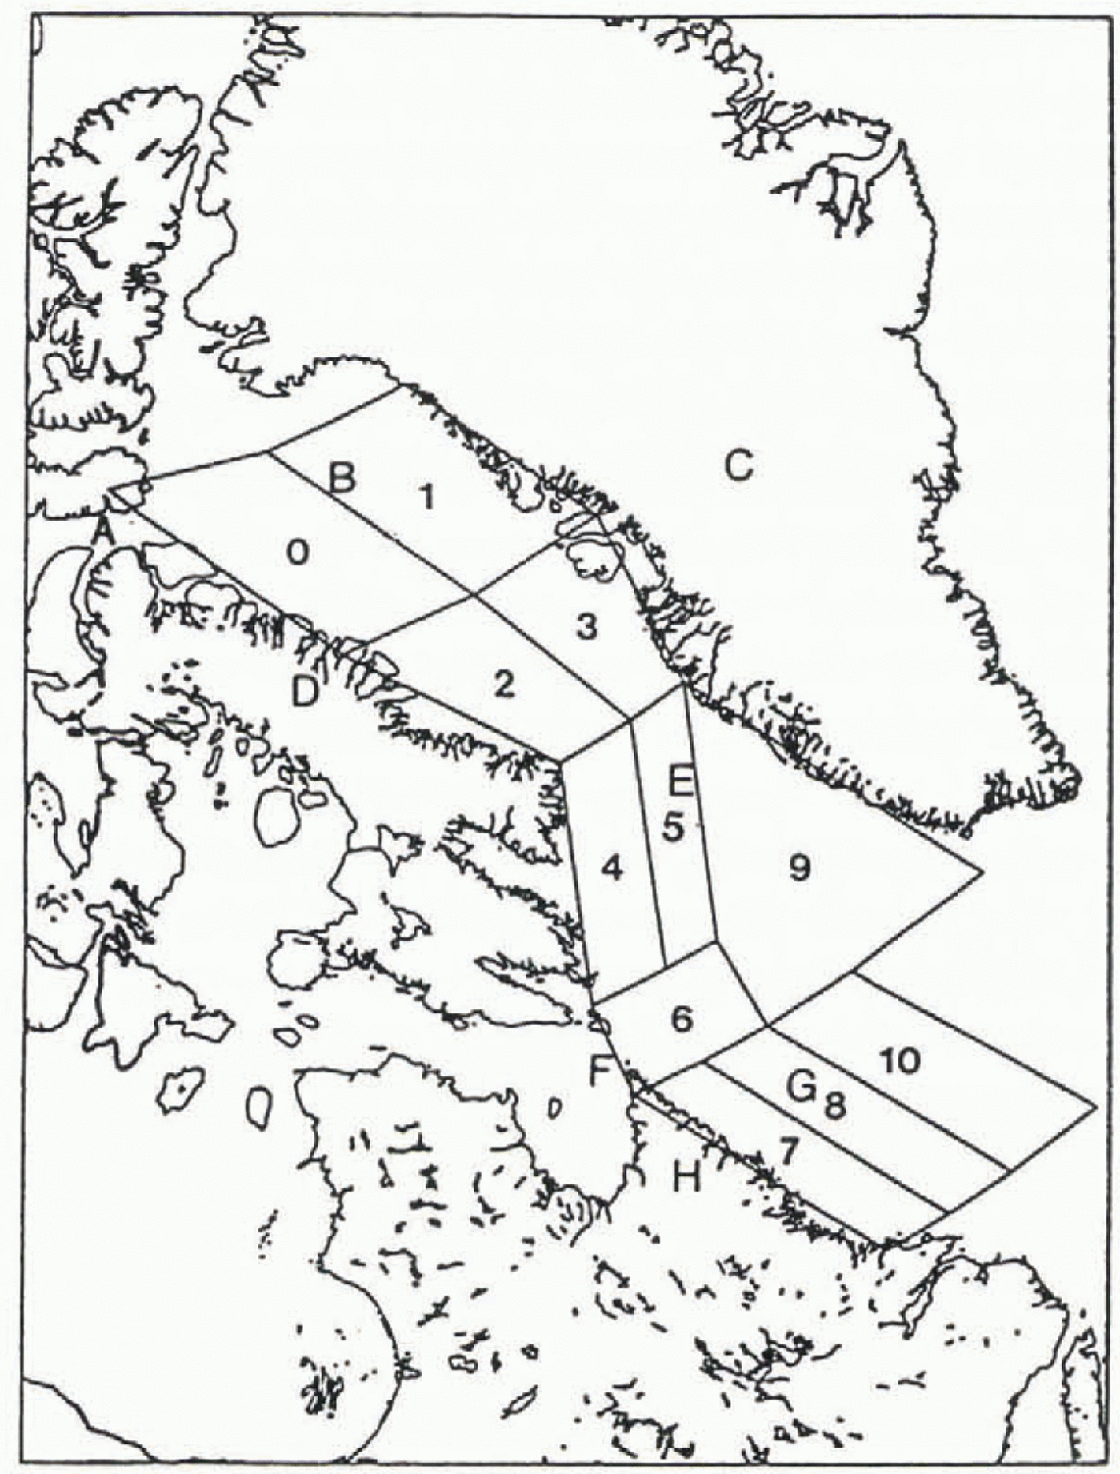
The box model utilized a subdivision of the 55°N-75°N study region into 11 zones (Fig. 1) with boundaries selected to simplify representation of ice transport and classification into bathymetric categories, which tend to define local oceanographic and sea-ice properties (Reference Fissel and TangFissel and Tang, 1991). Thus, for example, zones 4 and 7 are representative of shallow continental-shelf areas, while adjacent, more eastern, zones contain both narrow continental slopes associated with the strong southerly Baffin and Labrador currents and the deep Labrador Basin and its weak current regime. Other zones in Baffin Bay and adjacent to Hudson Strait contain more diverse mixtures of bathymetrics. Model forcing characterizations were chosen to be consistent with both physical understandings and empirical linkages to accessible atmospheric variables. Sources of inter-annual variability were confined to observed ice conditions at external model boundaries and to air temperature and geos trophic wind fields. Impacts of unmodelled parameter variations were examined by sensitivity testing.
Model domain showing the 11 defined zones and her geographic features including: Lancaster Sound (A); Baffin Bay (B); Greenland (C); Baffin Island (D); Davis Strait (E); Hudson Strait (F); the Labrador Sea (G); and Labrador (H).
Ice volume (km3) in the mth zone, Vm , was computed as the sum of products of areal coverages, Am, n and average thicknesses, hm, n over seven ice categories:
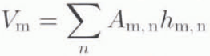
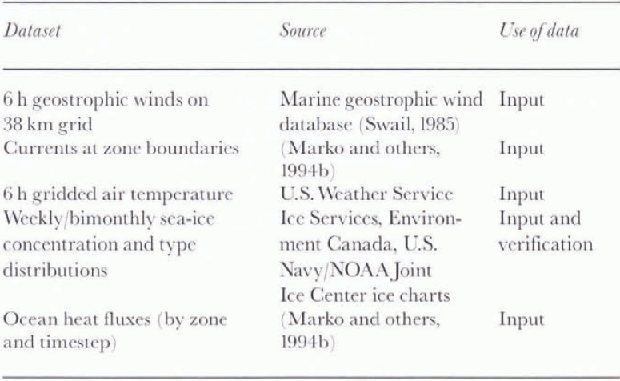
where the summation over n denotes ice in the following thickness ranges: (0) <1cm; (1) >1cm, ≥10cm; (2) >10cm. <30cm; (3) ≥30cm, <70cm ; (4) ≥70cm, 120cm; (5) ≥120 cm. <200 cm and (6) ≥200cm. Simulations were carried out at 10 day time intervals between 1 November and 28 April. Advective and growth contributions were computed for each interval from 6h wind and air temperature data, basic details of the datasets are listed in Table 1.
Sources of data and information for model simulations and verifications
Model simulations were initiated in each zone in the first 10 day time-step associated with charted local ice presence. Ice in each category was assumed to change its thickness, hi , in the presence of a snow layer of thickness. hs , through a modified version of the Reference Jacobs, Barry and WeaverJacobs and Others (1975) differential ice-growth equation:

with ki , and ks representing ice and snow thermal conductivities, and Ts and Tf denoting the temperatures of the snow surface and sea-water freezing. Other notation includes: ρi for the density of sea ice; Lf for the latent heat of fusion; and Fw for the ocean heat flux. Ts was set equal to the air temperature (Ta ) allowing us to relate Tf – Ts and, hence, dh/dt, directly to the cumulative freezing day parameter (Reference BilelloBilello, 1980). Snow thickness was assumed to be 4cm, and values for ki were computed and expressed as a function of ice salinity (represented by linear relationships to ice thickness) and mean ice temperatures, by the relationship (Reference UntersteinerUntersteiner, 1961):
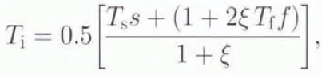
where ξ = 1.38 (Reference Brown and CotéBrown and Coté, 1992). In addition to growth, ice volumes also changed by the net sums of volume fluxes across the boundaries of each zone. Initially, unrestricted and uncompressed (u) transfers of type n ice area across the Sth model boundary in the time interval t to t + ∆t were expressed as:

where υ(s,t) is the velocity of ice perpendicular to the boundary s at time t; L(s) is the length of the boundary; and ϕ(n, z’,s,t) is the concentration of ice type n in zone z’ located on the other side of the boundary s at time t. Corresponding volume transfers were written as:

with h(n, z’,s,t) denoting the thickness of ice type n in zone z’. Values of ϕ(n, z’,s,t), were obtained from previous time-step simulations, except in areas external to the model region where local ice-chart concentrations were used. No advection was allowed across the eastern boundaries of zones 9 and 10.
Total areas and volumes were computed for each zone and time-step by updating ice thicknesses through Equation 2 and use of Equations (4) and (5). The resulting unrestricted ice areas and volumes in each /one were then tested against constraints that precluded overfilling by one or more ice types and/or discharges of volumes larger than those of the same ice type that were either initially present or capable of growing within the zone during the time-step. Over-filling was avoided by Subsequent compression of areal extent using an inverse relationship between ice thickness and compressibility. The maximum allowable compressions in base case simulations were: 1.00, 0.7, 0.4, 0.2, 0.1, 0.05 and 0.01 for thickness categories 0–6, respectively. The second constraint was effected by the proportionate scaling down of export velocities. In both cases, ice motions were iteratively recomputed for all zones to assure mutual compatibility of individual zone adjustments.
Model ice-velocity inputs, v(s, t), were derived as linear functions of complex wind (W) and surface current (c) vectors satisfying:

where R = Reθi is a wind-response function. Previous similar ice-velocity formulations (Reference Ikeda, Yao and SymondsIkeda and others, 1988) have utilized currents, c, representative of long-term means in conjunction with regression- or drag coefficient-based representations of wind forcing. Velocity overestimation arising from the tendency for this approach to double count wind influence (Reference Marko, Fissel and HallerMarko and others, 1994b) was minimized by equating c to scaled-down (by a factor of 0.5) long-term mean currents and the use of R and θ values (0.015 and +10°, respectively) in accord with Labrador drift data. Additional comparisons with Baffin Bayand Lancaster Sound satellite-image and beacon data established smaller (0.009)R values and similar 10 turning angles. In the absence of adequate data from areas between Baffin Bay and Labrador, 10 turning angles and an intermediate R value (10.012) were assumed for zones 4–6 and 9. Values of c were adjusted to assure zero current convergences in all zones, and to make the modelled ice velocities, averaged over the studied years, compatible with established mean ice-drift data. Significant deviations from historical averages were introduced only at the northern boundaries of zones 1 and 3 in eastern Baffin Ray, where northerly currents were initially anticipated in accordance with the northward local segment of the West Greenland Current. However, this assumption was incompatible with Equation (6), observed winds and southward local ice drift. Additionally, direct observations in zone 3 in December 1989 (Reference Marko, Fissel and HallerMarko and others, 1994b) showed several days of southward acceleration in a drift beacon traversing the continental slope locus of the West Greenland Current. This behaviour, and subsequent beacon deceleration upon entry into adjacent continental shelf waters, were neither explicable in terms of local winds nor observed in a more westerly beacon which was simultaneously mov ing southward at similar latitudes. In the absence of further evidence for the implied presence of a current reversal, c was set to zero at the two identified boundaries.
Our treatment of ice growth was also updated to represent the influence of large ocean heat fluxes characteristic of the region’s continental slopes. These fluxes have been estimated by Reference Prinsenberg, Peterson and FowlerPrinsenberg and others (1991) to supply thermal energy at a time-averaged rate of 135 Wm−2 and occasionally at rates as large as 700 Wm −2. Reference Ikeda, Yao and SymondsIkeda and others (1988) assumed a bathymetrically independent regional flux of 35 W m for areas south of 60° N over the December February period with subsequent reductions to zero to reflect the total (end of winter) depletion of mixed-layer heal content subsequently confirmed by fresh measurements (Reference Fissel, Lacy, Pierlot and ByrneFissel and others, 1988, Reference Fissel, Pierlot and Byrne1989; Reference Prinsenberg, Peterson and FowlerPrinsenberg and others, 1991). Water-column data suggesting that total heat losses in Baffin Island shelf areas were about one order of magnitude lower than Labrador Shelf values motivated separate definitions of shelf fluxes for northern (zones 0–5) and southern zones zones G-10). Northern fluxes were initially 20 Wm−2 on 1 November and declined linearly to 0 by 1 March. Slightly lower (13 Wm−2), initial fluxes in the southern zones were assumed to persist without decline until 1 April when they were set to zero. Basin heat fluxes were held constant at values of 10Wm −2 and 30 W m−2 for zones 0–3 and 4–10, respectively, to reflect the decreasing influence of warm deep water north of Davis Strait. Finally, constant fluxes of 15 Wm −2 and 300 W m −2 were assumed for slope areas in each of the latter two zone groupings in accordance with a similar northerly decrease in offshore water heat content. Use of a 300 W m−2 flux for southern slope areas instead of the lower Reference Prinsenberg, Peterson and FowlerPrinsenberg and others (1991) estimate neglects the latter underlying restriction of intense heat exchanges to (33% seasonally probable) storm passages in light of the presented evidence for large slope fluxes during both onshore and offshore ice movements. Heat fluxes for each zone were represented as area-weighted sums of bathymetric specific fluxes.
Results
Simulations were carried out for the above-specified “base case” parameter settings and for three sensitivity tests that, alternatively: (1) removed the snow layer; (2) raised the zone 7 and 8 shelf region ocean heat fluxes to 60W m−2; and (3) increased the allowable compression in the five thickest ice categories (to 0.5, 0.35, 0.25, 0.17 and 0.12). Model outputs of areal and volume compositions by ice type and zone, and ice displacements by zones, were compiled for all time-steps. Detailed zone- and regionally averaged-results were compared with ice-chart derived data. Unfortunately, while time-dependent, average thicknesses for each ice type were simulated, observational thickness data were available only within the uncertainties of charted ice categories, limiting volume-verification data to sums of products of areal coverages with corresponding median category ice thicknesses. This difficulty, while inhibiting detailed model verifications, did not preclude explorations of inter-annual variability.
Simulations were carried out for the 1984–85, 1987–88 and 1989–90 ice seasons chosen, originally, to facilitate independent extraction of ice velocities from archived satellite imagery. Unfortunately, the available image data were still insufficient to document adequately velocity variability, and, in retrospect, our study might have benefited from use of earlier ice seasons characterized by greater ice-volume contrasts. Both the 1984–85 and 1989–90 seasons were associated With high winter and spring ice extents in Davis Strait and south of 55°N (Reference Marko, Fissel and HallerMarko and others, 1994b). Seasonal 1987–88 areal extents were low in the same regions, although the corresponding ice volumes, particularly in the belter-documented late-season months, exceeded those of 1981–85 while falling well below 1989–90 levels. These differences were consistent with the 1989–90 winter being the coldest of the studied seasons, having approximately 50% higher freezing degree-day totals. The anomalous reversal of the 1981–85 and 1987–88 ranks in the alternative area and volume comparisons may be related to the coincidence (in 1984–85), of greater wind-driven forcing in southern areas and exceptionally cold and warm conditions during December and January, respectively. The latter reversal of seasonal temperature trends facilitated early development of an extensive ice cover, but reduced subsequent thickening.
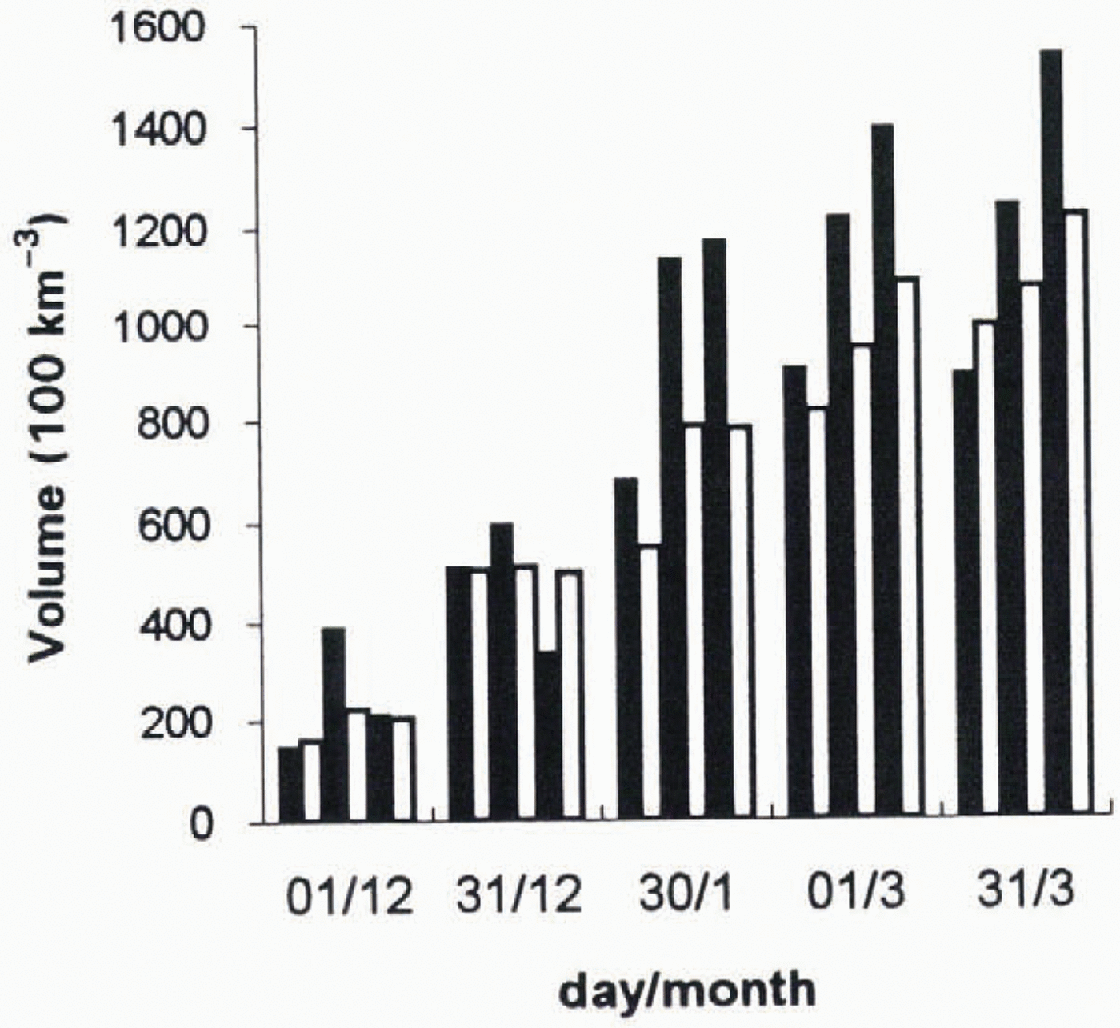
Our chief interests in the simulations were focused on individual zone and larger scale ice-volume results and, particularly, on results obtained at monthly intervals from late January through March. The latter emphasis reflects both the role of midwinter Davis Strait ice conditions as a climate index (Reference Marko, Fissel, Wadhams, Kelly and BrownMarko and others, 1994a) and interest in the ice that normally drifts into the commercially important areas south of 55°N during the spring and early summer. Additionally, this emphasis enhances comparison robustness by minimizing uncertainties arising from additional deficiencies of ice data available for November and December when thinner ice-type categories are heavily populated. This situation is evident in the consistency of the year-to-year variations plotted in Figure 2 for both the observed and simulated total regional ice volumes at the ends of the months of January through March. The more erratic November December plotted results reflect uncertainties introduced by early season observational limitations and rapid changes not accommodated by our models. The January March results Suggest the box model lends to underestimate ice volume by roughly 20%. Given the observational and model parameter uncertainties, these results are indicative of reasonable model representivity. Capabilities for anticipating relative annual ice volumes were, again, particularly apparent for the January-March period, with a single erroneous predict ion showing equal 1987–88 and 1989–90 January ice volumes instead of a 3% differential.
Comparisons of observed and base case simulated total ice volumes (in km 3) in the modelled region at the indicated date times. For each date, three adjacent pairs of filled (solid) and open bars denote the observed and modelled ice volumes, respectively, for (left to right) the 1984–85, 1987–88 and 1989–90 seasons.
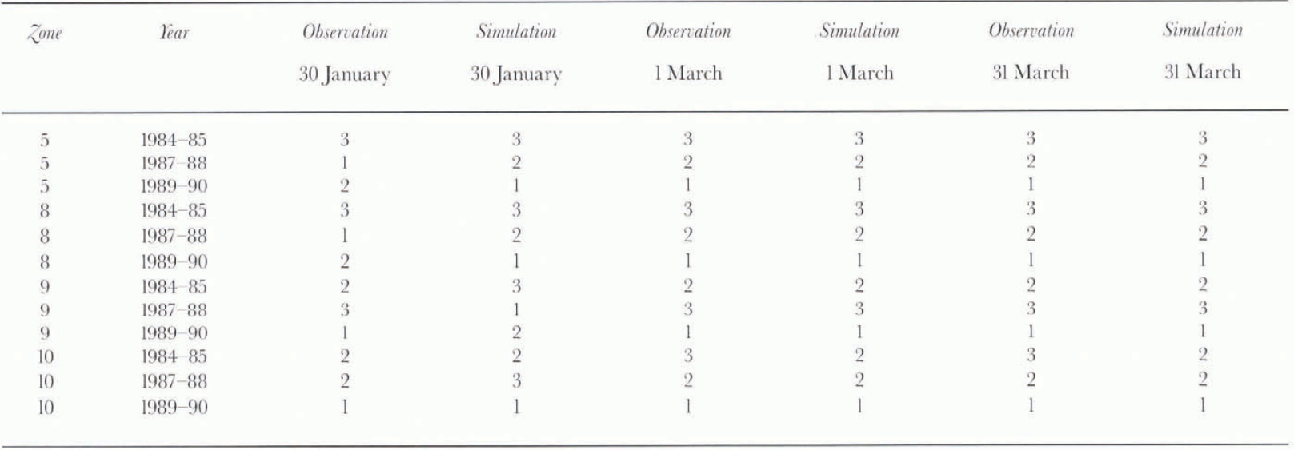
More detailed review of comparison data revealed that the tendency of the simulations to underestimate ice volumes was most pronounced in eastern study zones. Difficulties were particularly apparent in Baffin Bay zones 1 and 3, where, at times, as late as the end of February, simulated volumes were 30–50% below observed values. Deviations from observations in more southerly eastern zones were less consistent, with both overestimation and underestimation noted in zones 9 and 10 that typically contain the thinnest and potentially most short-lived regional ice. Since major contributions to regional ice-volume variability arise from zones 5, 8, 9 and 10 usually enclosing the winter outer pack-ice edge, simulated and observed ice volumes for each of these zones were used to generate rankings of the respective annual ice volumes at monthly January March interv als (Table 2). Inspection indicates that only 10 out of the 36 possible comparisons of simulated and observed zone/time period rankings were erroneous, with all but two of the ranking errors occurring in the earliest (30 January) results. The two other errors were associated with simulations of unequal, but non-vanishing volumes, in observationally ice-free zone 10 waters on 1 March and 31 March in 1984−85 and 1987−88.These results suggest that, at least after 30January, the simulations qualitatively reproduce annual ice-volume trends in the highest variability Davis Strait and Labrador Sea zones. The much poorer correspondences attained for times prior to February are consistent with the noted deficiencies of early season observational data.
Rankings of observed and simulated ice volumes in zones 5, 8, 9 and 10 at approximately monthly January-March intervals (largest (lowest) ice volumes denoted by 1(3))
Our simulations showed relatively little sensitivity to increased ice compressibility in the thicker and intermediate thickness categories, with such increases having maximum impact in the later periods and western model zones generally associated with thicker ice. The largest changes corresponded to 10% volume increases, but, on average, the overall regional effect was to increase ice volume by about 5%. The effects of thermodynamic changes, i.e. removal of the snow layer and increased Labrador Shelf heat fluxes were more substantial, particularly in early season periods and in the westernmost Labrador zone 7. Typical early season impacts of snow removal were to increase ice volumes by 50% or more, but by late March, overall ice volume increases were on the order of 10–15%. These results suggest that apparent model underestimation of zone 1 and 3 ice volumes may be partly attributable to the thinning of local snow cover by the higher rates of fracturing and lead generation characteristic of areas close to eastern pack-ice edges. The impacts of larger Labrador heal Iluxes were confined to earlier portions of the local ice season and to the year (1984–85) with the lowest local ice volumes. Focusing on the February and March results most relevant to impacts south of 55 °N, the maximum effect of larger shelf heat fluxes was a 30% decrease in the zone 7 ice volume, leaving the ice conditions in the adjacent, higher variability, zone 8 largely unaffected.
To quantify the importance of ice movement, additional simulations were carried out using base case model assumptions, but with artificial cutoffs of ice fluxes at, alternatively: (1) the external model boundaries in northern Baffin Bay and Lancaster Sound; (2) the northern boundaries of Davis Strait zones 4 and 5; and (3) the northern boundaries of Labrador zones 7, 8 and 10. Such simulations showed impacts that decreased with downstream distance, and as an inverse function of cutoff latitude. Effects were most pronounced in western zones containing slope areas associated with maximal ice velocities. Impacts of the most northerly cutoff (1) were largest in zone 0, corresponding to 22–35% eductions in early December volumes and 50% reductions by the end of March. Smaller decreases in zone 2 reflected enhanced ice replacement by growth during additional southerly drift. In the Davis Strait zone 4, the effects of cutoff (1) did not exceed 15–20%, with reductions >10% confined to times later than mid January.
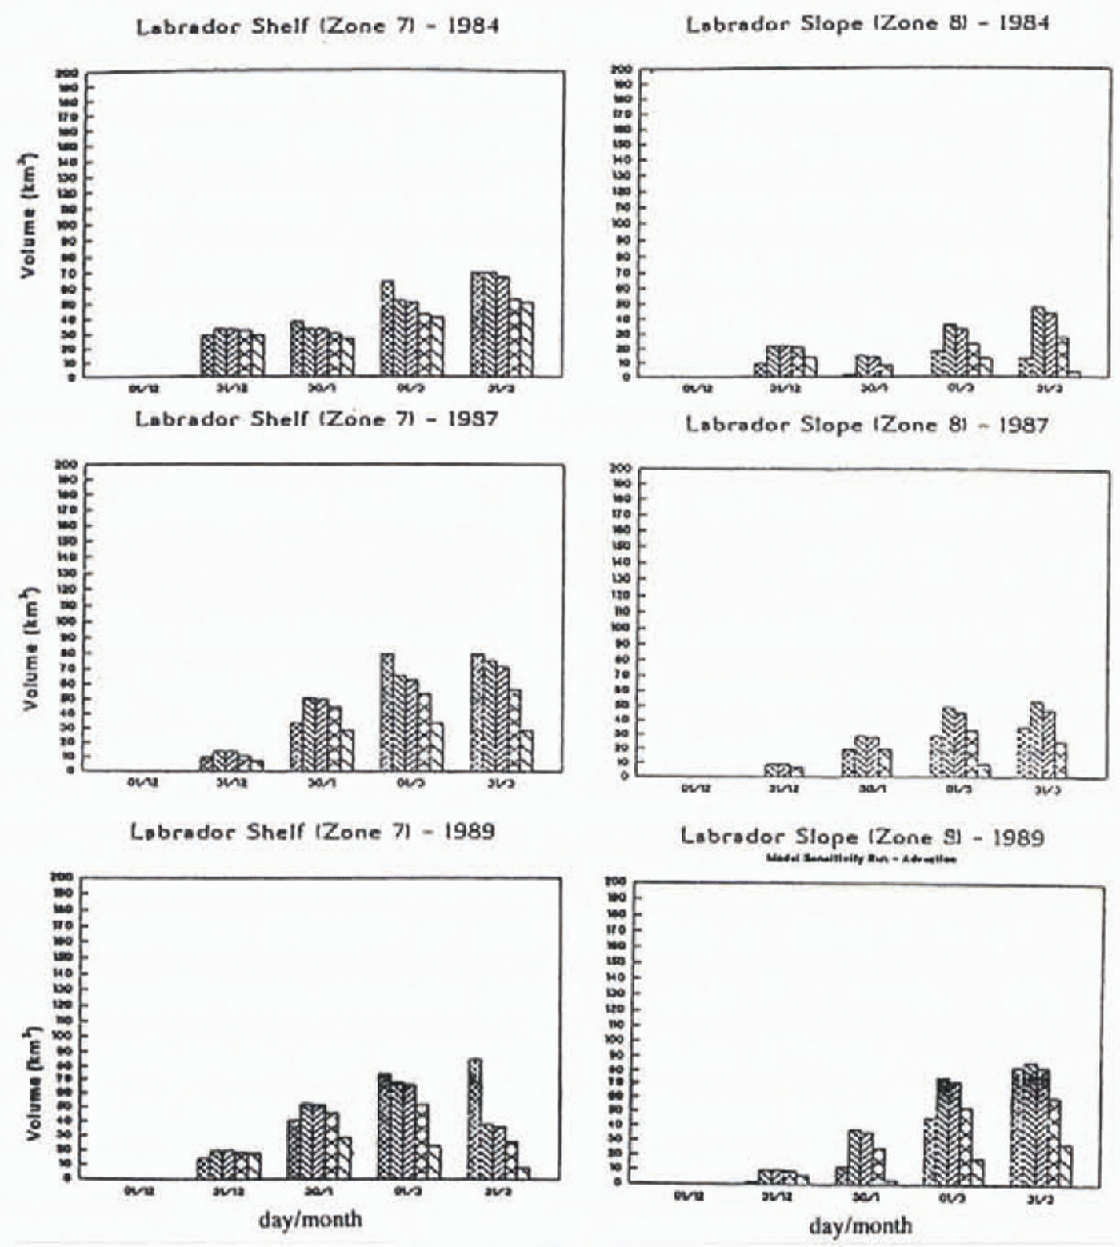
On the other hand, even in early December, case (2) simulations indicated that 50% or more of the combined zone 4 and 5 ice volume was imported from adjacent Baffin Bay zones. For the late January period associated with the representative Davis Strait Ice Index (Reference Marko, Fissel, Wadhams, Kelly and BrownMarko and others, 1994a), the simulations imply that only about a third of the combined ice volume of zones 4, 5 and 9 (comprising most of the area included in Index computations) originates in Davis Strait. The effects of all cutoffs on Labrador zones 7 and 8, represented in Figure 3, show the enhanced sensitivity of southern zones to upstream ice. These data suggest that 60–80% of Labrador ice volume at the end of March originates north of 60°N, primarily from Davis Strait areas south of 67° N. The results do not support suggested (Reference Marko, Fissel, Wadhams, Kelly and BrownMarko and others, 1994a) linkages between Lancaster Sound ice fluxes and ice conditions south of 55° N.
Comparisons of Labrador zone 7 and 8 ice volumes as base case simulated, assuming alternative cutoffs of ice advection at the three boundaries indicated in the text. The series of adjacent vertical bars plotted for each date and zone denote ice volume (in km3) (left to right): observed: simulated (with no cutoff); simulated with northern Baffin Bay cutoff; simulated with northern Davis Strait cutoff; simulated with southern Davis Strait cutoff.
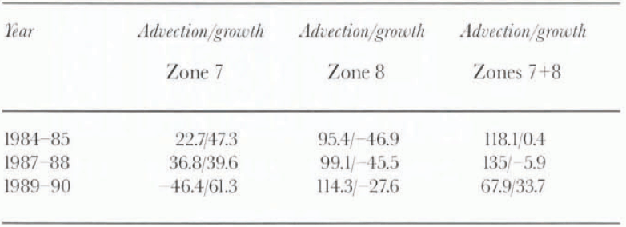
Overall, base case simulated cumulative ice-growth ice-melt volumes indicate ice growth to be concentrated in northern and western zones. Only one zone (8) was associated with negative growth (melt) values. This distinct feature of Labrador Sea waters over or close to the continental slope reflects the assumed local enhancements of heat fluxes. Simulated total regional ice-volume inflows across the northern and western external model boundaries varied by <20% among the three years studied, with accumulated exports to North Atlantic waters comprising only about 25% of the imported volumes except in 1989–90 when exceptionally large southward adveetion more than doubled the southward ice outflow. The corresponding net seasonal volume contributions of adveetion and growth, respectively, in zones 7 and 8 (Table 3), neglect an important aspect of the southern regional ice balance whereby about 66% of the net ice-volume growth and 75% of the net ice-volume advection in zone 7 take place prior to and after 1 February, respectively. Consequently, although growth dominates net annual ice-volume changes in the latter zone, adveetion is the principal agent of change in both zones 7 and 8 during the months associated with peak ice exports to waters south of 55°N. This circumstance underlies the close linkage between the Davis Strait Ice Index and southern spring ice extents.
Base case net advection into (+) and growth (+) as simulatedfor Labrador zones 7 and 8 in km3
Summary and Conclusions
The study results suggest that spatial and inter-annual variations in January-March ice conditions north of 55°N off eastern Canada are explicable in terms of the observed atmospheric fields, annually invariant ocean heat fluxes and currents, and ice conditions in adjacent areas. Key features of the underlying simulations were bathymetrically and latitude-dependent ocean heal fluxes and ice velocities that, on average, equalled observed long-term mean values. The identified dominance of adveetion in determining Davis Strait and Labrador Sea ice conditions is consistent with observed time-lagged linkages between ice extents in areas north and soulh of 55°N and underscores the necessity for large-scale regional treatments in representing local ice conditions.



