Introduction
Surface-enhanced Raman spectroscopy (SERS) is a highly sensitive vibrational spectroscopy that allows for the detection of analytes at extremely low concentrations.Reference Abalde-Cela, Aldeanueva-Potel, Mateo-Mateo, Rodríguez-Lorenzo, Alvarez-Puebla and Liz-Marzán1–Reference Sharma, Frontiera, Henry, Ringe and Van Duyne6 In SERS, the Raman signal of the probe molecule is amplified through excitation of localized surface plasmon resonances (LSPR) of the substrate, usually in the form of metal particles or a roughened metal film. Consequently, the magnitude of SERS enhancement is crucially dependent upon the SERS substrate. Many years of research have been devoted to creating and optimizing SERS substrates in order to provide the largest enhancements possible.Reference Abalde-Cela, Aldeanueva-Potel, Mateo-Mateo, Rodríguez-Lorenzo, Alvarez-Puebla and Liz-Marzán1,Reference Banholzer, Millstone, Qin and Mirkin7–Reference Kleinman, Frontiera, Henry, Dieringer and Van Duyne9 The fundamental metric for SERS activity is the enhancement factor (EF), which quantifies the increase in signal intensity (counts s–1 mW–1) per molecule. Commonly, EFs range from 103–107, with a few highly enhancing substrates achieving EFs >108.Reference Kleinman, Frontiera, Henry, Dieringer and Van Duyne9–Reference Greeneltch, Blaber, Henry, Schatz and Van Duyne11
Over time, SERS substrates have had many iterations and forms, beginning with roughened silver electrodes,Reference Jeanmaire and Van Duyne12 then moving onto silver and gold colloids.Reference Creighton, Blatchford and Albrecht13,Reference Lee and Meisel14 Later, as the SERS research community continued to grow, metal films with various thicknesses and nanostructured features were investigated as possible substrates.Reference Lee and Meisel14–Reference Van Duyne, Hulteen and Treichel17 More recently, combinations of both colloidal and film fabrication strategies have been developed to form SERS substrates.Reference Pieczonka, Moula and Aroca4,Reference Rodríguez-Lorenzo, Álvarez-Puebla, Pastoriza-Santos, Mazzucco, Stéphan, Kociak, Liz-Marzán and García de Abajo5,Reference Banholzer, Millstone, Qin and Mirkin7,Reference Kleinman, Frontiera, Henry, Dieringer and Van Duyne9,Reference Anema, Li, Yang, Ren and Tian18–Reference Osberg, Rycenga, Harris, Schmucker, Langille, Schatz and Mirkin20
Comparison of various SERS substrates is challenging because rigorous characterization of substrates is frequently overlooked for reasons of complexity. This prevents the determination of analytical parameters such as sensitivity and reproducibility. When classifying a material as a reliable, highly enhancing SERS substrate, several factors need to be taken into consideration.Reference Sharma, Frontiera, Henry, Ringe and Van Duyne6 First, an extinction or scattering spectrum of the substrate must be acquired and the LSPR modes identified. Second, SERS spectra should be collected for non-resonant molecules to verify that the enhancement is not being amplified by a resonance Raman effect, which can increase overall enhancement by 103–106.Reference Shim, Stuart and Mathies21 Third, thorough structural characterization of the substrate should be performed either by transmission electron microscopy (TEM), scanning electron microscopy (SEM), or other techniques (atomic force microscopy [AFM], scanning tunneling microscopy [STM], near-field scanning optical microscopy, electron energy-loss spectroscopy) and correlated with SERS measurements and theory. As a corollary, it is useful to develop collaborations with theoreticians to establish agreement between theory and experimental work and expand the understanding of underlying physical phenomena. Finally, a methodology must be developed to determine the Raman probe coverage on the surface and to calculate the substrate EF.Reference Kleinman, Frontiera, Henry, Dieringer and Van Duyne9–Reference Greeneltch, Blaber, Henry, Schatz and Van Duyne11 The fulfillment of these guidelines allows for a material to be established as a well-characterized SERS substrate. Since there is extended literature on plasmonic materials for SERS applications,Reference Abalde-Cela, Aldeanueva-Potel, Mateo-Mateo, Rodríguez-Lorenzo, Alvarez-Puebla and Liz-Marzán1,Reference Banholzer, Millstone, Qin and Mirkin7,Reference Kleinman, Frontiera, Henry, Dieringer and Van Duyne9,Reference Fan, Andrade and Brolo22 in this article, we focus on three representative examples of SERS substrates recently highlighted by the Van Duyne group at Northwestern University that are robust and exhibit high EFs.
We present an overview of colloidal nanoparticle systems, discussing nanoparticles produced by bottom-up methods in which small building units are used to fabricate a hierarchical structure,Reference Skaff, Emrick and Rotello23 emphasizing the impact of bottom-up approaches on SERS substrate evolution. More precisely, bottom-up approaches are common in colloidal science for rationally designed synthesisReference Banholzer, Millstone, Qin and Mirkin7 and assemblyReference Fan, Andrade and Brolo22,Reference Grzelczak, Vermant, Furst and Liz-Marzán24–Reference Wang, LaMontagne, Lynch, Zhuang and Cao27 of nanoparticles. The control achievable by bottom-up techniques in the size,Reference Banholzer, Millstone, Qin and Mirkin7,Reference Ye, Zheng, Chen, Gao and Murray28 shape,Reference Brinson, Lassiter, Levin, Bardhan, Mirin and Halas29–Reference Yang, Alvarez-Puebla, Kim, Aldeanueva-Potel, Liz-Marzán and Kotov36 and compositionReference Cozzoli, Pellegrino and Manna37–Reference Xie, Jin, Tao, Wang, Xie, Zhu and Xia42 of metallic nanoparticles, as well as their organization in clustersReference Grzelczak, Vermant, Furst and Liz-Marzán24,Reference Chen, Wang, Tan, Yang, Tan, Chen and Chen43,Reference Chen, Wang, Yang, Xu, Goh, Pan and Chen44 or interfacesReference Pieczonka, Moula and Aroca4,Reference Rycenga, Camargo and Xia45 to create high local electromagnetic (EM) field enhancement or “hot spots” are particularly relevant for SERS.Reference Kleinman, Frontiera, Henry, Dieringer and Van Duyne9,Reference Le Ru, Meyer, Blackie and Etchegoin46,Reference Otto47 We next briefly introduce top-down synthetic methods that involve direct fabrication of small features on a large area supported by various techniques, such as lithography, film deposition, and laser and mechanical processing.Reference Fan, Andrade and Brolo22,Reference Skaff, Emrick and Rotello23
We then discuss three substrates recently highlighted in our lab as representative examples: top-down fabricated immobilized nanorod assemblies (INRA) substrates, a specific type of metal film over nanosphere substrate; commercially produced silica-encapsulated nanoparticle aggregates that are synthesized using bottom-up approaches; and top-down modified STM or AFM tips used for tip-enhanced Raman spectroscopy (TERS). The INRA substrates and nanoantennas are both highly robust and achieve high EFs (>108), while the TERS tips achieve EFs ∼106 and permit both spectral and spatial characterization of the Raman probe molecules. Finally, we conclude with a discussion on future prospects and new applications for SERS substrates.
Synthesis methods
Bottom-up synthesis methods for nanoparticles involve creating larger systems from smaller units, including atoms, molecules, polymers, and/or nanoparticles. Some techniques used are chemical synthesis, laser trapping, self-assembly, and colloidal aggregation.Reference Kleinman, Frontiera, Henry, Dieringer and Van Duyne9,Reference Fan, Andrade and Brolo22,Reference Skaff, Emrick and Rotello23 In this section, we first provide an overview of recent developments in nanoparticle synthesis and assembly for SERS applications based on bottom-up methods; then we briefly introduce top-down methods.
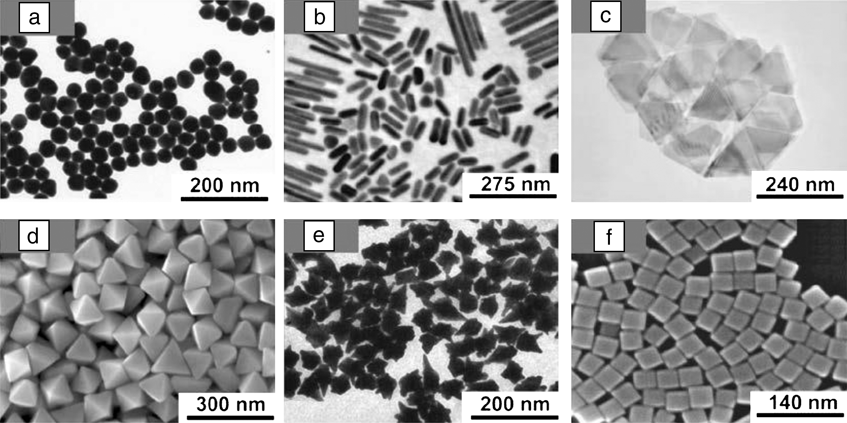
The goal of designing SERS substrates is to make them highly reproducible and to optimize the structure for the largest enhancement of the EM field. Higher EFs are expected for silver-based substrates compared with other metals due to the dielectric function of silver, which restricts interband transitions to the UV region, minimizing plasmon resonance damping.Reference Cardinal, Rodríguez-González, Alvarez-Puebla, Pérez-Juste and Liz-Marzán38 Regardless, both gold and silver have been extensively used for SERS substrates. Historically, the synthesis of chemically stable silver nanoparticles with high size and shape tunability, as well as monodispersity, has been more arduous than for gold. During the last few years, silver and gold nanoparticles have been prepared in very diverse shapes, including spheres,Reference Lee and Meisel14,Reference Bastús, Comenge and Puntes48–Reference Turkevich, Stevenson and Hillier50 cubes,Reference Rycenga, Xia, Moran, Zhou, Qin, Li and Xia51,Reference Sherry, Chang, Schatz, Van Duyne, Wiley and Xia52 tetrahedra,Reference Kim, Connor, Song, Kuykendall and Yang53 bipyramids,Reference Langille, Personick, Zhang and Mirkin31,Reference Lu, Rycenga, Skrabalak, Wiley and Xia32,Reference Liu and Guyot-Sionnest54 decahedra,Reference Sánchez-Iglesias, Pastoriza-Santos, Pérez-Juste, Rodríguez-González, García de Abajo and Liz-Marzán55 prisms,Reference Ha, Koo and Chung56–Reference Pastoriza-Santos and Liz-Marzán58 nanorods and wires,Reference Ye, Zheng, Chen, Gao and Murray28,Reference Murphy, Sau, Gole, Orendorff, Gao, Gou, Hunyadi and Li33 nanoshells,Reference Brinson, Lassiter, Levin, Bardhan, Mirin and Halas29 stars,Reference Sau, Rogach, Döblinger and Feldmann34,Reference Rodríguez-Lorenzo, Álvarez-Puebla, García de Abajo and Liz-Marzán59 laces,Reference Yang, Alvarez-Puebla, Kim, Aldeanueva-Potel, Liz-Marzán and Kotov36 and other polyhedral shapesReference Grzelczak, Pérez-Juste, Mulvaney and Liz-Marzán30–Reference Lu, Rycenga, Skrabalak, Wiley and Xia32,Reference Xia, Zeng, Zhang, Moran and Xia35,Reference Rycenga, Xia, Moran, Zhou, Qin, Li and Xia51,Reference Niu, Zheng, Wang, Liu, Li, Han, Chen, Tang and Xu60,Reference Seo, Yoo, Chung, Park, Ryu and Song61 (Figure 1). Among these, highly faceted particlesReference Banholzer, Millstone, Qin and Mirkin7,Reference Osberg, Rycenga, Harris, Schmucker, Langille, Schatz and Mirkin20,Reference Lu, Rycenga, Skrabalak, Wiley and Xia32,Reference Xia, Zeng, Zhang, Moran and Xia35,Reference Rycenga, Xia, Moran, Zhou, Qin, Li and Xia51,Reference Millstone, Wei, Jones, Yoo and Mirkin57 are particularly important for the goal of achieving SERS with single particles, since the strategic presence of edges and tips can concentrate the electromagnetic field onto specific regions of the nanoparticle surface,Reference Abalde-Cela, Aldeanueva-Potel, Mateo-Mateo, Rodríguez-Lorenzo, Alvarez-Puebla and Liz-Marzán1,Reference Rodríguez-Lorenzo, Álvarez-Puebla, Pastoriza-Santos, Mazzucco, Stéphan, Kociak, Liz-Marzán and García de Abajo5,Reference Rycenga, Xia, Moran, Zhou, Qin, Li and Xia51 and the EF can reach values of approximately 1010.Reference Rodríguez-Lorenzo, Álvarez-Puebla, Pastoriza-Santos, Mazzucco, Stéphan, Kociak, Liz-Marzán and García de Abajo5 Before the synthesis of these nanoparticles with sharp features, the highest measured EF of a single Au nanoparticle was 104.Reference Tay, Hulse, Kennedy and Pezacki62
Various types of nanoparticles synthesized using bottom-up approaches. (a) Transmission electron microscopy (TEM) image of Au nanospheres. Adapted with permission from Reference 48. © 2011 American Chemical Society. (b) TEM image of Au nanorods and (c) Au nanoprisms. Adapted with permission from Reference 57. © 2008 American Chemical Society. (d) SEM image of Au bipyramids. Adapted with permission from Reference 60. © 2008 American Chemical Society. (e) TEM image of Au nanostars. Adapted with permission from Reference 34. © 2011 American Chemical Society. (f) SEM image of Ag polyhedra. Adapted with permission from Reference 35. © 2012 American Chemical Society.

In addition to tuning the nanoparticle composition, size, and shape, bottom-up approaches also permit fine manipulation of the interparticle distance, making it easier to create hot spots (i.e., the intersection or close interaction of two or more plasmonic objects where the distance between objects is on the nm-scale). Hot spots are localized regions of highly concentrated EM fields that give rise to the enhancement of the Raman signal in SERS. The hot spot phenomenon is a complex subject that has been reviewed in detail elsewhere.Reference Kleinman, Frontiera, Henry, Dieringer and Van Duyne9
Generally, nanoparticle assemblies are driven by chemical or physical forces between nanoparticles or between the nanoparticle and a substrate.Reference Fan, Andrade and Brolo22,Reference Grzelczak, Vermant, Furst and Liz-Marzán24–Reference Wang, LaMontagne, Lynch, Zhuang and Cao27 When the assembly is chemically driven, the linking molecules or macromolecules often possess specific functional groups such as thiols,Reference Whitmore, El-Khoury, Fabris, Chu, Bazan, Potma and Apkarian63 amino-, and/or carboxylic acids,Reference Taladriz-Blanco, Buurma, Rodriguez-Lorenzo, Pérez-Juste, Liz-Marzán and Herves64 as in the case of engineered polypeptides and nucleic acids.Reference Chen, Wang, Tan, Yang, Tan, Chen and Chen43,Reference Auyeung, Macfarlane, Choi, Cutler and Mirkin65 There is extensive literature on SERS substrates assembled by chemical interactions that is outside the scope of this work; however, we highlight a few examples here. Whitmore et al. showed that they could form controlled dimers using a dye linker between two silver nanoparticles, ensuring the dye molecule (the probe in this example) is located in the hot spot.Reference Whitmore, El-Khoury, Fabris, Chu, Bazan, Potma and Apkarian63 Additionally, Chen et al. clearly showed different enhancing properties in the SERS spectra of separate dimer and trimer geometries and indicated the importance of sample purification.Reference Chen, Wang, Yang, Xu, Goh, Pan and Chen44 The Lazarides group illustrated the advantages of DNA hybridization for well-controlled assemblies in core-satellite structures.Reference Chen and Lazarides66 Finally, the robustness and convenience of coating nanoparticles was demonstrated in single shell-isolated nanoparticle-enhanced Raman spectroscopy and assembled particles.Reference Kleinman, Sharma, Blaber, Henry, Valley, Freeman, Natan, Schatz and Van Duyne10,Reference Anema, Li, Yang, Ren and Tian18
For physically driven assemblies, the hydrophobicity/hydrophilicity balance and/or magnetic and electrostatic interactions play a key role. These assemblies can be triggered by external stimuli such as pressure,Reference Pieczonka, Moula and Aroca4 ionic strength,Reference Chen, Wang, Tan, Yang, Tan, Chen and Chen43,Reference Chen, Wang, Yang, Xu, Goh, Pan and Chen44 pH or temperature,Reference Pérez-Juste, Pastoriza-Santos and Liz-Marzán40 electricReference Gangwal, Cayre and Velev67 or magneticReference Gühlke, Selve and Kneipp39–Reference Spuch-Calvar, Rodríguez-Lorenzo, Morales, Álvarez-Puebla and Liz-Marzán41 fields, or convective forces while drying.Reference Min, Akbulut, Kristiansen, Golan and Israelachvili68 Examples of nanoparticle clusters prepared by tuning the hydrophobicity/hydrophilicity balance include those where the water:organic solvent ratio is varied, such as in the fabrication of vesicles from amphiphilic polymers;Reference Song, Zhou and Duan25 aggregates from nanoparticles functionalized with thiolated polymers;Reference Lukach, Liu, Therien-Aubin and Kumacheva69 assemblies triggered between two liquid phases; or microemulsions.Reference Fan, Andrade and Brolo22,Reference Grzelczak, Vermant, Furst and Liz-Marzán24–Reference Wang, LaMontagne, Lynch, Zhuang and Cao27 All of these particles are attractive candidates as SERS substrates because they contain stabilizing agents, which are usually organic molecules that can act as a partitioning layer, increasing the Raman probe concentration close to the metal surface.Reference Alvarez-Puebla and Liz-Marzán70 Although the accurate quantification of the number of molecules being probed is difficult, particularly for diffusing Raman probe molecules, a lower limit estimation of the EF, obtained by assuming a monolayer of the Raman probe molecules, is appropriate for substrate comparison.Reference Kleinman, Frontiera, Henry, Dieringer and Van Duyne9,Reference Le Ru, Blackie, Meyer and Etchegoin71 This can be achieved by estimating maximum surface coverage based on packing density from molecular geometry calculations.Reference Wan, Terashima, Noda and Osawa72,Reference Whelan, Smyth and Barnes73 This also highlights the need for high fidelity structural information relating to surface area.
From an analytical point of view, the quantification of Raman probes at very low concentrations (<10–8 M) has been widely achieved in simple matricesReference Kleinman, Ringe, Valley, Wustholz, Phillips, Scheidt, Schatz and Van Duyne2,Reference Le Ru, Meyer and Etchegoin3 and complex media, such as biological fluids, where other metabolites could interfere.Reference Abalde-Cela, Aldeanueva-Potel, Mateo-Mateo, Rodríguez-Lorenzo, Alvarez-Puebla and Liz-Marzán1 Interesting bottom-up strategies applied to achieve the ultimate limits of detection include the concentration of nanoparticles by a magnetic fieldReference Gühlke, Selve and Kneipp39,Reference Spuch-Calvar, Rodríguez-Lorenzo, Morales, Álvarez-Puebla and Liz-Marzán41 and trapping of the Raman probe molecules through polymer shrinkage.Reference Pérez-Juste, Pastoriza-Santos and Liz-Marzán40 When seeking highly reproducible substrates, common approaches include electrostatic driven assembly of metallic nanoparticles over micron-sized beads,Reference Abalde-Cela, Aldeanueva-Potel, Mateo-Mateo, Rodríguez-Lorenzo, Alvarez-Puebla and Liz-Marzán1 as well as assemblies driven by drying forces over lithographed substrates—combining bottom-up and top-down techniques.Reference Kleinman, Frontiera, Henry, Dieringer and Van Duyne9,Reference Fan, Andrade and Brolo22
Top-down synthetic techniques are used to modify larger structures through milling, etching, or molding into smaller substrate components.Reference Kleinman, Frontiera, Henry, Dieringer and Van Duyne9,Reference Jin, van Wolferen, Wormeester, van den Berg and Carlen15,Reference Qiuming, Scott, Brian, Jiajie, Paul, Heng and Dmitry16,Reference Fan, Andrade and Brolo22,Reference Skaff, Emrick and Rotello23 In particular, lithography has been widely used in top-down synthesis for industrial purposes due to a high degree of reproducibility and the possibility of large-scale fabrication. Disadvantages related to top-down techniques include high cost, low throughput, low areal density, and limited spatial resolution below a few nanometers. Presently, however, the disadvantage of limited spatial resolution has been overcome by performing sequential deposition of a metal and a spacer.Reference Fan, Andrade and Brolo22,Reference Song, Zhou and Duan25
SERS substrates
As both bottom-up and top-down synthesis methods have their advantages and disadvantages, we discuss three substrates used in our group as representative examples that were synthesized using both methods. We have demonstrated that the top-down synthesized INRA substrates and the bottom-up commercially produced silica-encapsulated nanoantennas are both extremely robust substrates that result in high EFs. We also discuss nanofeatured AFM or STM tips used in TERS that are synthesized using top-down methods.
INRA substrates
To achieve reliable quantitation on large-area SERS substrates, one should strive to fulfill the following specific criteria:
• Predictable and reproducible SERS enhancements,
• LSPR tunability for optimization at any wavelength, and
• Large-area uniformity.
INRA substrates are strong candidates for fulfilling the above requirements. They consist of a metal film deposited on a close-packed array of either polystyrene or silica nanospheres. The surface of the metal film forms a forest of radial nanopillars protruding from the underlying base of nanospheres and has demonstrated uniformity on the inch scale.Reference Greeneltch, Blaber, Henry, Schatz and Van Duyne11 Additionally, the location of the nanopillars at the sphere junctions provides tunable SERS hot spots.
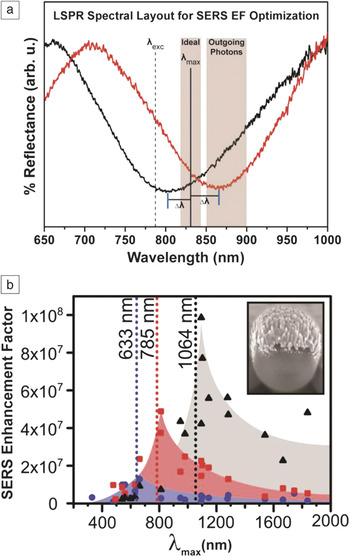
Recent work in our group has investigated the SERS EF of silver INRA (AgINRA) substrates as a function of both the LSPR spectral location (∼350 nm–1900 nm) and the input laser wavelength (633 nm–1064 nm) using plasmon-sampled surface-enhanced Raman excitation spectroscopy (PS-SERES).Reference Greeneltch, Blaber, Schatz and Van Duyne74 In PS-SERES, the LSPR position of the SERS substrate is tuned across the visible and near-infrared regions, while the SERS signal is measured and quantified at a fixed Raman excitation wavelength using the non-resonant benzenethiol molecule as the probe analyte. The LSPR positions of the INRA substrates are controlled by the size of the spheres (inset in Figure 2b). Tuning the LSPR in this manner allowed interrogation of the electromagnetic (EM) enhancement effect as a function of LSPR maximum (LSPRmax) separation (Δλ) from the ideal EM-predicted spectral wavelength (λmax, see Figure 2a).
The ideal localized surface plasmon resonances (LSPR) maximum (λmax) and laser excitation wavelength (λexc) for optimizing the surface-enhanced Raman spectroscopy (SERS) electromagnetic effect on substrates with broad plasmon resonances. (a) The ideal λmax lies between the λexc and the outgoing Raman-shifted photons. Example reflectance spectra of two immobilized nanorod assembly substrates (red and black traces) are shown, with plasmon resonances separated by Δλ from this ideal wavelength. (b) The plasmon-sampled surface-enhanced Raman excitation spectroscopy results indicate that the SERS maximum enhancement rises as the excitation wavelengths move toward the red: 633 nm (blue), 785 nm (red), and 1064 nm (black). All measurements were done on AgINRA SERS substrates (SEM image inset). EF, enhancement factor. Adapted with permission from Reference 74. © 2013 American Chemical Society.

The EM contribution to the SERS mechanism is optimized on this type of broad plasmon resonance substrate when the LSPR providing the enhancement lies between the excitation wavelength and the chosen Raman scattered photon wavelength (i.e., by minimizing the value of Δλ in Figure 2a), because both incident and scattered fields are enhanced.Reference Frontiera, Henry, Gruenke and Van Duyne79,Reference Tyler, Henry, Van Duyne and Hersam80 Figure 2a shows an example at λexc = 785 nm. Outgoing photons associated with stretches in the 1000–1600 cm–1 frequency region are located at 851–898 nm in this scenario. Therefore, maximum SERS enhancement is predicted with a λmax of 818–841 nm.
Average SERS enhancements were reported for each substrate with three different excitation wavelengths (see Figure 2b). These PS-SERES results show SERS enhancement reaches a maximum to the red of the excitation source, similar to those previously reported using wavelength-scanned SERS measurements.Reference McFarland, Young, Dieringer and Van Duyne75 Also, as the plasmon resonance was excited further to the red, the EF increases going from the visible to NIR, reaching an average EF measured with a 1064 nm excitation of 1.0 × 10⁸. This result is among the highest EFs measured on this type of two-dimensional, immobilized SERS substrate to date and reflects advances made in substrate optimization and uniformity at the 100 μm scale. The significant increase in EF with 1064 nm excitation occurs concurrently with a decrease in the Raman cross-section of benzenethiol at this excitation wavelength. EF is a fundamental property of the SERS substrate, allowing for it to rise even though the Raman cross-section and overall signal intensity may drop.
The increase in the EF as the measurements approach the infrared can be explained using the generic plasmon quality factor:Reference Arnold and Blaber76,Reference Schmucker, Harris, Banholzer, Blaber, Osberg, Schatz and Mirkin77
 $${Q_{{\rm{SPP}}}} = {{{\rm{\varepsilon }}_{\rm{r}}^2} \over {{\rm{\varepsilon }}_{\rm{i}}^{}}}$$,
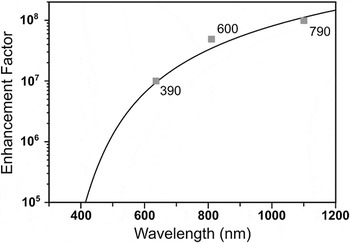
where εr and εi are the real and imaginary parts of the frequency-dependent dielectric function of silver, respectively. Q SPP describes the level of field confinement in nanoparticle systems where anisotropy allows for plasmon-induced charges to be spatially separated, as is the case when considering AgINRA nanopillars. In the EM mechanism for SERS, the EF is related to the fourth power of the electric field (E4), which is proportional to Q SPPReference Kleinman, Ringe, Valley, Wustholz, Phillips, Scheidt, Schatz and Van Duyne2 when the system is on resonance. The correlation between the EF and Q SPPReference Kleinman, Ringe, Valley, Wustholz, Phillips, Scheidt, Schatz and Van Duyne2 includes a geometry dependent pre-factor determined via an empirical fit to be ∼10.5 for the INRA substrates. Figure 3 shows that Q SPPReference Kleinman, Ringe, Valley, Wustholz, Phillips, Scheidt, Schatz and Van Duyne2 was in excellent agreement with the measured EFs at the three wavelengths considered. Further, the quality factor plot suggests that the EF will continue to rise at even longer excitation wavelengths than those studied in this work.Reference Greeneltch, Blaber, Schatz and Van Duyne74
Maximal enhancement factors (EFs) for the three AgINRA surface-enhanced Raman spectroscopy (SERS) substrates of different sphere sizes (squares) that performed optimally at the laser wavelengths of 633 nm, 785 nm, and 1064 nm. The EF scales as Q SPPReference Kleinman, Ringe, Valley, Wustholz, Phillips, Scheidt, Schatz and Van Duyne2 (black curve), where Q SPP describes the amount of electric field confinement, and thus relates directly to electromagnetic SERS enhancement. This plot suggests that the EF will continue to rise at even longer wavelengths than are considered here. Reprinted with permission from Reference 74. © 2013 American Chemical Society.

This work demonstrates the high-quality performance of large-area, broad-plasmon substrates on large ensembles of non-resonant surface-bound molecules. It conveys empirical observations useful in analytical chemistry applications: (1) Higher EFs are observed as experiments are tuned to the red; and (2) optimal enhancement is expected when broad LSPR profiles lie between the incoming and outgoing photon wavelengths.
Nanoantennas
Similar to the INRA substrates, SERS nanoantennas also have higher EFs as excitation wavelengths move to the red; they differ, however, in that the optimal enhancement does not occur when the LSPR profile lies between the incoming and outgoing photons. Before we discuss this discrepancy between the two substrates, we describe the synthesis of and recent experiments with nanoantennas.
SERS nanoantennas, while not as broadly applicable as INRA substrates, are useful in specific applications, such as authenticity markers in luxury goodsReference Sharma, Frontiera, Henry, Ringe and Van Duyne6 and in in vivo biological imaging applications.Reference Keren, Zavaleta, Cheng, de la Zerda, Gheysens and Gambhir78 They are bottom-up synthesized nanoparticles, similar to the colloidal systems described previously, which have many benefits relating to detection as well as fundamental structure-function studies. However, nanoparticles in solution can degrade and change shape over time or with intense laser exposure, potentially affecting the electric field enhancement. Therefore, there is a significant need for “stabilized” colloidal systems. Strategies are being developed to stabilize the structures with a rigid and potentially permeable encasement. Encapsulated systems withstand higher laser fluencesReference Frontiera, Henry, Gruenke and Van Duyne79 produced by ultrafast lasers and also preserve their shape during post-synthetic purification processes.Reference Tyler, Henry, Van Duyne and Hersam80 Coating the nanoparticles with a dielectric material, often silica, provides a rigid outer layer, preserving the nanoparticle structure and potentially increasing the laser damage threshold of adsorbed dyes. Here, we discuss how commercially produced silica-coated nanoparticle aggregates (Cabot Security Materials, Mountain View, CA), which we will refer to as “nanoantennas,” have been used and studied for both applications-oriented experiments, as well as probes for the delicate interplay between the structure, SERS response, and optical properties of plasmonic materials.
It has become widely accepted that the largest SERS enhancements arise from systems that contain hot spots.Reference Kleinman, Frontiera, Henry, Dieringer and Van Duyne9,Reference Fang, Seong and Dlott81 A common and easily understandable route to produce hot spots from colloidal systems starts with the growth of individual nanoparticles either by a seed-mediated or one-pot method. At this point in the synthesis, nanoparticles are discrete and often capped with stabilizing surfactants. The next task is to aggregate the nanoparticles by a variety of chemical or physical methods (vide supra). An encapsulation step then freezes the aggregation process. Single nanoparticles, or monomers, that have not yet associated will coexist with larger clustered aggregates of two or more individual particles. Single nanoparticles—especially spherical ones—cannot support a hot spot and exhibit lower EFs than aggregates of two or more nanoparticles.Reference Tay, Hulse, Kennedy and Pezacki62 Accordingly, a separation method for obtaining a sample enriched in aggregates with non-monomeric species was created.Reference Tyler, Henry, Van Duyne and Hersam80
By centrifuging the nanoantennas in a high-viscosity density gradient medium, the Hersam and Van Duyne groups have demonstrated efficient separation of monomers from an as-synthesized mixture of nanoantennas.Reference Tyler, Henry, Van Duyne and Hersam80 The first fraction isolated using centrifugation contained nearly 97% monomers. The subsequent fractions had significantly more higher-order aggregates and also demonstrated increased SERS activity per unit volume of sample. This simple process can be applied to nanoantennas before integration into detection and authentication platforms, ensuring the sample will have the highest SERS activity while preserving the probe molecule and underlying aggregate structure. Now that we have illustrated how to extract the best nanoantennas from a synthetic mixture, the focus turns to which wavelength is best for probing a heterogeneous set of nanoantennas.
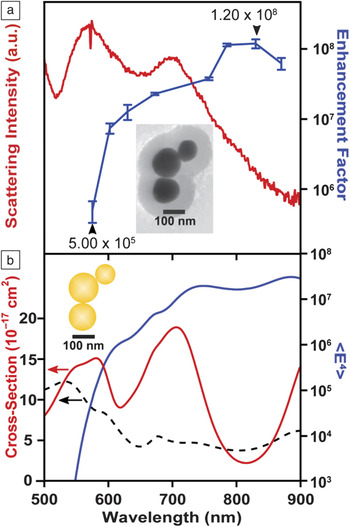
Recent computational analysis has suggested that near-infrared wavelengths may provide the most intense response for aggregates of Au nanoparticles.Reference McMahon, Henry, Wustholz, Natan, Freeman, Van Duyne and Schatz82,Reference Wustholz, Henry, McMahon, Freeman, Valley, Piotti, Natan, Schatz and Van Duyne83 McMahon et al. suggested that when two particles are in contact with one another, the crevice is an extremely sharp feature that can highly concentrate NIR excitation wavelengths, resulting in huge SERS enhancement.Reference McMahon, Henry, Wustholz, Natan, Freeman, Van Duyne and Schatz82 Additionally, for spheroidal particles that touch only at one point (not coalesced), this crevice region is accessible to probe molecules, resulting in the largest SERS EFs. To examine this phenomenon, we recently conducted a correlated SERES-LSPR-TEM study on Au nanoantennas of various sizes, ranging from dimers to undecamers, employing eight Raman excitation wavelengths between 575 nm and 870 nm.Reference Kleinman, Sharma, Blaber, Henry, Valley, Freeman, Natan, Schatz and Van Duyne10 We found that the maximum SERS enhancement occurs for excitation wavelengths between 785 nm and 870 nm, regardless of the LSPR scattering spectrum of the individual nanoantenna.
Figure 4 demonstrates this example for a nanoantenna trimer, a basic hot spot-containing system. In this figure, the top panel shows the experimental result, that the maximum EF (blue line) occurs for λexc = 830 nm, whereas there are two maxima in the LSPR spectrum (LSPRmax) occurring at 580 and 705 nm. Theoretical modeling confirms the experimental result in the bottom panel, with the total extinction decomposed into scattering and absorption contributions. On the single nanoaggregate level, the fourth power of the surface averaged electric field strength (which is directly proportional to the SERS enhancement) does not correlate well with the far-field scattering properties (LSPRmax) of a particle nanoantenna. This consideration is highly relevant for the incorporation and optimal use of nanoantenna particles for methods of analysis and authentication. The dielectric shell provides structural stability, and this recent work demonstrates how to best utilize the optical properties of these robust materials.
Maximum enhancement factors in single particle surface-enhanced Raman spectroscopy (SERS) are not correlated to the maximum in the plasmon resonance spectrum. (a) Experimental dark-field scattering spectrum (red) and surface-enhanced Raman excitation spectroscopy excitation profile for the 1200 cm−1 band (blue) of the nanoantenna trimer presented in the inset of panel (a). (b) Electromagnetic modeling of the nanoantenna trimer, displaying the <E4> enhancement in solid blue, scattering in solid red, and absorbance in the black dashed line. Both experimentally and theoretically, the trimer provides maximal SERS enhancement in the region where the far-field scattering is relatively weak. Reprinted with permission from Reference 10. © 2013 American Chemical Society.

INRA versus nanoantennas
Both INRA substrates and nanoantennas demonstrate higher EFs as the excitation wavelength moves to the red, but they exhibit vastly different behavior with respect to the relationship between LSPRmax and the wavelength corresponding to maximal SERS enhancement. To clearly explain this difference, we include in the discussion substrates previously used in our group: Ag triangular nanoparticle arrays fabricated by nanosphere lithography (NSL). These NSL arrays were examined using both wavelength-scanned SERESReference McFarland, Young, Dieringer and Van Duyne75 and PS-SERES,Reference Haynes and Van Duyne84 and it was determined that the maximal SERS EFs for these substrates always occurs when the LSPRmax lies to the red of the excitation. These substrates exhibit weak plasmonic coupling due to gaps between the triangular nanofeatures and distances of ∼200 nm between the triangles in the array. On the contrary, in the nanoantennas discussed previously, the spacing between particles is significantly smaller (<1 nm), and therefore the localized surface plasmon modes are strongly coupled. The INRA substrates fall in between the NSL arrays and nanoantennas in terms of coupling; they possess a range of coupling strengths in and around the support-sphere junctions. Therefore, they have high EFs similar to the nanoantennas, but the relationship between LSPRmax and laser excitation and Raman scattering is correlated, similar to the NSL arrays.
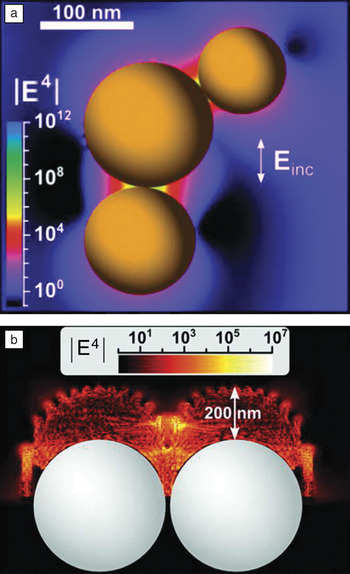
The reason that the LSPRmax does not correlate well with the maximum enhancement for the nanoantennas is twofold. Primarily, the discreteness of the nanoantenna geometry allows for interference between plasmonic modes, causing dips in the far-field scattering spectrum (as shown in Figure 4a). Secondly, the coupling strength of the plasmonic modes of the nanoantenna is very strong, which allows the system to present the highly confined near-fields necessary for SERS, even though the absorption cross-section (at the relevant wavelengths) is not large (see Figure 4b). Figure 5 shows the calculated fields for the nanoantennas and INRA substrates, where the difference between the hot spots of the two substrates is illustrated. The fields around the nanoantennas (Figure 5a) are localized between the discrete nanoparticles, whereas the fields around the INRA substrates (Figure 5b) are localized to the junctions between the nanosphere support structures and involve many nanorods per support sphere, each with varying nearest neighbor gaps, and there are several support spheres in the excitation beam. Any interference effects in the latter case average out due to the range of coupling strengths and mode symmetries. We therefore attribute differences in the features of the enhancement and LSPR between classes of substrates to symmetry effects and differences in plasmonic coupling strength.
Electric field enhancements for (a) nanoantennasReference Kleinman, Sharma, Blaber, Henry, Valley, Freeman, Natan, Schatz and Van Duyne10 and (b) immobilized nanorod assembly (INRA) substrates.Reference Greeneltch, Blaber, Henry, Schatz and Van Duyne11 For the nanoantennas, the highly enhancing fields are concentrated to the small (<1 nm) gaps between the particles. In the INRA substrates, the pillars localize the electric field to the gaps between particles as well as the tips of the pillars. Einc, incident electric field. (a) Adapted with permission from Reference 10. © 2013 American Chemical Society; and (b) adapted with permission from Reference 11. © 2013 American Chemical Society.

For near-term commercialization of SERS as a detection platform, substrates that fulfill the requirements mentioned at the beginning of this section are highly desirable. INRA substrates fulfill all of these requirements and are the most adaptable for a variety of experimental conditions. For a more fundamental understanding of single molecule-substrate interactions, however, a locally confined technique such as TERS is well suited. TERS is particularly useful since the creation and annihilation of the hot spot is controlled on-demand, with simultaneous monitoring of topographic features.
Tip-enhanced Raman spectroscopy
TERS is a powerful technique that combines the molecular vibrational information from SERS with the high spatial (nm to sub-nm) resolution and imaging capabilities of STM, AFM, or shear force microscopy.Reference Lucas and Riedo85–Reference Schmidt, Kopf and Bründermann87 TERS interrogates plasmonic hot spots generated by a laser incident on a noble metal tip (usually Au or Ag), thereby probing molecules adsorbed to a substrate (often also a noble metal, although other substrates have been examinedReference Stadler, Oswald, Schmid and Zenobi88). The advantage of TERS over SERS is that instead of probing several hot spots, TERS probes just the hot spot created between the tip and substrate. This limits the probe volume and allows for a more accurate calculation of the EF. For TERS, EFs due to the EM mechanism are typically EFEM ∼ 106–107.Reference Pettinger, Schambach, Villagomez and Scott86
Several factors affect the EFs and spatial resolution obtained with TERS, the most important being the tip shape and radius of curvature.Reference Pettinger, Schambach, Villagomez and Scott86 The two most common methods of tip preparation are electrochemical etching, used with STM-based systems, and metal deposition on commercially available AFM tips. In electrochemical etching, a thin metal wire (Au or Ag) is positioned at the surface of an etching solution, either HCl or HClO4, along with a Pt ring that serves as the counter electrode, across which a constant voltage is applied.Reference Lucas and Riedo85,Reference Stadler, Oswald, Schmid and Zenobi88–Reference Sonntag, Klingsporn, Garibay, Roberts, Dieringer, Seideman, Scheidt, Jensen, Schatz and Van Duyne90 Electrochemical etching is an appealing technique because it results in the fabrication of very sharp tips, thus high EFs and high spatial resolution, at a low cost.Reference Schmidt, Kopf and Bründermann87 The disadvantages of electrochemical etching include difficulty in controlling tip quality, poor reproducibility, and lack of scalability. To coat commercial AFM tips, a thin film (∼20 nm) of Ag or Au is evaporated onto the tip. This technique is easily scaled up for production of large quantities; however, the deposited metal on the tip increases the radius of curvature of the tip, which can decrease enhancement and spatial resolution.Reference Schmidt, Kopf and Bründermann87 The additional weight from the extra metal on the tip can also affect the AFM cantilever adversely.Reference Lucas and Riedo85
Recently, we used electrochemically etched Ag STM tips to investigate single molecules of Rhodamine 6G (R6G) using an isotopologue approach (deuterated versus non-deuterated samples) under ambient conditions.Reference Sonntag, Klingsporn, Garibay, Roberts, Dieringer, Seideman, Scheidt, Jensen, Schatz and Van Duyne90 Calculation of the probe volume of the tip-sample junction allowed for the accurate determination of EFEM ∼106 for this ambient STM-TERS system. In addition to TERS performed in ambient conditions, it is also possible to measure STM-TERS under ultrahigh vacuum (UHV) conditions. Steidtner and PettingerReference Steidtner and Pettinger91 first demonstrated concurrent STM imaging with TER spectra under UHV using a gold STM tip to examine single molecules of brilliant cresyl blue. They found that they were able to achieve 15 nm resolution and EF ∼106. Through development of a UHV-TERS system that allows for preparation of samples within the UHV chamber, greatly reducing contamination, we probed copper phthalocyanine molecules adsorbed on a Ag (111) substrate with a Ag STM tip and determined a lower limit calculation of EF to be 7.1 × 10⁵ (Figure 6).Reference Jiang, Foley, Klingsporn, Sonntag, Valley, Dieringer, Seideman, Schatz, Hersam and Van Duyne89 With continued development of TERS tips and substrates, TERS has a promising future, especially in the areas of catalysis, electron transfer, and understanding of systems on the single molecule level.
Ultrahigh vacuum tip-enhanced Raman spectroscopy (UHV-TERS) of copper phthalocyanine. (a) SEM of 130 nm radius of curvature Ag tip. (b) TERS spectra of copper phthalocyanine adsorbed on Ag (111) with the tip retracted from the surface (red spectrum), the tip engaged at the Ag (111) surface (blue spectrum), and the difference spectrum (engaged – retracted; green spectrum) compared to the surface-enhanced Raman spectrum of copper phthalocyanine on a AgINRA (purple spectrum). Spectra are normalized with respect to accumulation time and power and presented in units of analog to digital units (ADU) per mW per second.* indicates peaks arising from the sapphire windows on the UHV system. Adapted with permission from Reference 89. © 2012 American Chemical Society.

Future prospects
Advancements made in the controlled design of plasmonic materials, particularly in the engineering of highly enhancing EM hot spot regions, enable the use of SERS in a variety of applications, including medicine and sensing. Both top-down and bottom-up approaches to fabricate highly enhancing SERS substrates have led to significant increases in the sensitivity, stability, and, most importantly, reproducibility of SERS measurements. However, challenges still exist in the field of SERS substrate development. There is a significant need for reliable characterization of the numerous substrates demonstrated in the literature.Reference Kleinman, Frontiera, Henry, Dieringer and Van Duyne9 Only through a comprehensive evaluation of the EFs and total signal generation can substrates be rigorously compared and used appropriately for a range of applications. Some of the examples described in detail, in particular the nanoantenna colloids and the two-dimensional INRA samples, have been thoroughly characterized and are ideal for a range of applications.
The recent development of highly robust and hot spot-rich colloidal nanoantenna samples has enabled the exciting use of plasmonic materials in ultrafast spectroscopy. The combination of SERS with a time-resolved Raman technique known as femtosecond stimulated Raman spectroscopy (FSRS)Reference Frontiera, Fang, Dasgupta and Mathies92,Reference Frontiera and Mathies93 was facilitated by the hot spot-rich colloidal nanoantennas, which are robust enough to survive the intense peak powers of femtosecond laser pulses. This unique combination of plasmonics and ultrafast science resulted in the creation of a technique we called surface-enhanced femtosecond stimulated Raman spectroscopy (SE-FSRS),Reference Frontiera, Henry, Gruenke and Van Duyne79 which has enabled the study of molecule-plasmon coupling and dynamics.Reference Frontiera, Gruenke and Van Duyne94 The SE-FSRS technique will also facilitate time-resolved studies of molecular dynamics occurring on or near plasmonic substrates, with the goal of determining how the highly concentrated electron densities of plasmons affect the mechanism and rate of chemical reaction dynamics. Further investigation into the mechanism of enhancement and degradation, as well as the applicability of various plasmonic substrates for SE-FSRS, is currently under way. It is essential for future ultrafast SERS studies to develop other plasmonic samples that do not melt or degrade under intense pulsed laser irradiation.
In the field of TERS, several groups are investigating the use of more highly engineered tip substrates for reproducible TERS measurements. Possible avenues include directed assembly of strongly enhancing particles onto an electrochemically etched tip or the use of advanced lithographic techniques for highly controlled tip substrates.Reference Berweger and Raschke95 A current goal in the field of TERS is to develop tips with consistent enhancement, leading to better characterization of the EF in TERS under various experimental conditions and enabling more routine use in characterizing structural composition in a variety of materials.
Additional directions in the area of SERS sensing include integration of well-characterized SERS substrates into microfluidic channelsReference Cialla, Maerz, Boehme, Theil, Weber, Schmitt and Popp96,Reference Henkel, März, Popp and Schlucker97 in order to develop lab-on-a-chip devices capable of sensing with high sensitivity and chemical specificity. Substrates used in these applications must have highly reproducible EFs or use internal standards in order to correctly quantify analyte concentrations. A particular challenge is to optimize fabrication of partition layers for sensing a targeted range of molecules, allowing for a broad spectrum of chemicals to be detected simultaneously. Additionally, the development of reusable substrates, in which analytes can be controllably desorbed (and resorbed) from (to) the surface, would allow for greater applicability of SERS in a variety of sensing applications.
Conclusions
SERS is a versatile technique that can address fundamental scientific questions and technological problems; and in all cases, the substrate is a critical component. In this article, we presented three representative examples of SERS substrates that are highly robust and achieve high EFs for both SERS and TERS. These include substrates prepared by bottom-up methods, namely silica-coated clusters of gold nanoparticles, and top-down fabricated INRA substrates and TERS tips. With the vast developmental history of SERS substrates, we consider that SERS substrates have been well optimized, and future efforts should mainly address characterization of the platforms and the development of new SERS quantitation-driven sensing applications or SERS-augmented scientific techniques, such as surface enhanced-femtosecond stimulated Raman spectroscopy.
Acknowledgments
This work was supported by DARPA under SSC Pacific grants N660001–11–1-4179 and HR0011–13–2-002. Any opinions, findings, and conclusions or recommendations expressed in this publication are those of the author(s) and do not necessarily reflect the views of DARPA. This work was also supported by the National Science Foundation (CHE-0802913 and CHE-115247) and the Materials Research Center of Northwestern University (DMR-1121262).