The St. Louis Corridor region extending from Chicago, Illinois to St. Louis, Missouri has been described as an Inland North “enclave” by the Atlas of North American English (henceforth ANAE; Labov, Ash, & Boberg, Reference Labov, Ash and Boberg2005:276) and as a “breach” within the Midlands (Friedman, Reference Friedman2014). The latter description may be more apt, because while the Corridor exhibits some Inland North features such as those associated with the Northern Cities Shift (henceforth, Northern Cities Features; NCF), it is otherwise largely typical of the Midlands. Friedman proposed that the NCF entered the Corridor via interactions with travelers along Route 66 and by way of migration during the Great Depression into Corridor cities. He observed that the Northern Cities Features did not come on gradually as part of a chain shift but appeared wholesale and out of order (hence the use of NCF in this article to distinguish their mechanism within the Corridor from the chain shift that occurred in the Inland North). By hypothesis, the NCF then spread to communities farther away from Route 66, mainly as a result of transmission to children as opposed to diffusion between adults in the sense of Labov (Reference Labov2007), and they later retreated because they never achieved a sufficient foothold to facilitate transmission to children of subsequent generations.
Friedman's hypothesis is based on careful groundwork and is compelling in that it accounts for the nuanced path of change in communities along the Corridor. Even so, it remains to be demonstrated whether those intuitions can yield the attested path of change in practice. It is, of course, impossible to go back in time and watch the NCF advance and retreat as people moved around the Corridor, but we can simulate it. Simulation forces us to be mathematically explicit about our theories (Baxter, Blythe, Croft, & McKane, Reference Baxter, Blythe, Croft and McKane2006; Blythe & Croft, Reference Blythe and Croft2012; Nettle, Reference Nettle1999; etc.), and it allows us to empirically test specific hypotheses such as Friedman's in ways that would otherwise be impossible (e.g., Baxter, et al. [Reference Baxter, Blythe, Croft and McKane2009], on Trudgill's hypothesis for new dialect formation in New Zealand). I take the empirical path here, constructing a mini-Corridor of computational agents that provides a controlled setting in which to formalize and test specific hypotheses about the advance and retreat of the NCF in the Corridor. Using this model Corridor, I show that patterns of migration are required to arrive at the path of change that Friedman uncovered and discuss the merits of transmission and diffusion-centered accounts.
While the computational modeling approach supplements traditional sociolinguistic work by testing hypotheses and suggesting paths for further research, it is not without caveats. One such caveat is analogous to the problem of overfitting in statistical modeling. That is, with enough parameters or enough details built into the simulation, a computational model will produce virtually any desired outcome. This comes at the expense of explanatory power just as it does in statistics, so it is important to use fewer parameters and to externally motivate them with real-world evidence when possible. A second caveat comes from the abstract nature of the endeavor. A simulation is always modeling something, but, without sufficient grounding in the empirical, that something is not necessarily something in the real world. Walking the fine line between successfully overfitting and successfully simulating fictions is a constant struggle. To address this challenge head on, I take an introspective approach by stopping to consider the strengths and weaknesses of the assumptions behind each simulation as it is presented.
The model employed here can be contrasted with Stanford and Kenny's (Reference Stanford and Kenny2013) simulation of the St. Louis Corridor, which set out to investigate why a chain shift should advance at different rates and to different degrees of homogeneity on opposite ends of a large population by deploying an exemplar learning model in an agent-based simulation inspired by Chicago and St. Louis. They found evidence that diffusion is sufficient to create a “St. Louis” with a chain shift that lags behind their “Chicago” without the help of transmission, but that work was published before Friedman (Reference Friedman2014), and it did not yield a result that resembles the offset two-peak path of change discovered and described in that later research. The work presented here, in contrast, is focused on understanding how geography and large-scale social history directed the development of Inland North influence in the St. Louis Corridor, so it models the region in much more detail and gauges the model's success by whether or not it can reproduce the attested two-peak path of change under reasonable assumptions.
The next section elaborates on the social history and geography of the St. Louis Corridor. Following that is an overview of previous simulation work in sociolinguistics before introducing the modeling framework to be used in this paper. I then describe a series of simulations that seek to recreate the Corridor's NCF pattern under a variety of different assumptions. Finally, the implications of these results are discussed, both in relation to the St. Louis Corridor and to modeling language and variation in large communities in general.
HISTORY OF THE ST. LOUIS CORRIDOR
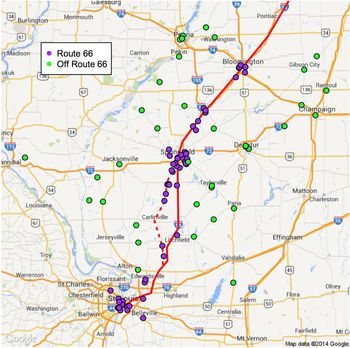
The St. Louis Corridor became the primary path through Illinois to the western parts of the United States in 1926 when the US Highway System was established, and US Route 66 was constructed as the first entirely paved road through the state. Unlike the controlled access highways that followed it, Route 66 connected the centers of the communities along its route, and locals who grew up in these communities during the heyday of Route 66 report that travelers would often stop over and interact with them at local diners (Friedman, Reference Friedman2014). It was superseded when the Illinois section of Interstate 55 was completed in 1977 and was decertified altogether in 1985. Figure 1 shows the path of Route 66, along with Friedman's interview locations.
St. Louis Corridor and Friedman's interview sites. The dashed line south of Springfield shows Route 66's alignment during its first decade of existence (Friedman, Reference Friedman2014, figure 3.1).

Friedman analyzed Great Depression-era traffic patterns along the Corridor from that area and found a notable dip in daily non-commercial traffic over that period (Friedman, Reference Friedman2014, figure 3.18). Nevertheless, migration into the Corridor from Chicago and the Inland North was alive and well. According to records from the 1940 census, the preceding decade was the only interval in the history of the state during which the state's geographic center of population moved towards its center instead of northeast towards Chicago, which suggests a serious disruption in the trend of Chicago urbanization relative to the rest of the state. One possible explanation for this is that migration from Chicago into the Corridor was heavier during that time than to Chicago from the Corridor. It should be noted that migration into the Corridor cities, while facilitated by the presence of Route 66, was probably not due to Route 66 per se. Rather, the road was constructed through Bloomington-Normal and Springfield on the way to St. Louis, because those were already important population centers.
Northern Cities Features in the Corridor
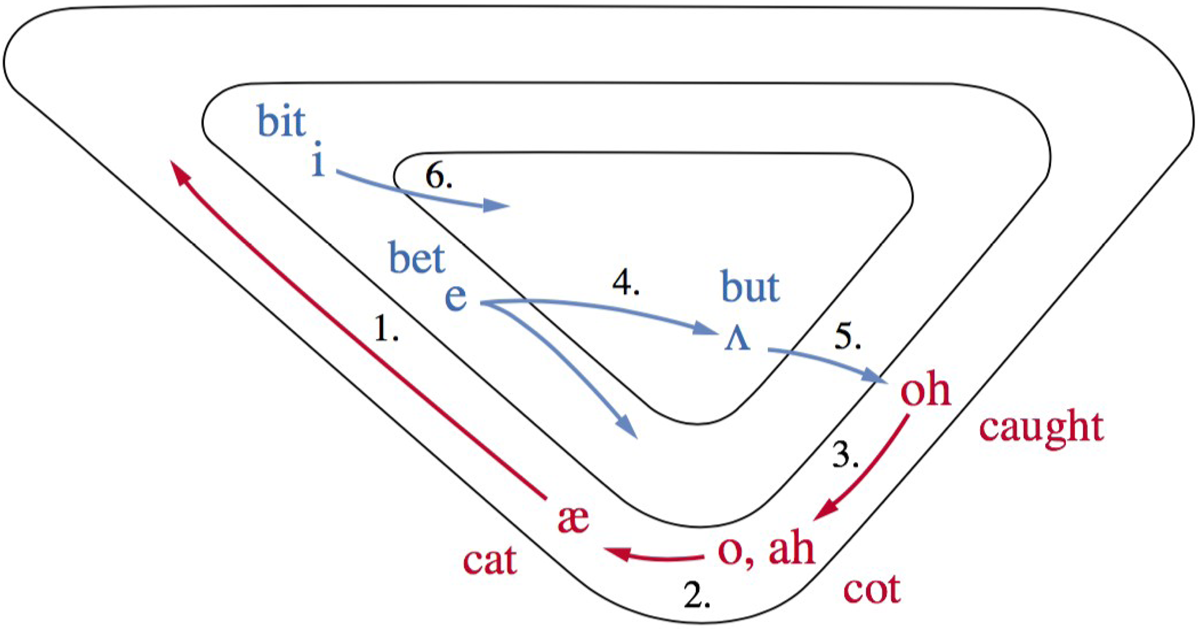
The Northern Cities Shift (NCS), a defining characteristic of the Inland North, is a chain shift that has classically proceeded in six steps (ANAE, Reference Labov, Ash and Boberg2005:190). First, a pull chain is initiated by the fronting and raising of /æ/,Footnote 1 followed by the fronting of /o, ah/ and lowering of /oh/. Next, raised /æ/ starts a push chain when /e/ backed and lowered followed by /ʌ/. Finally, /ɪ/ backs and lowers in the most advanced speakers. The ANAE uses the following binary criteria (1) to indicate whether an individual is participating in the NCS. Figure 2 diagrams these shifts. More recent work has challenged this order of events (Gordon, Reference Gordon2001; McCarthy, Reference McCarthy2010) in the Inland North. Most relevantly, ongoing work by Durian and Cameron (Reference Durian and Cameron2018) suggests that the NCS is actually developing out of order in Chicago with phases 1 and 2 constituting one chain shift and 4 and 5 constituting a separate shift.

The Northern Cities Shift by phase (ANAE, figure 14.1). (Steps 1–3 = pull chain; Steps 4–6 = push chain).

The shift's progress in the Inland North has been well documented. Fasold (Reference Fasold1969) first reported it, followed shortly by Labov (Reference Labov1972), who coined the name based on its presence in five of the Great Lakes region's large cities: Chicago, Detroit, Buffalo, Rochester, and Syracuse. It is attested in Chicago speakers born as early as 1891 (McCarthy, Reference McCarthy2010). Despite its pervasiveness, the NCS as a whole has exhibited virtually no social salience throughout its history (Labov, Reference Labov1994; Niedzielski, Reference Niedzielski1999; Preston, Reference Preston2002), though recent work suggests that that is beginning to change in some areas, including in Syracuse, New York (Driscoll & Lape, Reference Driscoll and Lape2015) and in Lansing, Michigan, where the trap vowel is at the level of social awareness (Nesbitt, Reference Nesbitt2018). In addition, several NCS features are receding in Lansing, which Wagner, Mason, Nesbitt, Pevan, and Savage (Reference Wagner, Mason, Nesbitt, Pevan and Savage2016) suggested may be the result of population movements rendering adult to child transmission insufficient to maintain the shifted features, an instance of the threshold problem in language change (Nettle, Reference Nettle1999).
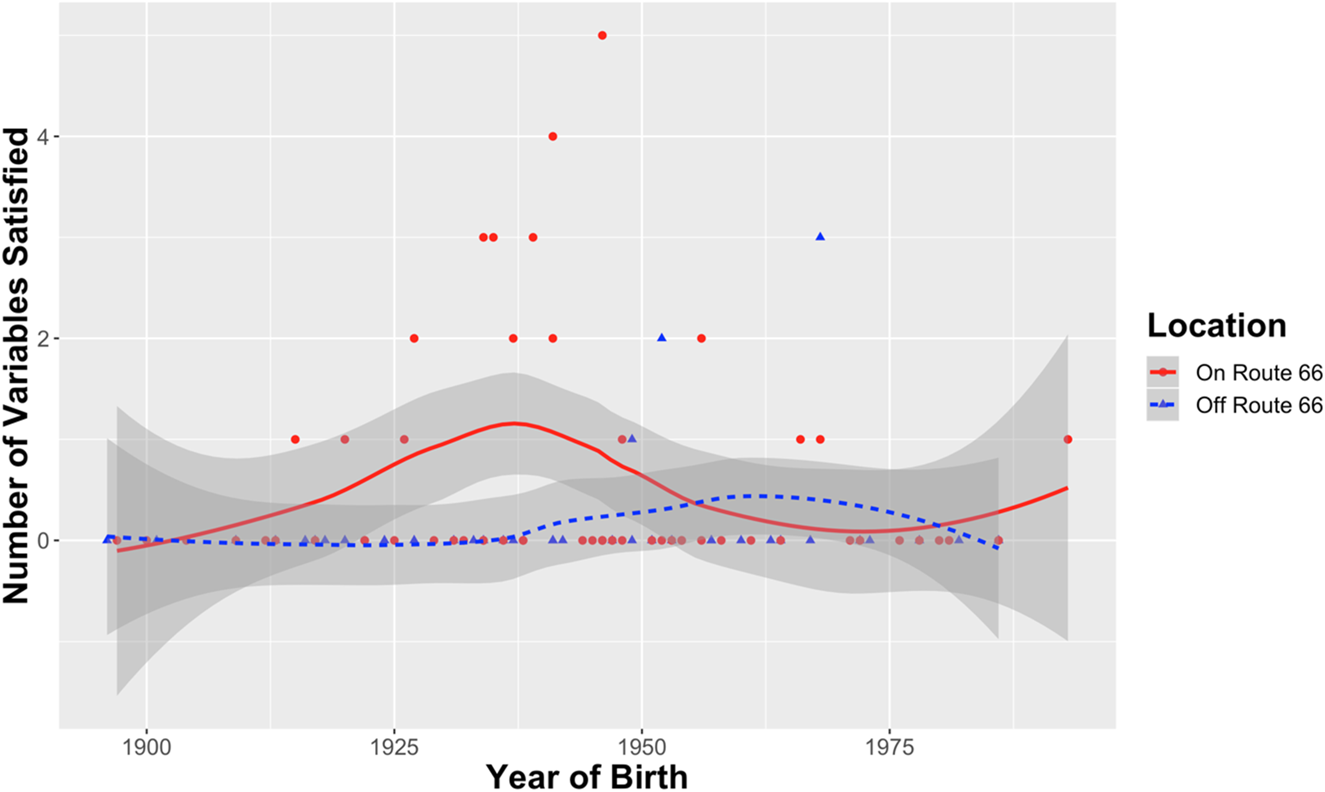
In respect to the social geography of the Corridor, Friedman drew a strong distinction between communities located on or very nearby Route 66 (henceforth On-Route communities), including the major cities Bloomington-Normal, Springfield, and St. Louis, and communities located farther out (henceforth Off-Route communities), which both Friedman and the ANAE noted have adopted the NCS features more sporadically. Friedman found that Northern Cities features manifest predominately in just one generation of speakers born in On-Route communities peaking in the late 1930s and again in speakers born Off-Route about one generation later. Importantly, the NCF never enjoyed dominance in the Corridor even at its peak, and, as a result, they never gained a sufficient footing in the population to surpass the incipient phase of change. The lines in Figure 3 show the general staggered two-peak pattern in terms of number of ANAE criteria satisfied in apparent time by individuals’ birth years.
Penetration of Northern Cities Features in the St Louis Corridor (Red/solid/circle = On-Route; Blue/dashed/triangle = Off-Route). Created from Friedman's (Reference Friedman2014) original data.

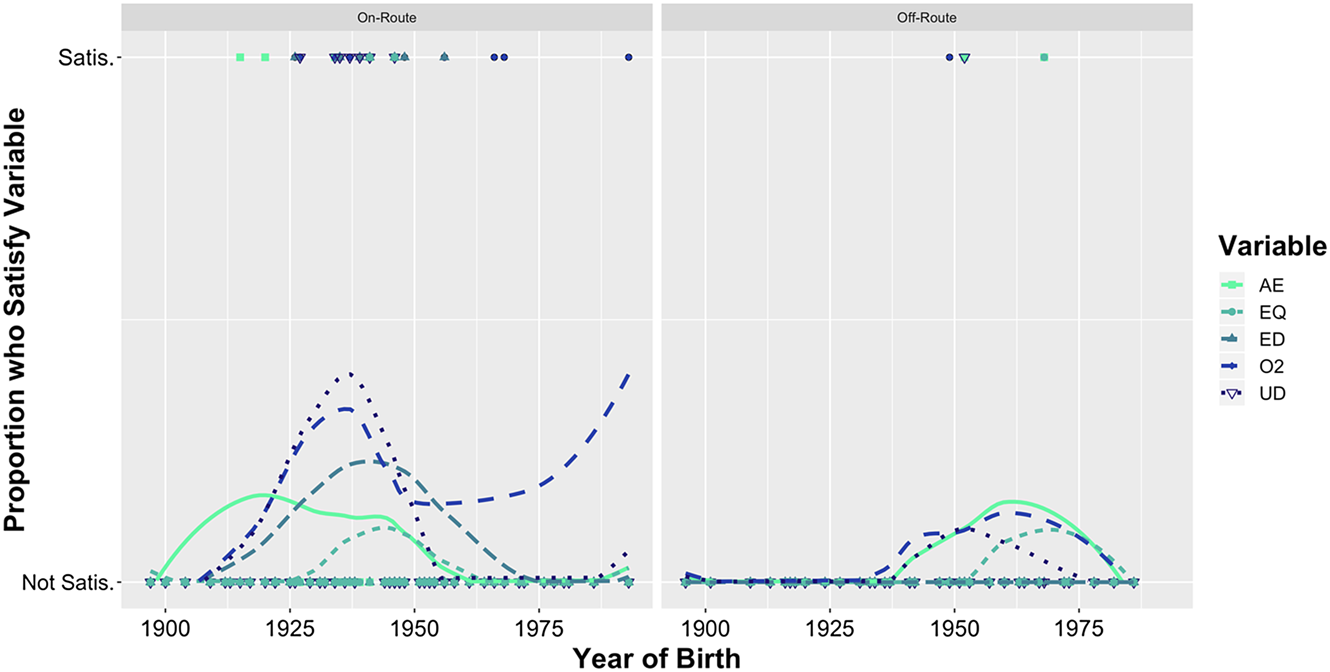
Friedman made another crucial observation: The NCF have not followed the Northern Cities Shift's systematic pattern in the Corridor in the same way that they have canonically in the Inland North (Figure 4). Instead, phases 1, 2, and 5, the raising of /æ/, /ah, o/-fronting, and /ʌ/-backing, occurred roughly simultaneously with phase 4 /e/-backing happening slightly later. The Chicago system that Durian and Cameron (Reference Durian and Cameron2018) uncovered can account for the simultaneity of stage 5 with 1 and 2 in the Corridor but still does not account for the synchronization of stages 1 or 2 or the occurrence of stage 5 before 4, nor do Gordon's (Reference Gordon2001) or McCarthy's (Reference McCarthy2010).
Parallel development of each NCS variable. Created from Friedman's (Reference Friedman2014) original data. Fit lines indicate proportion of speakers who satisfy each NCS variable.

Rather than evolving over time as part of a chain shift, it appears as though individual Northern Cities features were imported into the Corridor by speakers who had already undergone the chain shift, and then locals adopted them as independent variants. This is consistent with Labov's (Reference Labov2007) observation that these features have been adopted sporadically by Corridor speakers and may be a result of the threshold problem: if migrants imported various NCS or NCS-like systems, there may not have been enough evidence in the input for children to uniformly acquire any particular system faithfully. This suggests the NCF in the Corridor should not be represented as a chain shift. At best, their status remains unresolved.
COMPUTATIONAL FRAMEWORK
This section reviews frameworks for simulation of linguistic variation in populations, introduces and motivates a computational network-analytic framework applied here, and begins to describe how it should be applied to the problem at hand.
Existing Frameworks
Researchers have used computational modeling to investigate the population dynamics of linguistic variation since computers first became powerful enough to do so (Klein, Reference Klein1966). I find it useful to group the various frameworks that have been implemented into three classes according to the ways in which they simulate populations: swarm, network, and algebraic frameworks.
Swarm frameworks are often what people mean when they discuss agent-based modeling (ABM). They represent populations as collections of agents placed on a grid that “swarm” randomly according to some movement function and “interact” whenever they occupy adjacent grid spaces. The grid is like a map, in that agents that are farther away in space are less likely to interact unless some additional parameters are used to indicate where agents should travel over the grid or which agents with which they should primarily interact. Interaction probabilities are inherently gradient because agents are more likely to interact with one another the closer together they are placed on the grid, so swarm frameworks automatically model Bloomfield's (Reference Bloomfield1933) principle of density. On the other hand, these models provide little control over network structure, since agents are unconstrained on the grid unless the researcher explicitly defines constraints on them, and each of these constraints constitutes an extra parameter that should be motivated. And since each agent moves randomly at each iteration, these models have potentially thousands of degrees of freedom. Examples of swarm models include Nettle (Reference Nettle1999), which investigates the role of social selection in change, Satterfield (Reference Satterfield2001), which studies the emergence of creoles, Harrison, Dras, and Kapicioglu (Reference Harrison, Dras and Kapicioglu2002) on the development of vowel harmony, and the Stanford and Kenny (Reference Stanford and Kenny2013) study on chain shifts.
Network frameworks model speakers as nodes in a graph and interaction probabilities or social valuations as weighted edges between them. These offer precise control over population structure, because the researcher can indicate exactly who should be allowed to interact with whom and to what extent just by adding or removing edges instead of defining movement constraints. However, all of this comes at the cost of fluidity of interaction, which is typically restricted to nodes that share direct edges between them. To achieve the gradient interaction probabilities of swarm frameworks, one would need to deliberately and intricately construct a network with carefully placed and weighted edges. This quickly becomes unfeasible to do, because in a network with n nodes, there are roughly n 2 edges that would have to be defined. On the other hand, network models are like swarm models in that they tend to have thousands of degrees of freedom since most simulations proceed one interaction at a time by some random weighted process (e.g., Blythe & Croft [Reference Blythe and Croft2012: section 6]), and this can be very slow when simulating large populations. Owing to the fine-grain control that researchers have over their implementation, network frameworks have proven useful in uncovering the role of social dynamics in the propagation of change. Network frameworks have been implemented for a range of purposes, including Baxter et al. (Reference Baxter, Blythe, Croft and McKane2009), Blythe and Croft (Reference Blythe and Croft2012), and Kauhanen's (Reference Kauhanen2016) models of neutral change, among others, Minett and Wang (Reference Minett and Wang2008) on language competition, and Fagyal, Swarup, Escobar, Gasser, and Lakkaraju's (Reference Fagyal, Swarup, Escobar, Gasser and Lakkaraju2010) work on socially derived S-curves and the respective roles of well-integrated and less integrated community members.
Finally, algebraic frameworks analytically calculate the state of an entire population at each iteration. That is, instead of simulating individual interactions between speakers, they calculate what would have happened if they simulated them for a single time step in terms of statistical expectation. This is a significant advantage, because they directly calculate what other frameworks can only hope to statistically approximate. However, algebraic frameworks have one deal-breaking drawback for the present purposes: they are defined for perfectly-mixed populations with no network effects. They exchange the ability to model social networks for clean and interpretable mathematics to further our understanding of the fundamental dynamics of change. For example, though Baxter et al. (Reference Baxter, Blythe, Croft and McKane2006) and Minett and Wang (Reference Minett and Wang2008) implemented algebraic frameworks for perfectly mixed populations, they fall back on network frameworks to model more interesting population structures. Niyogi and Berwick (Reference Niyogi and Berwick1996, Reference Niyogi and Berwick1997, Reference Niyogi and Berwick2009) defined a general analytic framework for language change that conceives of nodes as child learners. Yang (Reference Yang2000) also focused on acquisition and was heavily inspired by population genetics and evolutionary biology, and at least some iterated learning models fit here as well (e.g., Kalish, Griffiths, & Lewandowsky, Reference Kalish, Griffiths and Lewandowsky2007).
Our Network-Analytic Framework
Algebraic frameworks have their mathematical advantages but do not model population structures, network frameworks provide fine-grained control over the population structure but can be intractable, and, while swarm frameworks are convenient and lend themselves to density effects, they lack fine-grained controls unless they are over-specified with parameters. An ideal framework would combine the benefits of all of these while mitigating their drawbacks. The following section summarizes the present attempt at such a framework: a network-analytic approach that defines a network structure over which it calculates swarm-like effects algebraically. A walkthrough of the mathematical implementation of the model is provided in the first section of the online Appendix, along with the full details provided in Kodner and Cerezo Falco (Reference Kodner and Cerezo Falco2018).
It may be easiest to understand the concept behind the framework by setting the algebraic component aside for the moment and thinking about it in terms of random interactions instead. We start by imagining a network graph with nodes representing locations, with an individual at each one and weighted edges between them representing connections between them. At each iteration, every individual has a chance to “travel” along these edges and to select some other individual with whom to “interact.” Individuals are more likely to travel along edges with higher weights, and, after every step, they can decide to stop and interact with the individual at that location or continue along some other edge. After every step, the probability of taking another step decreases so that individuals with high-weight connections between them are more likely to interact than those with lower weighted ones, and those with short paths between them are more likely to interact than those with only long paths connecting them. After traveling and interacting, each individual returns home. This process captures the principle of density like a swarm framework would, yet by defining these likelihoods in terms of edge weights, it offers the fine-grained control of a network framework. Algorithm 1 summarizes this conception of the interaction process.

algorithm 1. The Kodner and Cerezo Falco (Reference Kodner and Cerezo Falco2018) propagation model conceptualized on the level of a randomly moving individual agent.
One can think of the algebraic component of this framework as calculating the statistical expectation of what would have happened if this randomized agent-level algorithm were run for very many trials. It defines the linguistic environment (E) available to each agent, after which some learning model can be applied to calculate (G), which variants each individual adopts given that environment, which then goes into the calculation of the environment for the next iteration. This creates a two-step alternating cycle between external social dynamics and linguistic dynamics that drives language change (Figure 5).
The two-step cycle of language change as an alternation between the linguistic environment and individuals’ linguistic knowledge.

MODELING THE ST. LOUIS CORRIDOR
The process of choosing assumptions is important in this line of work regardless of the framework used or the specific problem in question. Choosing between appropriate assumptions can be challenging, especially because some choices are not obvious from the empirical data. The number of connections per person and the α parameter in our implementations are good examples of this, as are the homing instinct parameters, areas of influence, and traffic flow rates in Stanford and Kenny's (Reference Stanford and Kenny2013) implementation. As a general rule, the fewer of these unmotivated or hard-to-motivate assumptions the better, and, when possible, it should be shown that these do not have a meaningful effect on the simulation's outcome.
It is often the case that multiple plausible decisions conflict with one another, such as different representations for the variable or learning model. This is challenging, because a plausible assumption grounded in the real phenomenon being simulated may sometimes force the model to make less plausible ones later on. Running multiple simulations under different assumptions while introspecting on their quality is an effective way to sort through them, though no amount of experimentation and introspection can ever totally resolve the problem.
The Variable
The Northern Cities Features measure the movement of vowels around the vowel space, so the most obvious choice here is to model a continuous variable and represent it in a one-dimensional space, as Stanford and Kenny (Reference Stanford and Kenny2013) did (equivalent to F1, F2, or some linear function of those like F2-F1). Most simulations assume that this variable is neutral, that is, without social or cognitive advantage or disadvantage (Blythe & Croft, Reference Blythe and Croft2012; Kauhanen, Reference Kauhanen2016; Labov, Reference Labov2001), though I consider the implications of advantaged change later on. I also entertain the alternative acquisition model expounded in Yang (Reference Yang2009) and discuss its relative strengths and weaknesses in conjunction with the Corridor's network model. Noting that the features corresponding to NCS phases 1, 2, and 4 pattern together in the corridor rather than as part of a chain shift, I model a single variable that can stand in for any or all of these instead of attempting to model a chain shift.
The network-analytic model does not itself impose a hard distinction between transmission from adults to children and diffusion of linguistic variants among adults (Labov, Reference Labov2007), so its utility in discriminating between the two is limited except in circumstances where the learning algorithm enables a particular interpretation. In the simulations applied here, diffusion is used to describe situations where nodes are updated by some kind of frequency matching following propagation of variants by “traveling” and when the state of the network is measured as a whole, since it does not force a distinction between child and adult nodes. Transmission is applied when  ${\cal A}$ is implemented overtly as a language acquisition model and when only nodes that have been recently updated are measured, since these can be thought of as children. Migration describes the situation where the language of one node is wholesale replaced by another as though a new person moved to that node and displaced the old one.
Network Structure
The model must differentiate between the Inland North (especially Chicago), the Midlands outside the Corridor, and On-Route and Off-Route communities in the St. Louis Corridor, and each individual community needs to be connected to the others in such a way as to simulate the Corridor region. Two models are implemented for comparison at different levels of abstraction. First, I construct a Geographic Model that instantiates the four community types according to the physical geography of the Corridor. The communities defined in that model are loosely modeled on specific cities and towns in the region in terms of relative size and placement in order to give the geographic model a more concrete interpretation. Second, I develop a Schematic Model that captures the essence of the Corridor's shape without explicitly modeling specific communities. It arranges On-Route and Off-Route community types linearly to capture the Corridor's shape, but all communities are the same size to abstract away from the specifics of the region. These two models address an important trade-off between model specificity and generalizability. A more detailed geographic model is less likely to miss an important factor that a more schematic model abstracts away, but it requires many more parameters to define its network, and, as such, is more prone to overfitting.
Time progresses in these simulations as a series of discrete time steps or iterations, once per calculation of the environment function. These iterations are abstract, but they can be calibrated by setting the α parameter so that the iterations are roughly equivalent to years for the purposes of comparison with Friedman's results. Furthermore, rather than updating the whole network at once, only a fraction of nodes are updated at the end of every iteration so that the updated individuals can be thought of as children. To handle migration, some proportion of the nodes are replaced with “migrant” speakers whose variable values correspond to those of their source locations rather than their new locations.
A Geographic Model
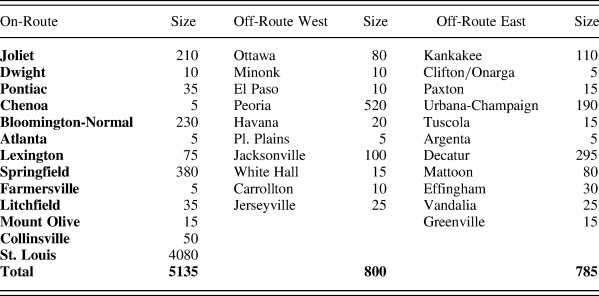
The Geographic Model approximates the St. Louis Corridor at 1:200 scale with fifty-four communities, as enumerated in Table 1. In selecting the communities to be included, a preference was given to those with at least 1,000 inhabitants in 1940 that saw population increase in the preceding decade. Populations were rounded to the nearest thousand before they were scaled so that their populations are all multiples of 5. At 4,080 nodes, St. Louis is by far the largest Corridor city and larger than the rest combined. A 1:200 scale was chosen because 6,735 nodes is large enough to reveal interesting network dynamics while remaining small enough to be tractable to compute (Kodner & Cerezo Falco, Reference Kodner and Cerezo Falco2018).
St. Louis Corridor communities and 1:200 1940 population sizes implemented in the geographic network model

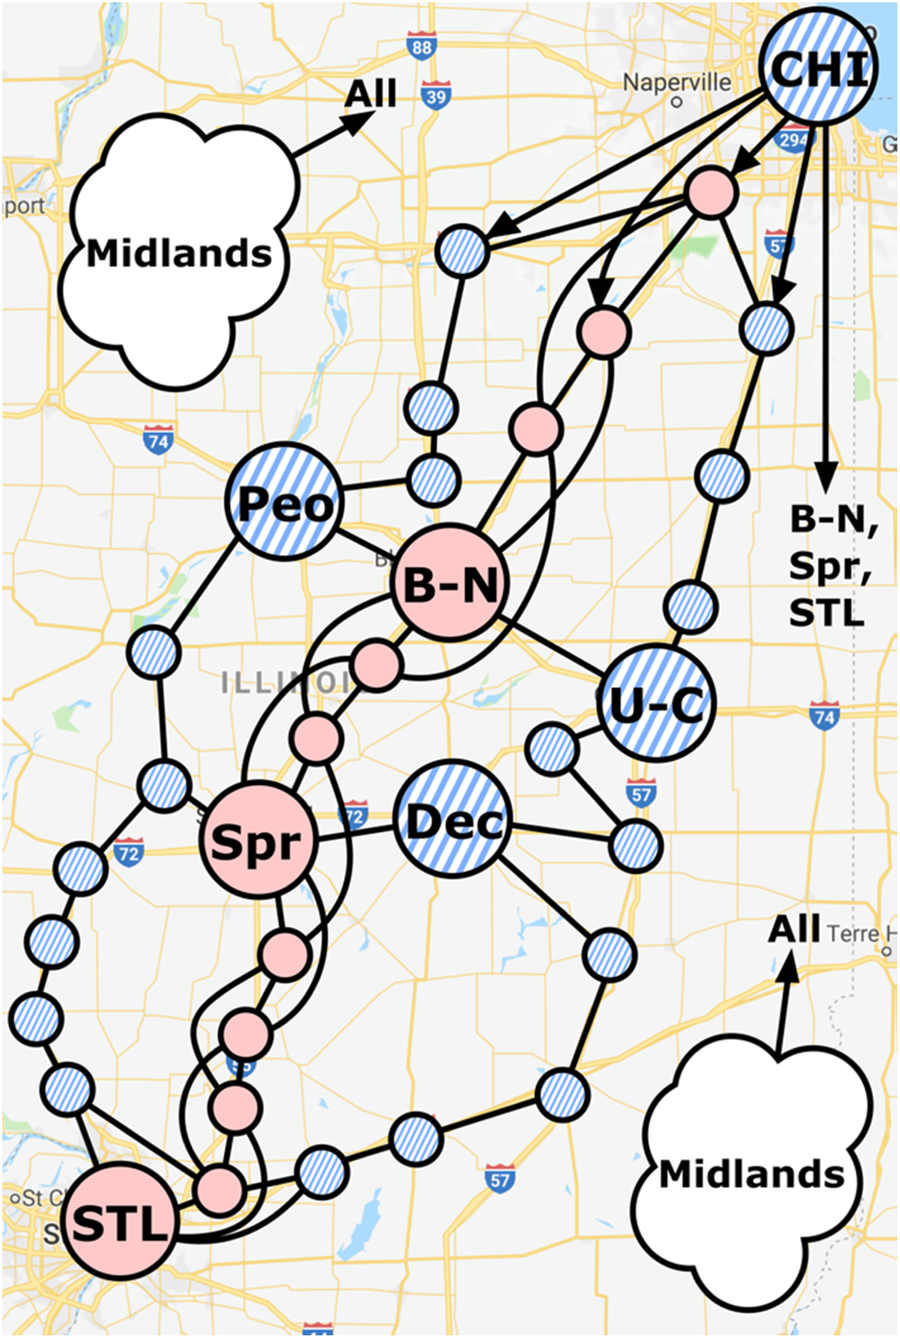
The high-level topology of the network is illustrated on top of a map of Illinois in Figure 6 with On-Route communities highlighted in solid red and Off-Route communities in hatched blue. Each On-Route city is connected to the two nearest cities to its north and south, while each Off-Route community is only connected to the communities to its immediate north and south. The extra connections between On-Route cities are meant to represent Route 66 as the primary thoroughfare through the area and allow more “travel” between the On-Route communities than through the Off-Route communities. The weight of connections between cities can be varied over the course of a simulation to model changes in traffic flow. Additional connections are made with Joliet and Ottawa and Kankakee, Springfield with Decatur to its east and Jacksonville to its west, Bloomington-Normal with Urbana-Champaign to its east and Peoria to its west, and St. Louis and Collinsville with Jerseyville and Greenville. One-way connections are added from Chicago to the northernmost On-Route communities and Off-Route communities, to Bloomington-Normal, Springfield, and St. Louis to capture the historical importance of these cities. One-way connections are also added from a community representing the Midlands to all Corridor communities to allow for diffusion from the surrounding area that allow us to model Chicago and the Midlands as very large entities relative to the rest of the Corridor without having to represent them explicitly in the network. This is reasonable since we are not interested in the internal dynamics of those areas, just the effect that they had on the Corridor. If Chicago were included in the network, its population would be 16,980, much larger than the rest of the network combined.
Geographic Model superimposed on a map of Illinois. On-Route communities indicated in solid/red and Off-Route communities in hatched/blue.

Every city is divided into clusters of at most 20 individuals each, acknowledging the fact that social connections in large communities are not homogeneous. Connections within each cluster are generated randomly by a Gaussian distribution that results in centralized clusters with some core members and some peripheral members. Connection weight is increased whenever the same connection is laid down multiple times, which means that core community members tend to have more robust connections as well as more of them.
Direct connections within clusters may be thought of as strong connections in the sense of Milroy and Milroy (Reference Milroy and Milroy1985), and connections between clusters are more similar to weak connections. The clusters themselves are joined in a similar fashion as individuals, picking two clusters according to a Gaussian distribution and then picking two individuals from those clusters. This creates a network where some of the clusters are more tightly integrated into the wider community than others, some clusters’ best integrated members have weak connections to members of other clusters, while others are only connected to one another via their peripheral members. Beyond adding realism to the network, this has implications for how variants should propagate through the network. Well-integrated center members stand to propagate new variants more rapidly relative to poorly integrated loners (Fagyal et al., Reference Fagyal, Swarup, Escobar, Gasser and Lakkaraju2010), so if the network happens to be set up such that well-integrated community members tend to have weak connections with other communities, then change will progress faster than if less well-integrated members tend to have weak connections.
A Schematic Model
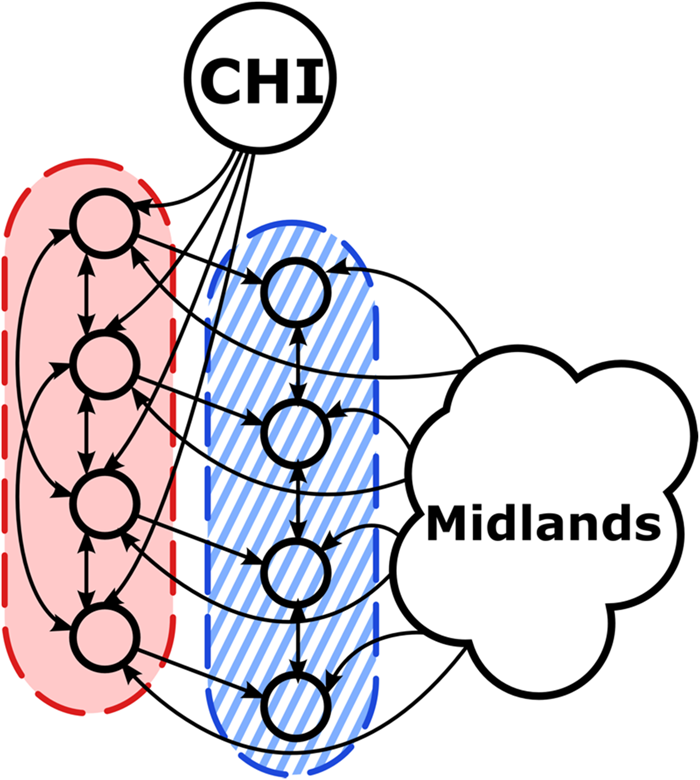
The main takeaway from the Corridor's geography is its more-or-less linear shape along a central thoroughfare. If that topology is the truly relevant aspect of the Corridor, then simulation results that hold under the Geographic Model should hold without its finer details as well. This is investigated here by constructing a schematized corridor network that contains 720 nodes divided into 40 communities of 18 nodes each. One community is reserved for Chicago and one for the Midlands which leaves 19 On-Route and 19 Off-Route communities highlighted in solid/red and hatched/blue in Figure 7. The On-Route communities are arranged in a line, and each community is connected directly to the two communities above and the two below it. This “stepping-stone” structure represents Route 66 and is a common model employed to study diffusion in population genetics and other fields (Nei, Reference Nei1972; among others).
High-level Schematic Model network setup with On-Route communities in solid/red (left) and Off-Route communities in hatched/blue (right). The full network has nineteen red and nineteen hatched-blue communities arranged in this fashion.

Each On-Route community is then connected to one Off-Route community representing the nearby areas that one can travel to directly from the On-Route community, and each Off-Route community is connected to one other to form a minor line running parallel to Route 66. Chicago is then connected directly to each On-Route community because those are directly reachable from Chicago on Route 66, and the Midlands to all On- and Off-Route communities because the Corridor is embedded in the Midlands. As with the Geographic Model, Chicago and the Midlands only have outgoing connections so that they can be treated as extremely large populations with irrelevant internal dynamics. Each cluster is set up in a centralized fashion as before.
SIMULATIONS
I run a sequence of simulations with increasingly complex historical assumptions in order to pinpoint which of them are sufficient at a minimum for the model to achieve the empirically attested staggered two-peak path of change.Footnote 2 Simulation 1 employs only diffusion of a neutral variable modulated by historical traffic patterns on the Geographic Model. In demonstrating that the traffic patterns themselves relate to the rate of change but not direction, it suggests that other processes such as migration are crucial to the Corridor's linguistic history. Simulation 2 adds waves of migration to On-Route but not Off-Route communities and shows that this does create a staggered two-peaks path of change. However, because the behavior of Off-Route communities is still entirely dependent on diffusion from On-Route communities, the peaks cannot be pulled far enough apart in time to match the historical pattern. The simulation is performed both on the Geographic and Schematic Models to demonstrate that the high-level shape of the Corridor is responsible for the results rather than the specific modeling assumptions of the Geographic Model. These first two simulations rule out certain minimalist hypotheses and indicate that a more complex model is required.
Simulation 3 manipulates migration in conjunction with a strongly advantaged NCS variable. With this extra degree of freedom, the model can successfully pull apart the On-Route and Off-Route peaks to yield the expected staggered two-peak pattern but only with massive sustained migration from the Midlands continuing into the present day. Simulation 4 succeeds as well by returning to neutral change and including migration of “adult” speakers from On-Route to Off-Route communities. It models transmission by only considering recently updated nodes. Finally, Simulation 5 repeats the qualitative success from Simulation 3 and 4 by introducing the threshold learning model and removing substantial migration from the Midlands.
Simulation 1: Propagation by Diffusion Only
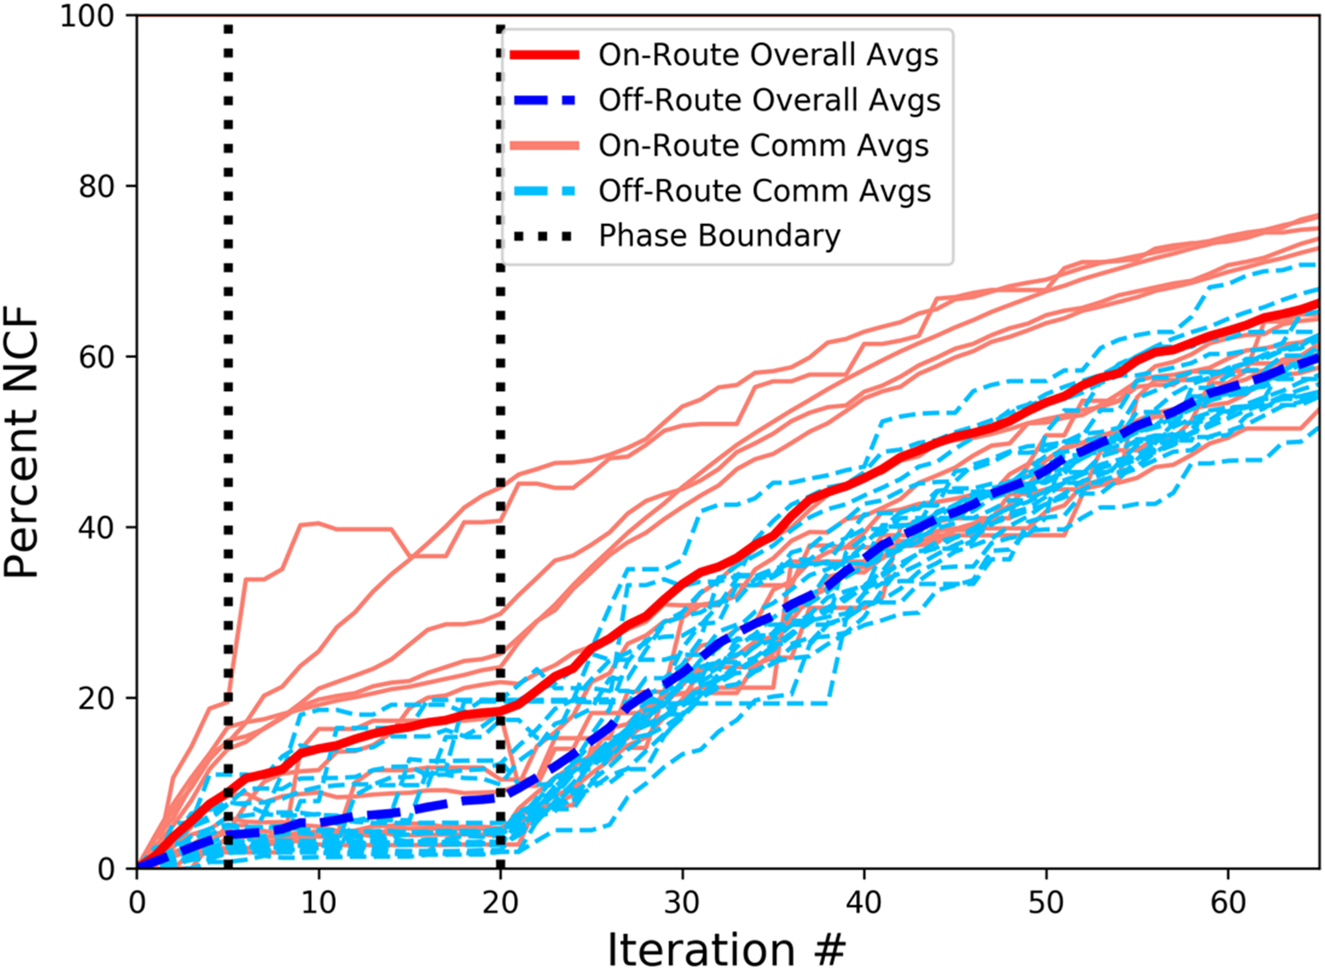
This simulation uncovers how a variable behaves when it is propagated throughout the Geographic Model by interpersonal interaction without additional constraints. Noncommercial traffic flow in the Corridor, which is taken to represent the availability of interaction across cities, was at a minimum along most routes during the Great Depression, was slightly higher at the start of the Depression, and was multiple times higher in the decades after it. In order to model this, the simulation is divided into three phases with different traffic flow rates in each, represented as the strength of intercommunity connections (2). The effect of changing these values turns out to be fairly weak, so traffic rates are varied by a factor of 100 here for illustrative purposes.

The NCF variable diffuses more rapidly to communities with more direct connections (i.e., more direct traffic flow) from Chicago than to those which are farther removed. On average, the Chicago variant is expressed more strongly in On-Route communities (solid red lines in Figure 8) than it is in Off-Route communities (dashed blue lines), but there are exceptions. In particular, small On-Route communities that are not directly connected to Chicago, St. Louis, Springfield, or Bloomington-Normal pattern more like Off-Route communities. Bloomington-Normal, Springfield, and St. Louis, which are destination cities that receive traffic directly from Chicago, show higher diffusion rates than the other cities.
(Simulation 1) Percentage of speakers exhibiting NCS On-Route (solid/red) and Off-Route (dashed/blue) by iteration. Individual community clusters are traced in light solid/red and light dashed/blue. Dashed lines indicate simulation phases. On-Route cities with direct Chicago connections are consistently above the On-Route average.

The rate of change can be modulated for both Corridor community types by increasing or decreasing traffic flow from Chicago or the Midlands, but there is no way to change the direction in one community type but not the other mid-simulation, so there is no way to create a staggered pattern. These results suggest that traffic flow is not a deciding factor in achieving that pattern and that our modeling assumptions in regard to traffic flow do not crucially affect simulation outcomes. Additionally, a simple model of diffusion that relies primarily on the interaction between Corridor speaks and visiting Chicagoans cannot explain the attested pattern.
Simulation 2: Migration from Chicago On-Route and Diffusion Off-Route
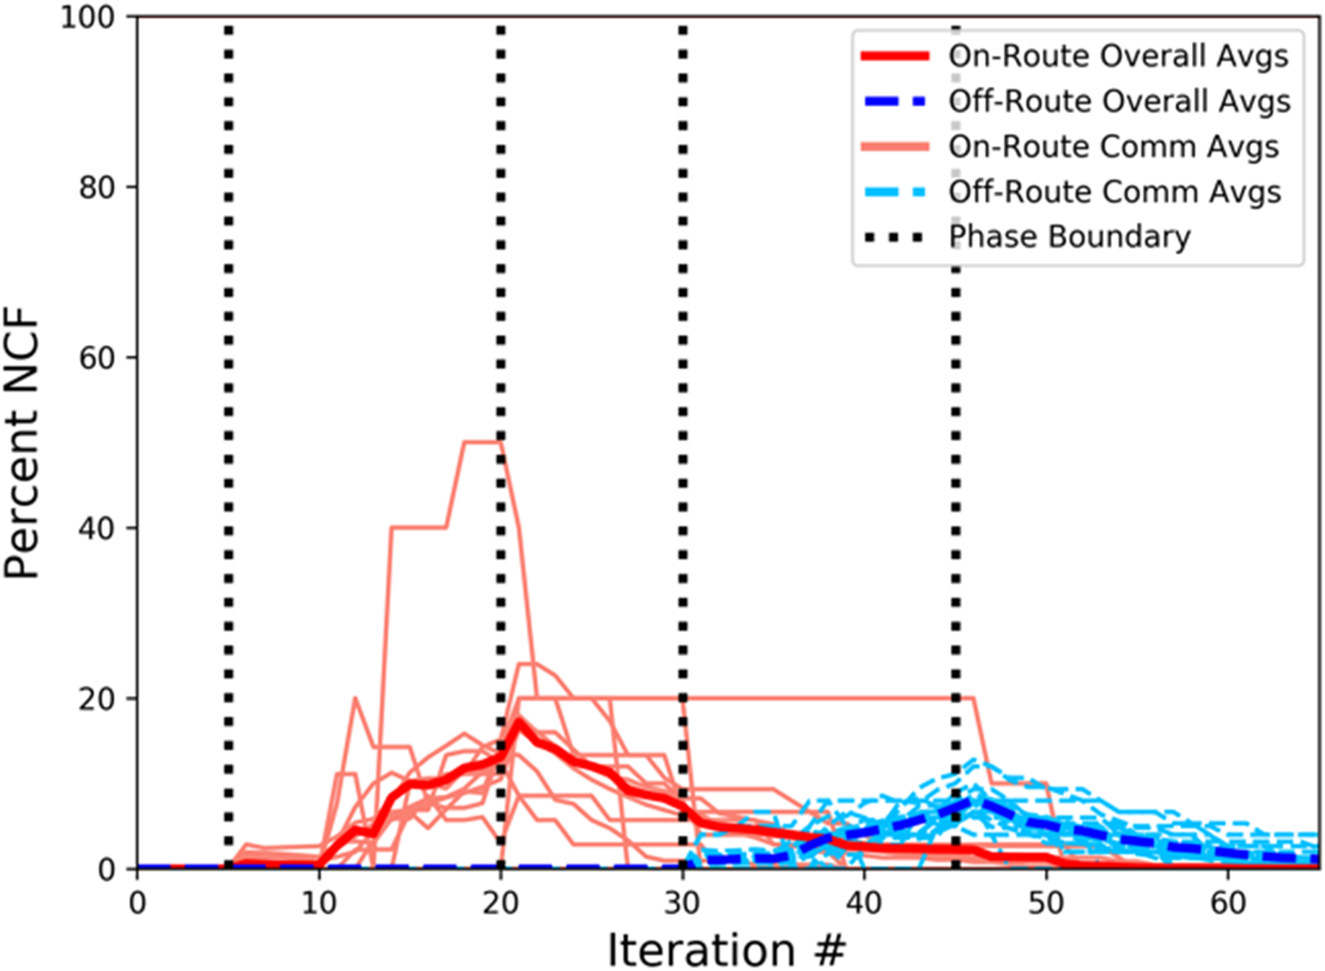
Simulation 2 introduces a single additional parameter, the direction of migration to On-Route communities, that accounts for most of the difference between the previous experiment and the desired outcome. In this model, Midlands speakers migrate to both community types consistently through the simulation, but Chicago speakers migrate to the On-Route communities during a phase representing population movements during the Depression. Diffusion from Chicago is still possible since the communities are still connected, but it is secondary to migration in importing the NCF to the On-Route communities. Once again, there are three simulation phases.

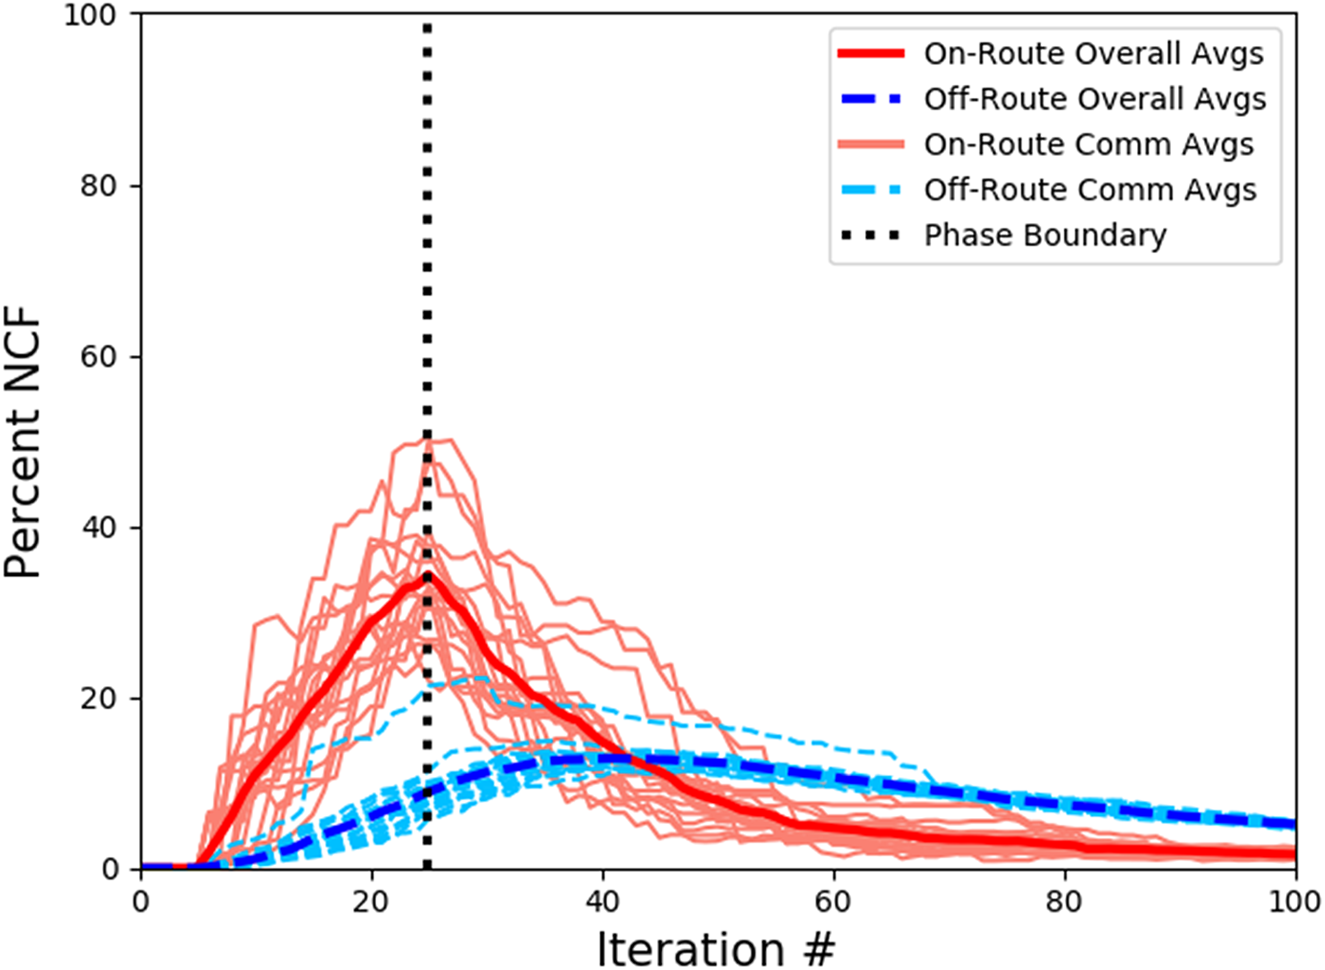
This experiment does produce a staggered two-peak system: On-Route (solid red) peaks both higher and earlier than Off-Route (dashed blue), because only On-Route communities receive migrants from Chicago while Off-Route communities rely on diffusion. Two anomalies in the result are due to the simple nature of this simulation. First, the sharp peak On-Route is because of the sudden change of simulation phase. In the real world, migration patterns would change gradually, not dramatically reverse overnight. Second, a few individual On-Route communities show aberrant and quantized behavior. These are small communities with only a handful of simulated agents at 1:200 scale, so if even a couple nodes change their variants, the community average changes rapidly.
The higher the rate of NCF is in On-Route communities, the faster it can propagate to Off-Route communities, and as long as there is more NCF On-Route than Off-Route, it will continue to diffuse. However, since only non-NCF speakers migrate into the system during Phase 3, as soon as there is less NCF On-Route than Off-Route, the rate Off-Route will start to be pulled down as well. This is why we see the Off-Route rate change direction at the exact point that the On-Route and Off-Route rates cross around iteration 35. The simulation results in Figure 9 technically satisfy a staggered two-peak pattern, but it fails to reproduce certain details: even though the Off-Route peak is lower and later than the On-Route peak, the Off-Route rate should be negligible until after the On-Route rate peaks, and it should continue to rise for a while even after it is higher than the On-Route rate.
(Simulation 2, Geographic Model) Percentage of speakers exhibiting NCS On-Route (solid red) and Off-Route (dashed blue) by iteration. Individual community clusters are traced in light solid red and light dashed blue.

When run on the Schematic Model, the results are nearly identical as shown in Figure 10. We can be confident that the results of the simulations are not crucially due to decisions made when constructing the Geographic Model. And again, altering the rate of diffusion to Off-Route communities can yield a lesser peak, but it will always occur too early.
(Simulation 2, Schematic Model) Percentage of speakers exhibiting NCS On-Route (solid/red) and Off-Route (dashed/blue) by iteration. Individual community clusters are traced in light solid/red and light dashed/blue.

Simulation 3: Migration and Diffusion; Manipulating Migration with Advantaged Change
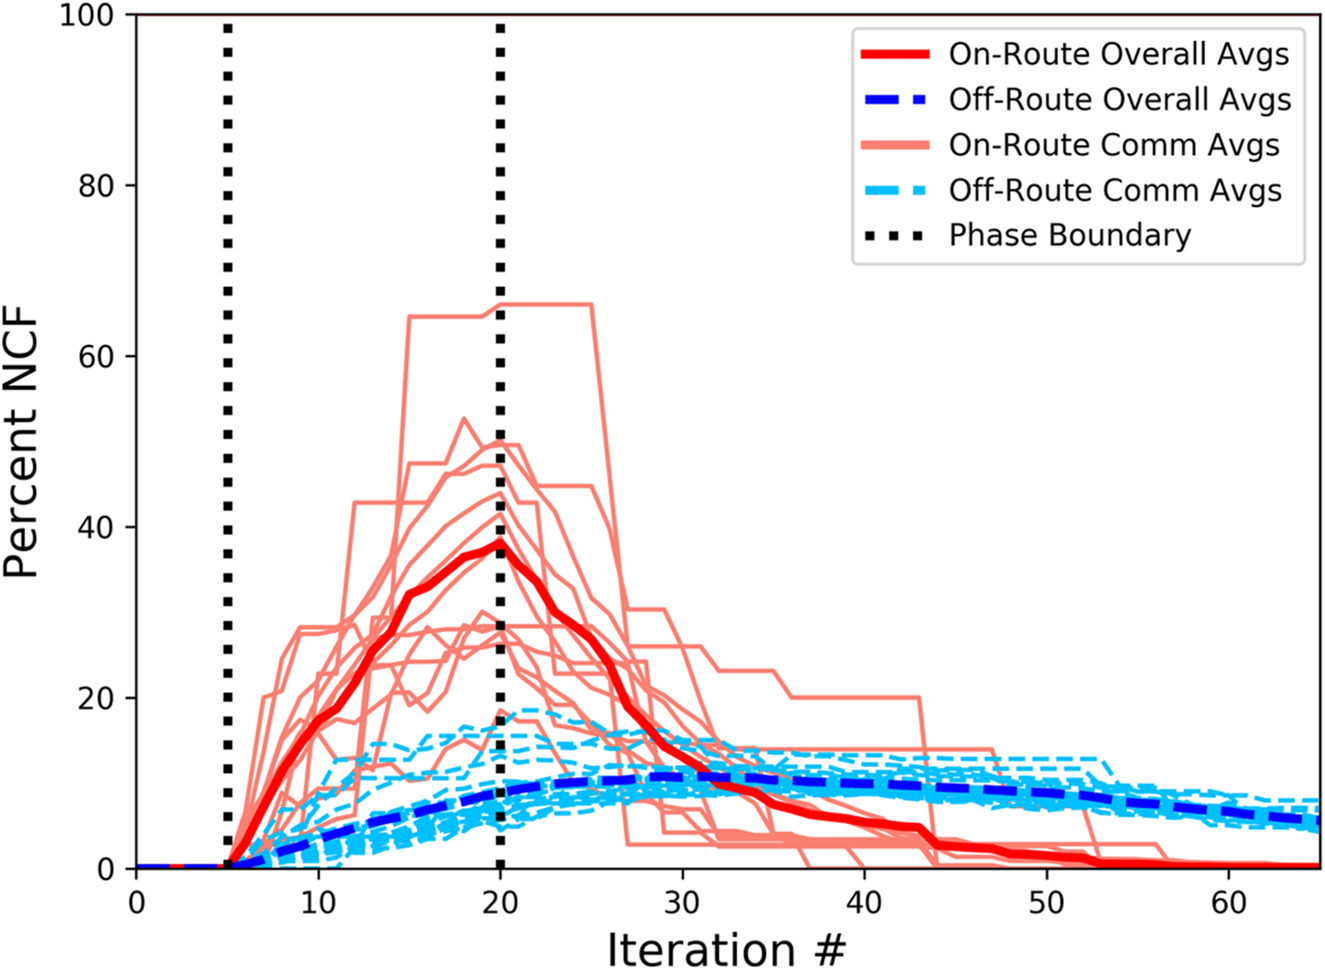
The NCF needs to be able to rise Off-Route well after it has declined On-Route, which can be accomplished by adding an advantage (learning, social, or otherwise) to the NCF variant so that, once it enters the Off-Route communities, it continues to rise somewhat independently of whatever is happening On-Route. Additionally, the rate of NCF Off-Route should not begin to appreciably increase until after the On-Route rate is past its peak. These goals are actually at odds with one another, because, if the change has an advantage behind it, it will diffuse even faster than it would if it were neutral. We can handle this with a dramatic curtailment of traffic flow during the Depression to counteract the advantage by shutting down diffusion across communities. This simulation applied to the Geographic Model is accomplished with four phases:

The extra degrees of freedom afforded by this fourth phase and advantaged change finally allow the model to produce a more realistic staggered two-peak pattern. The distance between the peaks is controlled by the point at which traffic-flow restrictions are lifted, and the height of the peaks is controlled by the advantage of the change and how long the phases are allowed to last.
Advantaged change is implemented following Niyogi and Berwick (Reference Niyogi and Berwick1996, Reference Niyogi and Berwick1997).Footnote 3 And, crucially, in order to prevent the NCF from taking off too early Off-Route, intercluster connections representing traffic flow in Phase 2 are made 1/1000th as strong as they are in the other phases. That 1000-fold traffic flow factor is required to prevent the NCF from rising in Off-Route communities at the same time that it rose in On-Route ones. Figure 11 shows the result of the advantaged simulation with minimal diffusion, and Figure 12 shows diffusion at the same rate as the previous simulations.
(Simulation 3) Percentage of speakers exhibiting NCS On-Route (solid/red) and Off-Route (dashed/blue) by iteration. Individual community clusters are traced in light solid/red and light dashed/blue with minimal diffusion and (Right) with diffusion rates identical to Simulations 1 and 2.

(Simulation 3) Percentage of speakers exhibiting NCS On-Route (solid/red) and Off-Route (dashed/blue) by iteration. Individual community clusters are traced in light solid/red and light dashed/blue with diffusion rates identical to Simulations 1 and 2.

Simulation 4: Migration from Chicago On-Route and Migration from On-Route Off-Route; Manipulating Migration
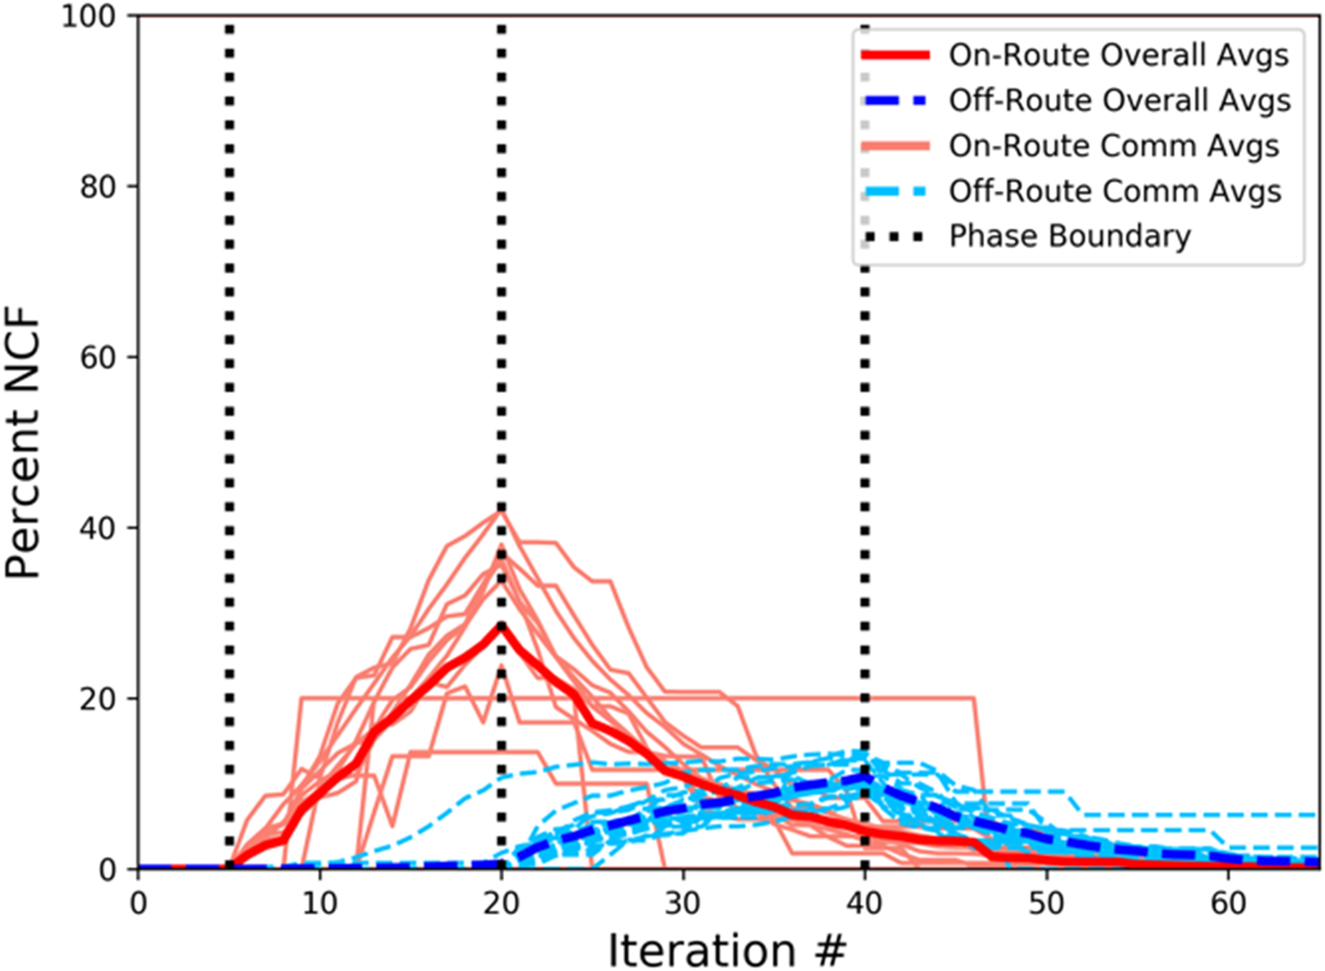
This experiment provides an alternate scenario that relies on migration instead of advantaged change where the NCF was transmitted to some On-Route children during the Depression, and some of those children moved to nearby Off-Route communities as adults and transmitted the NCF to some of their children; but it failed to gain a sufficient foothold in either place. This simulation is accomplished in five phases (5). Overall, it is similar to the previous two experiments, but intercluster connections are kept fairly low throughout the simulation to prevent too much early diffusion, a neutral variable, and a new phase 4 iteration one “generation” after the Depression where speakers who acquired the NCF at the rate of children who were raised On-Route during the Depression migrate to Off-Route communities. This imposes a migration + transmission interpretation on the model.

Once again (Figure 13) the simulation is able to reproduce the expected staggered two-peak pattern with a long delay between the On-Route and Off-Route peaks. To further show something about transmission in Figure 14, we only consider those speakers who have not migrated in the last three iterations to remove the influence of migrated adults on the plots. This, in conjunction with the linguistic assumption made in Phase 4 that speakers do not substantially advance the variable after their youths, means that the resulting plot is showing the outcome of transmission rather than diffusion.
(Simulation 4) Percentage of speakers exhibiting NCS On-Route (solid/red) and Off-Route (dashed/blue) by iteration. Individual community clusters are traced in light solid/red and light dashed/blue.

(Simulation 4) Percentage of speakers exhibiting NCS On-Route (solid/red) and Off-Route (dashed/blue) by “birth” iteration. Individual community clusters are traced in light solid/red and light dashed/blue.

Importantly, the transmission-only results show the same staggered two-peak pattern as the full community with only a slight change in the peaks’ shapes, so migration+transmission can account for the staggered two-peak NCF pattern in the St. Louis Corridor about as well as migration+diffusion+advantage can. Unlike Simulation 3 where the NCS would naturally rise because of its advantage, continued sustained migration from the Midlands is not necessary to keep the NCF rate low at the end of this simulation. The onset of NCF Off-Route begins whenever individuals are first to begin to migrate there, as shown in Figure 15, which has phase 3 removed.
(Simulation 4) Percentage of speakers exhibiting NCS On-Route (solid/red) and Off-Route (dashed/blue) by iteration. Individual community clusters are traced in light solid/red and light dashed/blue. Phase 3 is replaced with an extended phase 4 to show how the onset of NCF Off-Route is determined by the start of migration rather than the On-Route peak.

Simulation 5: Migration from Chicago On-Route and Migration from On-Route Off-Route; Manipulating Learning
This simulation applies a threshold learning model instead of varying migration and social advantage to create the staggered two-peak pattern. Following Friedman's suggestion, I employ the learning model that Yang (Reference Yang2009) applied to Johnson's (Reference Johnson2007) study of the spread of the cot-caught (lot-thought) merger at the Rhode Island/Massachusetts border by which children must hear enough of an innovative variant in their input in order to acquire it. The lower the threshold for acquisition, the more rapidly that variant can spread; so a low threshold is a kind of cognitive advantage while a high threshold is a disadvantage. Children whose parents have the innovative variant are more likely to acquire it than children with conservative parents, because a greater proportion of their input is innovative.
As it relates to the NCF in the Corridor, On-Route children of parents from the Inland North would be more likely to acquire the NCF than their peers because a larger proportion of their primary linguistic input would contain the NCF, and the later Off-Route children of those On-Route speakers would be more likely to acquire it than their peers for the same reason. Diffusion plays into children's inputs as well, so children who grow up in communities with a lot of Inland North traffic, maybe around a heavily trafficked diner in some Route 66 town as Friedman (Reference Friedman2014:28–30) discusses, are more likely to exceed that threshold too. However, unless there is enough expression of the NCF in the population at large to maintain the NCF rate above the threshold, not enough children will acquire it, and it should (almost entirely) fade out of existence.
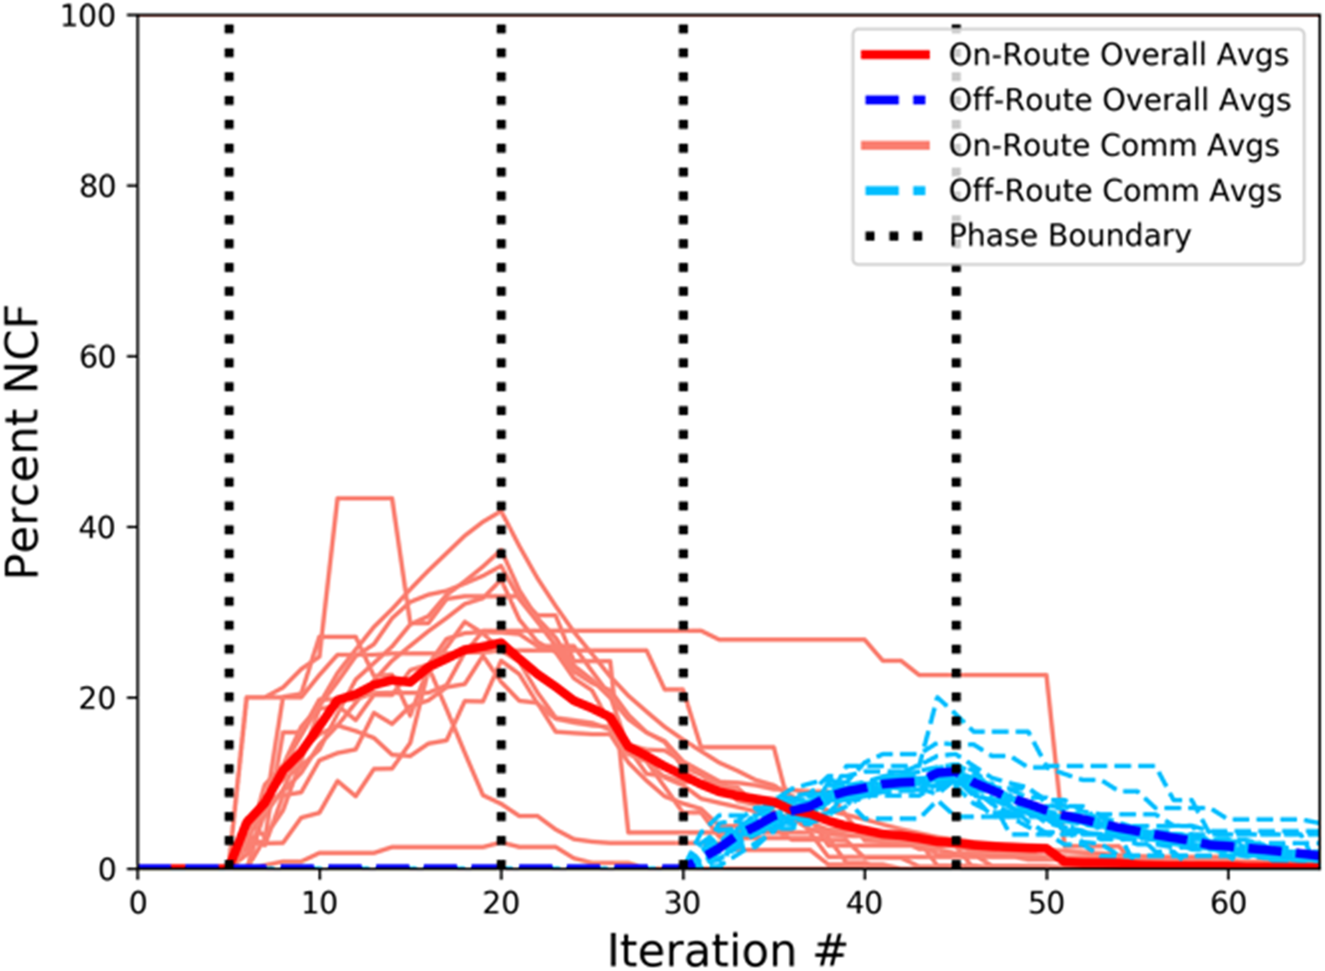
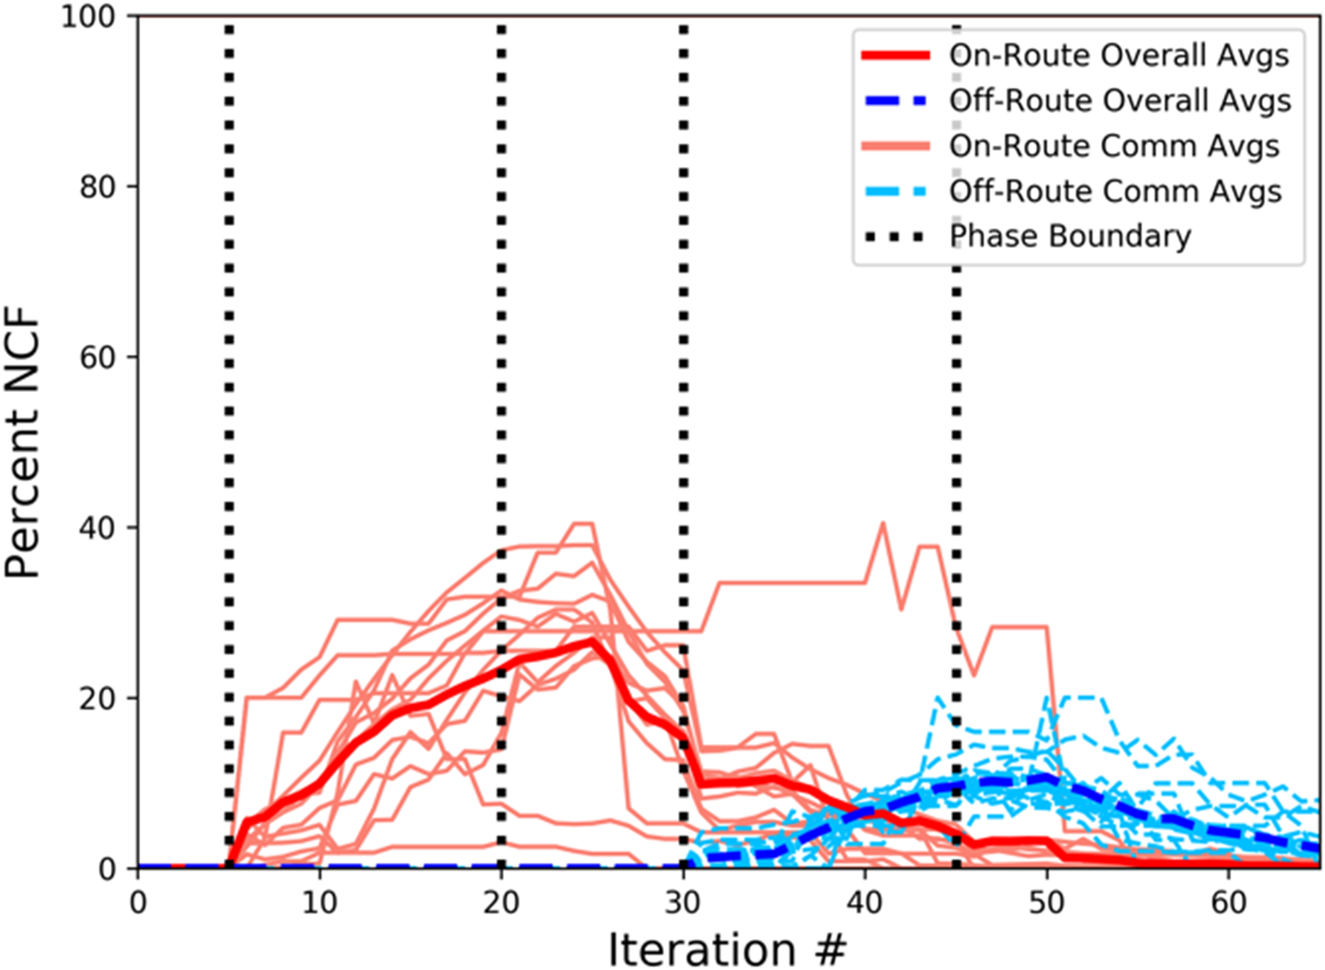
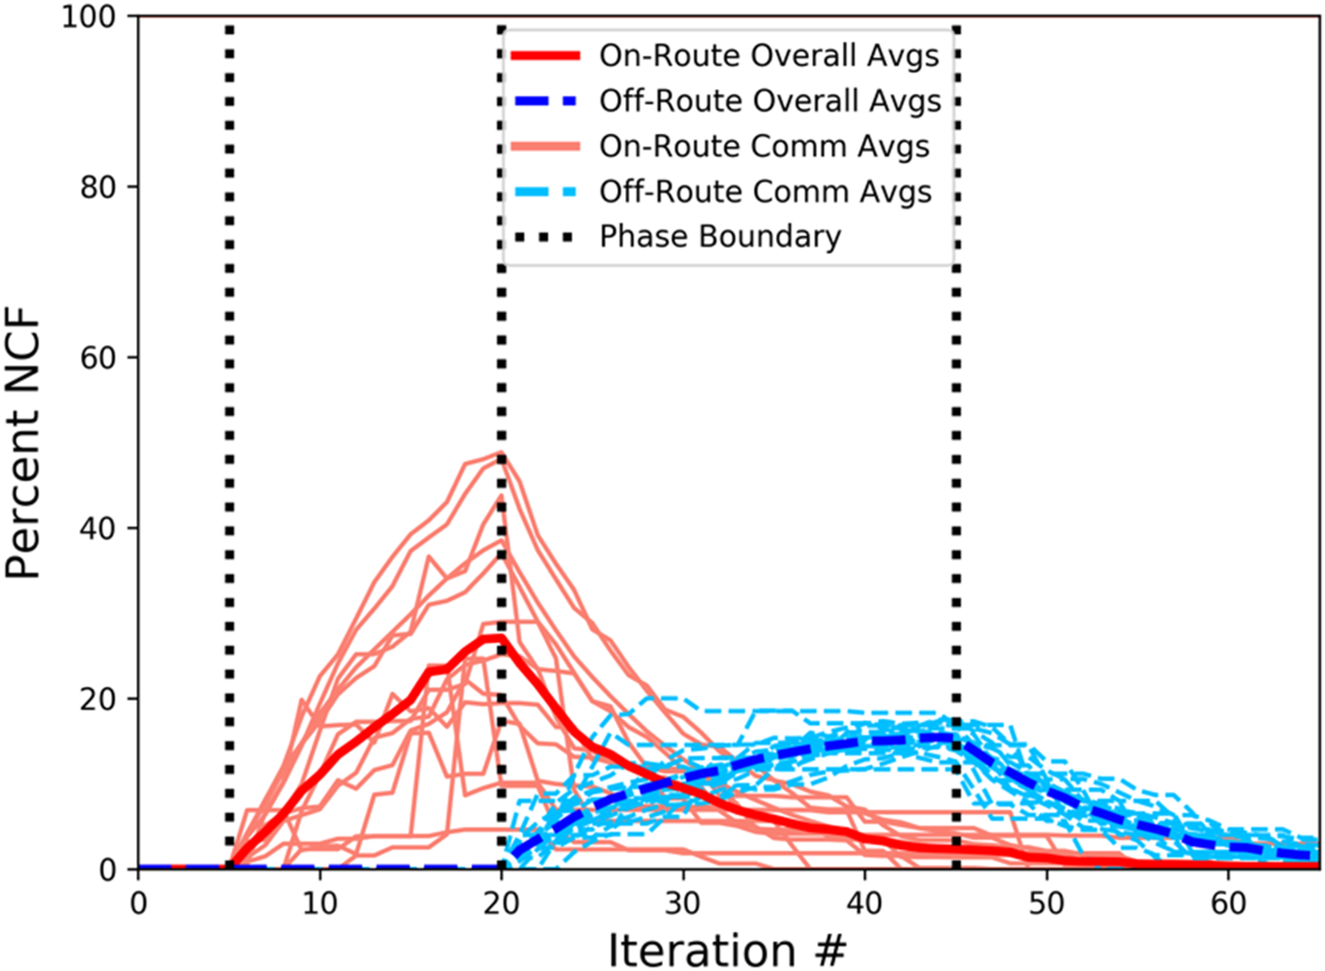
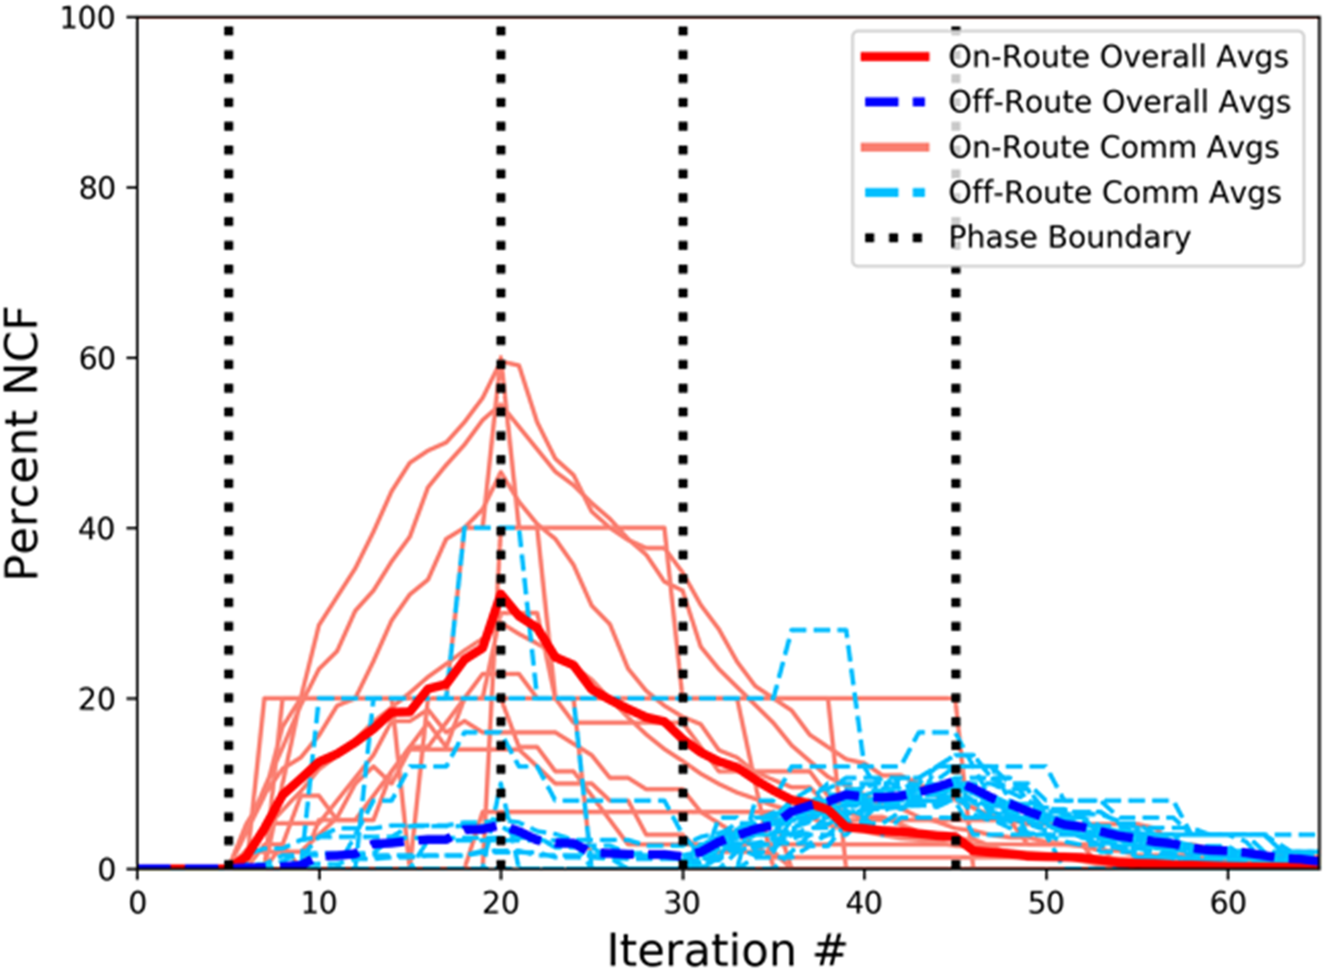
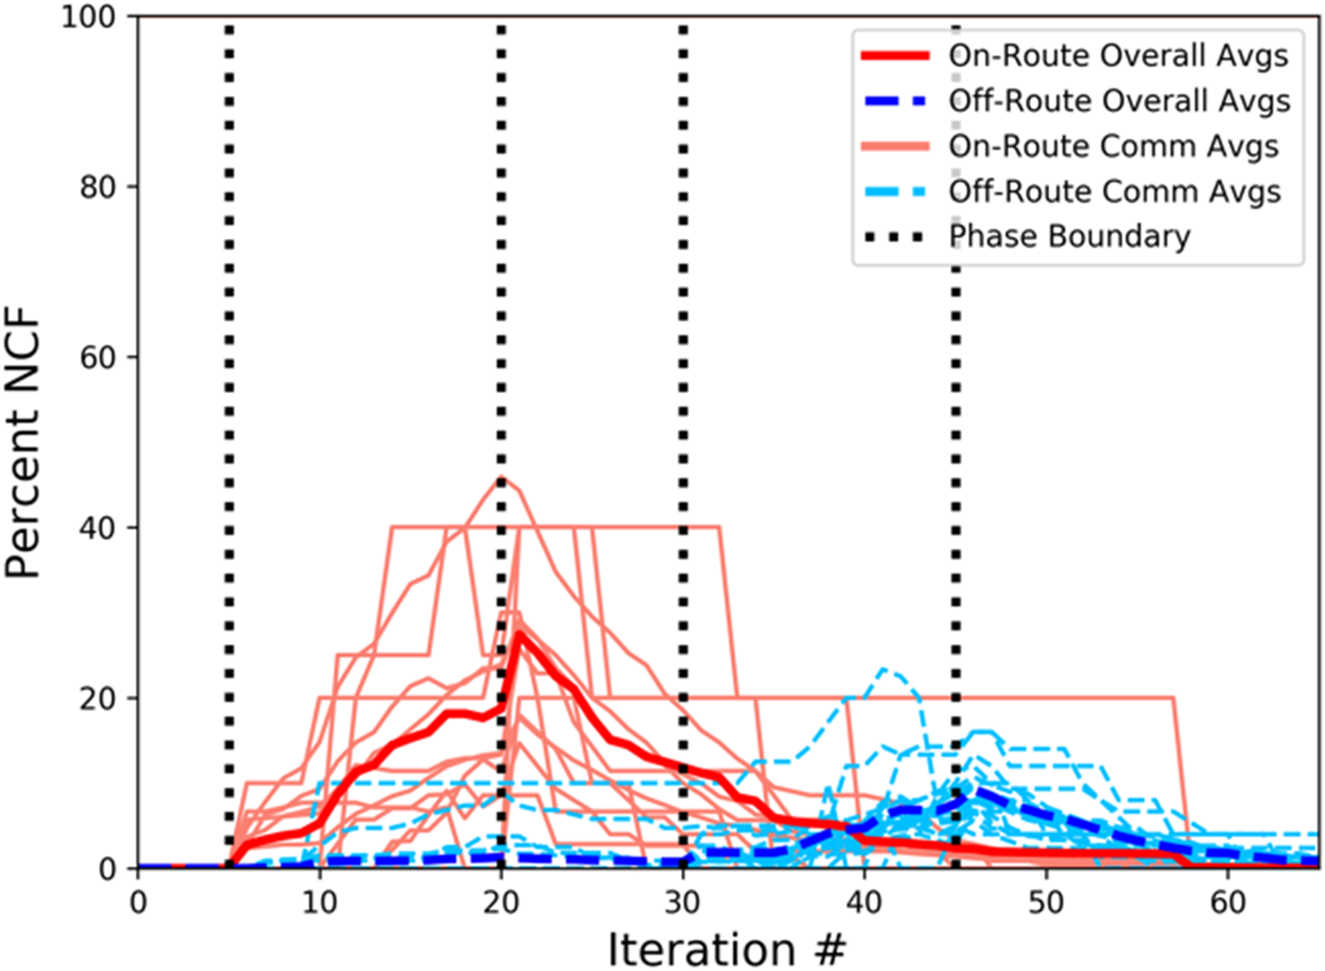
This simulation proceeds in five phases exactly like Simulation 4's except there is no need to postulate migration from the Midlands to tamp down the NCF.Footnote 4 Children acquire the NCF or not in a binary fashion according to whether they receive NCF input above some threshold. Three thresholds are examined: 30% (advantage to NCF), 50% (neutral), and 80% (disadvantage to NCF), and Figures 16–18 demonstrate the system's behavior given those thresholds. As in Simulation 4, only those nodes updated in the last 3 iterations are represented in order to model transmission. The three plots are very similar except that the peaks decrease in height as the threshold is raised. In all three cases, the simulation created the expected staggered two-peak pattern regardless of cognitive advantage or disadvantage and without relying on alternating migration patterns or heavy continuing migration from the Midlands.
(Simulation 5) Percentage of speakers exhibiting NCS On-Route (solid/red) and Off-Route (dashed/blue) by “birth” iteration. Individual community clusters are traced in light solid/red and light dashed/blue. Learners accept the NCS if at least 30% of their input is NCS.

(Simulation 5) Percentage of speakers exhibiting NCS On-Route (solid/red) and Off-Route (dashed/blue) by “birth” iteration. Individual community clusters are traced in light solid/red and light dashed/blue. Learners accept the NCS if at least 30% of their input is NCS.

(Simulation 5) Percentage of speakers exhibiting NCS On-Route (solid/red) and Off-Route (dashed/blue) by “birth” iteration. Individual community clusters are traced in light solid/red and light dashed/blue. Learners accept the NCS if at least 80% of their input is NCS.

DISCUSSION
The ephemeral presence of features associated with the Northern Cities Shift among speakers born in the St. Louis Corridor region over a few decades during the twentieth century invites explanation. The geography of the Corridor itself coupled with the upending effect of the Great Depression played the major role in the Northern Cities Features’ development there: I employ computer simulation to investigate how migration, diffusion, and transmission along Route 66 could have conspired to create the staggered two-peak pattern of change that Friedman discovers across two generations in the region. It becomes clear that diffusion alone, driven by interactions across communities cannot account for the observed pattern (Simulation 1), but it does yield a path of change in which St. Louis and the Corridor's NCF expression is dragged up sporadically toward Chicago's, which, in that sense, corroborates Stanford and Kenny's (Reference Stanford and Kenny2013) predictions about a diffusion-only setting.
Simulation 2 incorporates migration into On-Route communities in order to achieve a kind of staggered two-peak pattern. But even though the Off-Route peak is lower and later than the On-Route peak, the Off-Route rate rises too early and cannot rise further once it has surpassed the declining On-Route rate. In fact, the historically attested pattern is impossible under this model because of how diffusion of variables works across networks. The Off-Route rate is closely coupled with the On-Route rate because the Off-Route communities are just reacting to On-Route communities via diffusion. Therefore, there is no way for the NCF to “wait” until after the On-Route peak before it begins to rise Off-Route, and there is no way for the NCF to continue rising Off-Route once it is already more frequent than On-Route. A system with two connected components (here, On-Route and Off-Route communities) where direct action on one component causes an indirect delayed reaction in the other is called a first-order two-compartment system.
Two-compartment systems’ inherent inability to replicate the observed Corridor pattern indicates that migration both to On-Route and Off-Route communities are independently necessary to arrive at the staggered two-peak path of chains, so the subsequent three simulations take this into account but with different assumptions. The first (Simulation 3) shows that diffusion between On-Route and Off-Route communities can account for the staggered two-peak pattern if it is assumed that the NCF had a strong advantage during the duration of the simulation. It is unclear, however, what would have given the NCF such a strong advantage. Whatever it was, it probably was not social, because the NCS has rarely ever been socially salient and has not been prestigious when it has been socially salient (Driscoll & Lape, Reference Driscoll and Lape2015; Nesbitt, Reference Nesbitt2018). Even if we are willing to grant that it had an advantage of unknown provenance, traffic flow needed to be modulated by a factor of 1000 for the simulation to work out, which is far outside the realm of plausible history, because it would require that communication between Illinois communities ground to a halt during the Great Depression. Also, if the NCF were so advantaged for whatever reason, they would consistently gain ground in populations where they were present even at low rates, so if it were not for a continuous heavy flow of non-NCF Midlands speakers into the Corridor, the NCF would take off again. This continuously heavy Midlands migration is not evident in the actual modern Corridor.
The second successful model (Simulation 4) assumes neutral change and relies on migration to import the NCF from the Inland North to On-Route communities and from On-Route communities to Off-Route ones. It does not need sustained migration to prevent the NCS from rising. Rather, it assumes that some adult On-Route speakers brought the NCS with them when they moved away from home and spread it to their children born Off-Route. This simulation is consistent then with the hypothesis that transmission rather than diffusion was the driving factor in the spread of the NCS, which would account for the one-generation gap in the regions.
Finally, the third successful model (Simulation 5) obviates migration from the Midlands as a critical factor by assuming a threshold learning model. Children acquire the NCF in that model only if a sufficient threshold of their input satisfies the NCF criteria; so, if not enough children learn it, it cannot gain a permanent foothold in the population. This model happens to work under a wide range of advantages, so it does not speak to the cognitive or social advantage NCF, be it neutral or otherwise. Despite this, it may not be appropriate to use a threshold learning model for this kind of feature because it treats individuals as all-in or all-out participators in the change, but the NCF are inherently gradient.
Taken together, the three successful models that benefited from recent empirical research into the St. Louis Corridor point at potentially fruitful areas of further research. Simulation 3 can be used to rule out a straightforward advantaged change model of the NCF in the corridor, even though it produces the correct pattern because it requires unsupported and unrealistic assumptions about its traffic flow history. If the advantage of the NCF played an important role in the Corridor, it must have varied over time and across communities. The advantage cannot have been cognitive if it varied, so it would have to have been social instead. If it were social, it would indicate a very different status for the NCF in the Corridor than the Inland North. This is not a question that we can answer in front of a computer screen or by combing census records—it is a possible direction for new fieldwork. The migration models espoused in Simulation 4 and 5, on the other hand, assume a primacy of linguistic transmission and the movement of adult speakers in driving the Corridor's history. They will be distinguishable by continued work on child acquisition of phonetic sociolinguistic variables in general on one hand and population-level analysis of the Corridor on the other, once appropriate census data becomes available.
The fact that so many different approaches can yield outwardly similar results is not surprising, but it means that the final output of these simulations—or any simulation—should be taken with a grain of salt. These are not the ultimate bookend to the problem, but they have demonstrated the insufficiency of the simplest hypotheses. Each successful model's unique assumptions isolate a new hypothesis for sociolinguists to investigate further, bringing the research problem full circle from Friedman's groundwork, to abstract simulation, and back. Future modeling work may investigate the special role that St. Louis, Springfield, and the other major Corridor cities played in its linguistic development, the effect of Corridor population geography on the non- or partial systematicity of the NCS, or the partial historical retreat of Midlands feature in the area. But with everything we know today, we can name the migration+transmission model from Simulation 4 as the tentative leading account for what happened—it is the best fit for the data with the fewest (as of yet) unmotivated assumptions—but it is sure to be reevaluated in the future.
SUPPLEMENTAL MATERIALS
To view supplementary material for the article, please visit https://doi.org/10.1017/S0954394519000255.