Introduction
The amount of food we consume is determined by hunger and satiety signals as well as by the accessibility and the rewarding properties of food and a person's motivation to obtain food. The brain plays a major role in food intake and one of the neurotransmitters involved is dopamine (DA), particularly striatal DA. Although in the literature striatal DA is often used as a surrogate for hedonism, the striatal DA system is in fact related to the motivation to seek food and not so much to the hedonic value of the reward (Kelley et al. Reference Kelley, Baldo, Pratt and Will2005; Berridge, Reference Berridge2007). Rodent studies have shown a relationship between food-related motivational behavior and the striatal DA system. Stimulating DA release with amphetamine in rats specifically amplified incentive salience for a food reward but not hedonic ‘liking’ (Tindell et al. Reference Tindell, Berridge, Zhang, Pecina and Aldridge2005), and motivation to obtain a food reward is reduced when DA antagonists are administered in the striatum of rats (Baldo et al. Reference Baldo, Sadeghian, Basso and Kelley2002). Moreover, food itself, as well as the sight or smell of food, serve as stimuli for striatal DA release (Small et al. Reference Small, Jones-Gotman and Dagher2003; Berridge, Reference Berridge2009). The relationship between food stimuli that enhance motivated behavior and the striatal DA system in humans, however, has not been investigated in depth. Theoretically, motivation elicited by stimuli is thought to be related to the attention-grabbing properties of these stimuli (Field & Cox, Reference Field and Cox2008; Berridge, Reference Berridge2009; Field et al. Reference Field, Munafo and Franken2009) and food attention bias has been related to motivation for food (craving) but also to ‘worry about food’ in the context of anorexia nervosa (Werthmann et al. Reference Werthmann, Field, Roefs, Nederkoorn and Jansen2014a ). To measure attention for a food stimulus in humans, measurements of the detection speed or distraction time when a food stimulus is provided (i.e. visual attention) with validated computerized tasks (Derryberry, Reference Derryberry1989) is used. If a person detects a food item faster than a non-food item, he or she has a biased attention for food.
Although studies in rodents clearly demonstrate a relationship between motivation to obtain food and the striatal DA system, direct evidence for a relationship between visual attention bias for food and the striatal DA system in healthy, lean humans is currently unavailable. A faster response to visual food stimuli (Castellanos et al. Reference Castellanos, Charboneau, Dietrich, Park, Bradley, Mogg and Cowan2009; Tetley et al. Reference Tetley, Brunstrom and Griffiths2009; Nijs et al. Reference Nijs, Muris, Euser and Franken2010) and decreased striatal DA D2/3 receptor binding (Wang et al. Reference Wang, Volkow, Logan, Pappas, Wong, Zhu, Netusil and Fowler2001; de Weijer et al. Reference de Weijer, van de Giessen, van Amelsvoort, Boot, Braak, Janssen, van de Laar, Fliers, Serlie and Booij2011; van de Giessen et al. Reference van de Giessen, Celik, Schweitzer, van den Brink and Booij2014) found in obese compared to lean humans points towards a direct relationship between DA and visual attention bias for food. Presynaptically located dopamine transporters (DATs) are important regulators of available extracellular DA and thereby of DA signaling (German et al. Reference German, Baladi, McFadden, Hanson and Fleckenstein2015). As the striatal DA system relates to incentive salience for all kinds of food (Tindell et al. Reference Tindell, Berridge, Zhang, Pecina and Aldridge2005), we hypothesized that striatal DAT binding is related to visual attention bias for food in general.
In addition to DA being involved in motivational behavior to obtain food, the neurotransmitter serotonin (5-hydroxytryptamine; 5-HT) plays a role in hunger and satiety, as it is released during the meal to reduce intake and terminate the meal (Lam & Heisler, Reference Lam and Heisler2007). 5-HT is produced in the raphe nuclei and broadly transported throughout the brain; dense projections are found in the thalamus and hypothalamus (Lam & Heisler, Reference Lam and Heisler2007). Serotonergic drugs such as the 5-HT2C receptor agonist lorcaserin, currently in use as anti-obesity drug, suppress hunger and increase satiety in obese but also in lean humans (Halford et al. Reference Halford, Harrold, Boyland, Lawton and Blundell2007), resulting in significant weight loss (Smith et al. Reference Smith, Weissman, Anderson, Sanchez, Chuang, Stubbe, Bays and Shanahan2010). Inversely when central 5-HT is depleted, rodents demonstrate uncontrollable hyperphagia (Breisch et al. Reference Breisch, Zemlan and Hoebel1976; Saller & Stricker, Reference Saller and Stricker1976; Waldbillig et al. Reference Waldbillig, Bartness and Stanley1981). In a hungry state (i.e. fasted) when 5-HT levels are low (Haider & Haleem, Reference Haider and Haleem2000), obese and lean subjects show increased visual attention bias for food pictures (Castellanos et al. Reference Castellanos, Charboneau, Dietrich, Park, Bradley, Mogg and Cowan2009). However, it has not been investigated yet whether there is a direct association between visual attention bias for food and the (hypo)thalamic 5-HT system in the fasting state in humans. Like DAT, serotonin transporters (SERTs) are presynaptically located regulators of extracellular 5-HT levels (Daws & Gould, Reference Daws and Gould2011). SERT binding is reduced in binge-eating disorder, a condition associated with increased impulsivity (Kuikka et al. Reference Kuikka, Tammela, Karhunen, Rissanen, Bergstrom, Naukkarinen, Vanninen, Karhu, Lappalainen, Repo-Tiihonen, Tiihonen and Uusitupa2001; Schag et al. Reference Schag, Schonleber, Teufel, Zipfel and Giel2013) but a direct relationship between 5-HT and impulsivity has not been demonstrated. We hypothesized that SERT binding in the diencephalon, an area that contains the hypothalamus, thalamus and pineal gland, is negatively associated with impulsivity in lean humans.
Although it is a general assumption that an increased visual attention bias for food results in increased food intake in daily life, only few laboratory studies investigated this topic (Nijs et al. Reference Nijs, Muris, Euser and Franken2010; Werthmann et al. Reference Werthmann, Roefs, Nederkoorn and Jansen2013, Reference Werthmann, Renner, Roefs, Huibers, Plumanns, Krott and Jansen2014b ; Hardman et al. Reference Hardman, Scott, Field and Jones2014). Werthmann et al. (Reference Werthmann, Field, Roefs, Nederkoorn and Jansen2014a ), for example, showed that a high visual attention bias for chocolate was related to higher chocolate intake. We hypothesized that visual attention bias for food in general is positively associated with total food intake. To test the aforementioned hypotheses we measured striatal DAT and diencephalic SERT binding with [123I]FP-CIT single photon emission computed tomography (SPECT) and correlated these outcomes with free choice self-reported food intake, visual attention bias for food and impulsivity measured with a latency-based computerized tasks and impulsivity and craving measured with questionnaires.
Materials and method
The subjects described in this study were included in a hypercaloric diet intervention trial. The effects of the hypercaloric diet intervention on metabolism, liver fat and diencephalic SERT binding have been published previously (Koopman et al. Reference Koopman, Booij, Fliers, Serlie and la Fleur2013, 2014a). In this paper we present the baseline data, all measurements were performed before the start of the hypercaloric diets.
Study population
A total of 36 healthy, male subjects with a mean age of 22.2 ± 2.5 years and a mean body mass index (BMI) of 22.3 ± 1.4 kg/m2 (range 19.6–24.9 kg/m2) were included in the current baseline data analyses. Exclusion criteria were a history of psychological or psychiatric disorders, eating disorders assessed with the Eating Disorders Examination Questionnaire (EDE-Q; Fairburn & Beglin, Reference Fairburn and Beglin1994; Luce & Crowther, Reference Luce and Crowther1999), substance and alcohol abuse, unstable weight, any medical condition, performance of excessive sports, shift work and use of any medication. The study was approved by the institutional review board of the AMC, Amsterdam. Written informed consent was received from all participants prior to the start of study participation. The authors assert that all procedures contributing to this work comply with the ethical standards of the relevant national and institutional committees on human experimentation and with the Helsinki Declaration of 1975, as revised in 2008.
Measurements and calculations
Imaging of DAT and SERT
After an overnight fast subjects underwent SPECT imaging after intravenous administration of 115 MBq [123I]FP-CIT (range 110–120 MBq; specific activity >750 MBq/nmol; radiochemical purity >98%, produced according to GMP criteria at GE Healthcare, The Netherlands) measuring SERT binding in the diencephalon 2 h and DAT binding in the striatum 3 h after injection, the optimal time points for visualizing SERTs and DATs with [123I]FP-CIT SPECT, respectively (Booij et al. Reference Booij, Hemelaar, Speelman, de, Janssen and van Royen1999; Koopman et al. Reference Koopman, la Fleur, Fliers, Serlie and Booij2012). Each participant was pre-treated with potassium iodide to block thyroid uptake of free radioactive iodide. SPECT imaging was performed using a 12-detector, single-slice brain-dedicated scanner (Neurofocus Inc., USA), using an acquisition protocol as described earlier with slight modifications (interslice distance 5 mm, acquisition time 210 s per slice) (Booij et al. Reference Booij, Hemelaar, Speelman, de, Janssen and van Royen1999). All scans were reconstructed in 3D and corrected for attenuation. For quantification, a region-of-interest (ROI) analysis to determine specific binding activity in the diencephalon and striatum was performed by a well-trained researcher and confirmed by a second analyst as described earlier (Booij et al. Reference Booij, Hemelaar, Speelman, de, Janssen and van Royen1999). Briefly, the four consecutive slices with the highest binding were selected in the diencephalon (including hypothalamus/thalamus) to assess binding to SERT and in the striatum to assess binding to DAT. Activity in the cerebellum (three consecutive slices), excluding the SERT-rich vermis, was assumed to represent non-displaceable activity (non-specific binding and free radioactivity). Since the mean activity in a given volume is dependent of the number of slices included, we analyzed monoamine transporter availability in a similar amount of slices in each subject. We therefore standardized on four consecutive slices for the striatum and diencephalon and three slices for the cerebellum as this was the minimum amount of slices that was available in all subjects. A specific-to-non-specific binding ratio (SNS-BR) was calculated as
 $$\displaystyle{{{\rm ROI\,binding - cerebellar\,binding}} \over {{\rm cerebellar\,binding}}}.$$
The SNS-BR was used as the outcome measure. Due to a technical problem with the SPECT scanner, scans of six subjects had to be excluded from the analyses, therefore data on DAT and SERT binding were available for 30 subjects.
Computerized tasks and questionnaires
Tasks and questionnaires were selected to assess functions associated with the brain 5-HT and DA systems and were performed and completed after an overnight fast of approximately 12 h, on the same day as the SPECT scans were acquired.
Delay Discounting Task. A computerized task for assessment of impulsive decision making. Subjects choose between a smaller immediate reward (money) or a larger future reward. The future reward ranged from 2 weeks to 10 years from now. When subjects are inclined to choose the smaller, immediate amount of money over large, delayed money, they are characterized by greater levels of impulsivity. A detailed description of this task has been published previously (Wittmann et al. Reference Wittmann, Leland and Paulus2007). Behavioral performance was analyzed by plotting the indifference points (the points where immediate and delayed reward were equally valued) at different time points and the area under the curve was used as a behavioral outcome (Myerson et al. Reference Myerson, Green and Warusawitharana2001).
Visual Search Task. The computerized odd-one-out version of this task requests the participant to decide as quickly as possible whether a matrix of 20 visual stimuli consists of pictures from just one category or whether there is one picture from a different category (odd-one-out). Each trial started with a brief tone, followed by a fixation cross (500 ms). Then a 5 × 4 matrix containing 20 visual stimuli was presented. Participants initially completed 12 practice trials (with pictures of tools and clocks) followed by 154 experiment trials. The matrices were composed of pictures of food (low-caloric or high-caloric products) and pictures of neutral, non-food items (bags and balls). Food items were selected on caloric density. Mean caloric density was 40 ± 18 kcal/100 g for low-caloric products and 402 ± 112 kcal/100 g for high-caloric products. The food- and non-food items were matched on color and shape. Examples of the matrices and a full list of the food items are presented in the Supplementary material (Fig. S1 and Table S1). Of the experiment trials, 42 were one-category matrices and 114 were odd-one-out matrices. The task lasted approximately 15 min and was split into two blocks of trials, separated by a brief break. Participants were instructed to respond as quickly and as accurately as possible, and to press the right key in case of an odd-one-out (one picture in a category different from the other 19 pictures), and the left key in case of no odd-one-out (20 pictures in the same category). The matrix remained on screen until the participant responded or for a maximum of 20 s, then a new trial started. We used six ‘odd-one-out’ matrices: one high-caloric food target among 19 neutral items (bags) (n = 19), one low-caloric food target among 19 neutral items (bags) (n = 19), one neutral target (ball) among 19 other neutral items (bags) (n = 19), one neutral target (bag) among 19 high-caloric food items (n = 19), one neutral target (bag) among 19 low-caloric food items (n = 19), one neutral target (bag) among 19 other neutral items (balls) (n = 19). The visual search task was programmed using E-prime software (Eprime 1.0; Psychology Software Tools Inc., USA). We assessed both reaction time (RT) and accuracy. Trials with an inaccurate response were not included in the analyses. RT outliers were excluded from the analyses if <200 ms, >2000 ms or >3 s.d. above each participant's mean. Food detection speed and food distraction scores were calculated for each participant. Food detection speed was calculated by subtracting the average response latency on food-target-trials from the average response latency on neutral-target trials. So, a higher food detection speed score indicates a faster detection of food items than of neutral items. The food distraction score was computed by subtracting the average response latency on neutral-distractor trials from the average response latency on food-distractor trials. So, a higher food distraction score indicates more distraction by food items than by neutral items.
Dutch Eating Behavior Questionnaire (DEBQ). A 33-item self-report for assessment of restrained, emotional and external eating behavior (van Strien et al. Reference van Strien, Frijters, Bergers and Defares1986).
Barratt Impulsiveness Scale. The Dutch 30-item version of this scale (BIS-11), scored on a 4-point scale, was used for assessment of self-reported impulsiveness (Patton et al. Reference Patton, Stanford and Barratt1995).
General Food Craving Questionnaire-Trait (G-FCQ-T). A four-factor, 21-item questionnaire to assess general trait food cravings (Nijs et al. Reference Nijs, Franken and Muris2007).
Hunger and Appetite. Assessed with 100 mm visual analog scales (VAS) anchored at each end with descriptive extremes (e.g. extremely hungry – not hungry at all). Subjects were required to mark a point on the scale within the anchored points, which related to how hungry they felt.
Food intake
We assessed food intake with an online diet journal designed by the Dutch Nutrition Centre (eetmeter.voedingscentrum.nl). Participants reported their free choice food intake at this website during 7 days prior to the measurements. Reported intake was compared to the eucaloric need to assess eventual underreporting. Eucaloric need was calculated as 1.4 × resting energy expenditure (REE). REE was measured using indirect calorimetry as described previously (Koopman et al. Reference Koopman, Caan, Nederveen, Pels, Ackermans, Fliers, la Fleur and Serlie2014a ). The 40% caloric need surplus (on top of REE) represents expected caloric need for physical activity. In addition we measured body weight before and after this week, which had to be stable to validate that the reported intake was eucaloric and weight-maintaining. Mean difference between reported intake and calculated caloric need was 236.7 kcal/day (8% of expected intake). We suspected underreporting of free-choice food intake in three subjects (reported intake about 1000 kcal lower than expected based on energy expenditure measurements, difference in expected and reported intake >2.5 s.d. below the mean). Therefore food intake data of these two subjects were excluded and analyses on food intake were performed on data of 33 subjects.
Statistics
Statistical analyses were performed using SPSS v. 20.0 (IBM Corp., USA). Data were tested for normality. The overall primary hypothesis was that both diencephalic SERT and striatal DAT binding are associated with, visual attention bias for food in general and that visual attention bias for food is associated with free-choice total caloric intake. To evaluate this we first performed Pearson correlations to detect any individual correlations between study parameters. We subsequently performed forward multivariate analysis to determine independent predictors of food intake. We used the rule that the maximum number of variables was no more than 10% of the analysed number of observations, which meant that the maximum number of simultaneously entered variables was 3. For the multivariate analysis we chose as predictor variables: (1) BMI; (2) visual attention bias and (3) SERT and DAT binding ratios (SNS-BR). There was multicollinearity between diencephalic SERT and striatal DAT binding; these parameters could not be analysed in the same model. Therefore we designed two models with BMI, visual attention bias and SERT or DAT binding ratios (SNS-BR), respectively. Effects were considered significant when was p < 0.05 and a trend when p < 0.1.
Results
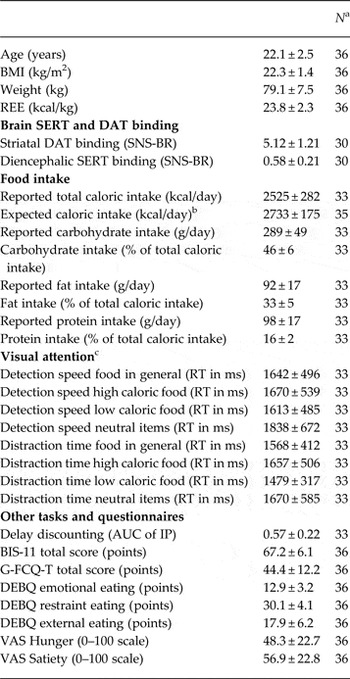
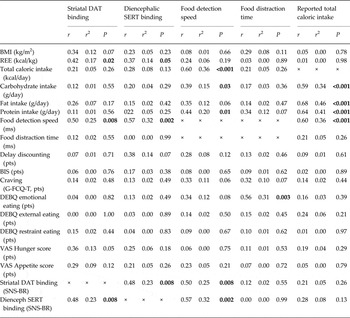
Baseline characteristics of the study participants and mean ± s.d. of all outcome values are presented in Table 1. Statistical outcomes of all univariate analyses are presented in Table 2.
Characteristics

BMI, body mass index; REE, resting energy expenditure; SERT, serotonin transporter; DAT, dopamine transporter; SNS-BR, specific to non-specific binding ratio; RT, reaction time in milliseconds; AUC of IP, area under the curve of the indifference point graph; BIS, Barratt impulsiveness scale; G-FCQ-T, General Food Craving Questionnaire – trait; DEBQ, Dutch Eating Behavior Questionnaire; VAS, visual analog scale.
Data presented as mean ± s.d. Measures were performed in fasting condition. Caloric and macronutrient intake presented as the average daily intake based on the weekly intake.
a Due to exclusion of outliers and missing data, N is variable per outcome measure.
b Expected daily caloric intake is calculated as 1.4 × REE.
c Absolute RTs per category not corrected for RT for a neutral target are presented.
Univariate linear regression analysis

BMI, Body mass index; REE, resting energy expenditure; BIS, Barratt Impulsiveness Scale; G-FCQ-T, General Food Craving Questionnaire – trait; DEBQ, Dutch Eating Behavior Questionnaire; VAS, visual analog scale; DAT, dopamine transporter; SNS-BR, specific to non-specific binding ratio; SERT, serotonin transporter.
Correlations between visual attention bias for food and reported food intake
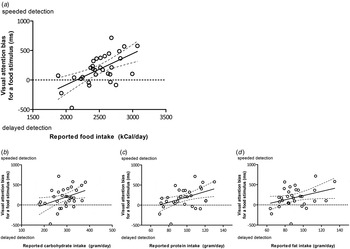
As hypothesized, food detection speed was positively associated with total caloric intake (Table 2, Fig. 1a ), indicating that a faster detection of food stimuli was related to higher food intake. Reported carbohydrate and protein intake were positively associated with food detection speed (Table 2, Fig. 1b,c ), whereas reported fat intake tended to be positively associated with food detection speed (Table 2, Fig. 1d ). Food distraction time was not associated with reported total caloric intake or reported intake of any specific macronutrients (Table 2).
Correlation of visual attention for food stimulus with (a) reported total food intake, (b) reported carbohydrate intake, (c) reported protein intake, and (d) reported fat intake.

Correlations with brain SERT and DAT binding
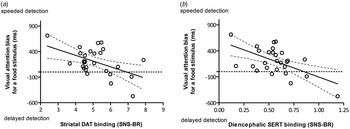
Striatal DAT binding ratios (SNS-BR) were negatively associated with food detection speed, as were diencephalic SERT binding ratios (Table 2, Fig. 2a,b ), showing that a faster detection of food stimuli was related to reduced DAT and SERT binding. Neither striatal DAT binding ratios nor diencephalic SERT binding ratios were associated with food distraction time (Table 2). In addition, striatal DAT and diencephalic SERT binding ratios were not associated with reported total caloric intake or reported intake of any specific macronutrient (Table 2). Striatal DAT binding ratios correlated positively with diencephalic SERT binding (Table 2). Finally, striatal DAT binding and diencephalic SERT binding were both associated with REE but not with BMI or outcomes of the questionnaires (Table 2).
Correlation of detection speed of a visual food stimulus with (a) striatal dopamine transporter (DAT) binding and (b) diencephalon serotonin transporter (SERT) binding. SNS-BR, Specific to non-specific binding ratio.

Multivariate prediction model for food intake
To detect independent associations with reported food intake, we performed multivariate regression analyses using two models: one with diencephalic SERT binding ratios, food detection speed and BMI as variables (model 1), and one with striatal DAT binding ratios, food detection speed and BMI as variables (model 2), with SERT and DAT binding as dependent variables, thereby resulting in a total of two regression models. Total variance explaining caloric intake was 43% in model 1 (p = 0.004) and 45% in model 2 (p = 0.003). Food detection speed was the only independent predictor of total caloric intake in both models (model 1 p = 0.003, model 2 p < 0.001). Reported fat and carbohydrate intake was not significantly predicted by model 1 (r = 0.43, p = 0.20) and (r = 0.41, p = 0.22), respectively or model 2 (r = 0.41, p = 0.22) and (r = 0.41, p = 0.22), respectively. Reported protein intake was not significantly predicted by model 1 (r = 0.49, p = 0.09), but explained a total variance of 45% by model 2 (p = 0.003). Striatal DAT binding ratios (p = 0.007) and food detection speed (p < 0.001) were both independent predictors of reported protein intake.
Discussion
We show that striatal DAT binding and diencephalic SERT binding negatively correlate with detection speed of visual food stimuli in lean, healthy men on a eucaloric free-choice diet. In addition, detection speed of visual food stimuli correlated positively with total food and individual macronutrient intake, whereas striatal DAT and diencephalic SERT binding did not independently correlate with food intake. Taken together, our findings point to a physiological role for DA and 5-HT signaling in attention for food, whereas attention for food is involved in the total food intake.
To our knowledge, we are the first to report a direct negative relationship between striatal DAT binding and visual attention bias for food, as well as between diencephalic SERT binding and visual attention bias for food in lean humans. Our results suggest that in a healthy feeding condition, visual attention bias for food and subsequent food intake could well be regulated by the striatal DA system and the diencephalic 5-HT system; in other words these systems may play a role in the physiological, homeostatic regulation of food intake.
Whether these findings in normal-weight individuals can be extrapolated to people with higher BMI remains to be determined. Of interest, central SERT binding was negatively correlated to BMI in a sample of lean and obese humans (Erritzoe et al. Reference Erritzoe, Frokjaer, Haahr, Kalbitzer, Svarer, Holst, Hansen, Jernigan, Lehel and Knudsen2010) and SERT protein in the infundibular nucleus of the hypothalamus was reduced in obese humans (Borgers et al. Reference Borgers, Koopman, Bisschop, Serlie, Swaab, Fliers, la Fleur and Alkemade2014). We here show a negative correlation between SERT and visual attention bias for food, and thus the lower SERT in obesity might explain a higher visual attention bias for food in obese compared to lean humans, although data on visual attention bias in obesity are inconclusive (Werthmann et al. Reference Werthmann, Field, Roefs, Nederkoorn and Jansen2014a ).
The role of DA in food intake and body-weight regulation has convincingly been shown (Volkow et al. Reference Volkow, Wang and Baler2011). In obese humans striatal DA D2/3 receptor binding is decreased (de Weijer et al. Reference de Weijer, van de Giessen, van Amelsvoort, Boot, Braak, Janssen, van de Laar, Fliers, Serlie and Booij2011; van de Giessen et al. Reference van de Giessen, Celik, Schweitzer, van den Brink and Booij2014), but no relationship between striatal DA transporter binding and obesity has been demonstrated (Thomsen et al. Reference Thomsen, Ziebell, Jensen, da Cuhna-Bang, Knudsen and Pinborg2012; van de Giessen et al. Reference van de Giessen, Hesse, Caan, Zientek, Dickson, Tossici-Bolt, Sera, Asenbaum, Guignard, Akdemir, Knudsen, Nobili, Pagani, Vander, Van, Varrone, Tatsch, Booij and Sabri2013). Nevertheless, our data suggest that striatal DAT clearly correlates with the visual attention bias for food but only with a tendency for a correlation with BMI. Thus, regulation of striatal synaptic DA levels by DAT may not be the major component of the dopaminergic system that is related to body-weight regulation but it does relate to attention bias for food. It is likely that additional factors are involved in DA's role in body-weight regulation, for example, via regulation of post-synaptic DA D2/3 receptor signaling; however, this remains to be investigated.
Interpretation of our data should be made with caution since it is unknown how imaging data on DAT binding can be translated to extracellular DA levels, although rodent data indicate that high DAT binding corresponds with high extracellular DA levels. Mice in which DAT expression is genetically down-regulated to 10% of expression levels of wild-type mice increased extracellular DA concentrations in the striatum and hypothalamus (Zhuang et al. Reference Zhuang, Oosting, Jones, Gainetdinov, Miller, Caron and Hen2001; Beeler et al. Reference Beeler, Frazier and Zhuang2012), and thus lower DAT binding could reflect higher available extracellular concentrations of DA. Interestingly, the mice with lower DAT (and thus higher extracellular DA) show higher intake when the cost for food was increased reflecting higher motivation and willingness to work for food (Beeler et al. Reference Beeler, Frazier and Zhuang2012). In addition, upon striatal DA depletion animals do not feed at all demonstrating that DA is essential for motivation for food in general (Palmiter, Reference Palmiter2008). Translating these data from rodents to the findings in our lean subjects suggest that speeded detection of food pictures could reflect higher motivation for food through higher striatal DA. Although this is in line with lower DAT binding reflecting higher extracellular DA in DAT knockdown mice, other studies show a reduction in striatal DAT binding after long-term systemic DA depletion (Kilbourn et al. Reference Kilbourn, Sherman and Pisani1992; Gordon et al. Reference Gordon, Weizman and Rehavi1996), making it difficult to draw firm conclusions on how DAT binding and visual attention bias relate to striatal extracellular DA concentrations.
For diencephalic SERT binding, too, lower SERT binding could reflect higher or lower extracellular 5-HT levels. SERT knockout mice have increased striatal extracellular 5-HT and greater depolarization-induced increases in striatal 5-HT (Mathews et al. Reference Mathews, Fedele, Coppelli, Avila, Murphy and Andrews2004), as well as reduced food intake (Chen et al. Reference Chen, Margolis, Gershon, Schwartz and Sze2012). In line, short-term inhibition of SERT with selective serotonin reuptake inhibitors (SSRIs) results in reduced food intake (Halford et al. Reference Halford, Harrold, Boyland, Lawton and Blundell2007); however, long-term SSRI use results in body-weight (re)gain (Fava et al. Reference Fava, Judge, Hoog, Nilsson and Koke2000; Raeder et al. Reference Raeder, Bjelland, Emil and Steen2006). It has also been shown that, in obesity, representing a chronic state of excessive food intake and potentially a high attention for food (Castellanos et al. Reference Castellanos, Charboneau, Dietrich, Park, Bradley, Mogg and Cowan2009; Tetley et al. Reference Tetley, Brunstrom and Griffiths2009; Nijs et al. Reference Nijs, Muris, Euser and Franken2010), SERT binding is reduced (Erritzoe et al. Reference Erritzoe, Frokjaer, Haahr, Kalbitzer, Svarer, Holst, Hansen, Jernigan, Lehel and Knudsen2010; Borgers et al. Reference Borgers, Koopman, Bisschop, Serlie, Swaab, Fliers, la Fleur and Alkemade2014) suggesting that chronically low SERT availability is associated with decreased extracellular 5-HT. Moreover, 2 weeks of tryptophan (and thus 5-HT) depletion in rats results in lower SERT binding (Rattray et al. Reference Rattray, Baldessari, Gobbi, Mennini, Samanin and Bendotti1996). In summary, most data point towards lower SERT binding reflecting reduced 5-HT signaling, yet this remains speculative and further mechanistic studies in rodents are needed to elucidate the relationship between SERT (and also DAT) binding and extracellular neurotransmitter concentrations under different conditions. We measured SERT binding in the diencephalon, a region that holds several SERT-rich brain structures such as the hypothalamus, thalamus and pineal gland. Due to limitations in resolution of the SPECT scanner in the current study we were not able to narrow the correlation with visual attention bias to a specific diencephalic region.
In addition to demonstrating relationships between brain SERT and DAT binding and food detection speed, we also demonstrate that food detection speed is independently associated with reported food intake. The correlation is the strongest for total caloric intake, but the three main macronutrients (fat, carbohydrates and protein) also positively correlate with visual attention bias for food. Werthmann et al. showed that a high visual attention bias for chocolate is related to higher chocolate intake (Werthmann et al. Reference Werthmann, Field, Roefs, Nederkoorn and Jansen2014a ), but to our knowledge we are the first to show a more general relationship between food detection speed and reported food intake.
We did not find significant correlations between BMI and SERT or DAT binding, although the correlation with striatal DAT binding showed a trend. The lack of correlation between BMI and SERT is in contrast to a previous study demonstrating correlations between BMI and SERT binding in humans (Wang et al. Reference Wang, Volkow, Logan, Pappas, Wong, Zhu, Netusil and Fowler2001; Erritzoe et al. Reference Erritzoe, Frokjaer, Haahr, Kalbitzer, Svarer, Holst, Hansen, Jernigan, Lehel and Knudsen2010); however, these studies included subjects with a wide range of BMI whereas all our subjects were lean. The tendency of a correlation between DAT and BMI is in line with our previous reported tendency of a correlation between fat mass and lean mass with DAT binding in healthy lean man (Koopman et al. Reference Koopman, Roefs, Elbers, Fliers, Booij, Serlie and la Fleur2014b ); however, striatal DAT binding did not correlate with BMI when this was measured in a larger cohort with a wider range of BMI (Thomsen et al. Reference Thomsen, Ziebell, Jensen, da Cuhna-Bang, Knudsen and Pinborg2012; van de Giessen et al. Reference van de Giessen, Hesse, Caan, Zientek, Dickson, Tossici-Bolt, Sera, Asenbaum, Guignard, Akdemir, Knudsen, Nobili, Pagani, Vander, Van, Varrone, Tatsch, Booij and Sabri2013). Overall, it might well be that BMI is not an optimal measure of body composition, athletes for example have a higher BMI due to increased muscle mass and not fat mass (Rothman, Reference Rothman2008) making comparisons between correlations with BMI over a wider range or in lean subjects more difficult.
Our experiments were performed in fasted subjects. Previous research suggests that fasted subjects respond faster to visual food stimuli compared to sated subjects, regardless of being overweight/obese or not (Castellanos et al. Reference Castellanos, Charboneau, Dietrich, Park, Bradley, Mogg and Cowan2009; Nijs et al. Reference Nijs, Muris, Euser and Franken2010). It would be of interest to include the effect of a meal as a variable in future studies on visual attention bias in humans.
In conclusion, we show that striatal DAT binding and diencephalic SERT binding negatively correlate with visual attention bias for food in non-obese, healthy conditions, in line with a key role for DA and 5-HT in the regulation of feeding behavior. At present it is unknown how SERT and DAT binding in imaging studies under fasting conditions relate to extracellular concentrations of 5-HT and DA, respectively. Therefore further experimental studies are needed to elucidate their respective roles in feeding behavior in humans. In addition, changes in SERT and striatal DAT might predispose to disturbed feeding behavior and might be a target for eating disorders, obesity included.
Supplementary material
For supplementary material accompanying this paper visit http://dx.doi.org/10.1017/S0033291716000222.
Acknowledgements
The study was funded by a Ph.D. fellowship grant awarded by the executive board of the Academic Medical Center Amsterdam, there were no other sources of funding. We acknowledge L. S. Wolbert and E. M. van de Giessen for their assistance with the computer tasks and questionnaires.
Declaration of Interest
J.B. is a consultant at GE Healthcare. The remaining authors have no conflict of interest.