


NOMENCLATURE
- AIP
aerodynamic interface plane
- CFD
computational fluid dynamics
- DAER
Department of Aerospace Science and Technology
- ERICA
enhanced rotorcraft competitive effective concept achievement
- GRC
green RotorCraft
- LGV
Politecnico di Milano large wind tunnel
- M
Mach number
- NextGenCTR
Next Generation Civil TiltRotor
- NICETRIP
Novel Innovative Competitive Effective TiltRotor Integrated Project
- POLIMI
Politecnico di Milano
- P ∞
free-stream pressure [Pa]
- P S
pressure on the duct surface [Pa]
- P t
local total pressure measured by directional probe at the AIP [Pa]
 $\bar{P}_{t}$
average total pressure on AIP [Pa]
- $\bar{P}_{\theta }$
average total pressure in the sector of AIP of angle θ [Pa]
- P t∞
free-stream total pressure [Pa]
- q ∞
free-stream dynamic pressure [Pa]
- Q AIP
volumetric flow rate at the AIP [m 3/s]
- Q BY
volumetric flow rate at by-pass duct [m 3/s]
- ROD
rotorcraft drag reduction
- S AIP
aerodynamic interface plane surface [m 2]
- TILTOp
efficient shape optimization of intake and exhaust of a tiltrotor nacelle
- TN
test number
- U ∞
wind-tunnel free-stream velocity [m/s]
- V x
axial flow velocity component [m/s]
- $V_b = \frac{Q_{AIP}}{S_{AIP}}$
bulk velocity [m/s]
- $\bar{V}_{c \theta }$
average circumferential velocity in a sector of AIP of angle θ [Pa]
- δn
nacelle angle-of-attack [deg]
- δw
wing angle-of-attack [deg]
- θ
AIP azimuth angle [deg]
- ρ∞
freestream air density [kg/m 3]
- ω
rotor hub rotational speed [rpm]
- $C_P = \frac{P_S-P_\infty }{q_\infty }$
pressure coefficient
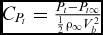
- $C_{P_t} = \frac{P_t-P_{t \infty }}{\frac{1}{2} \rho _\infty V_b^2}$
total pressure coefficient
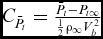
- $C_{\bar{P_t}} = \frac{\bar{P}_t-P_{t \infty }}{\frac{1}{2} \rho _\infty V_b^2}$
average total pressure coefficient on AIP
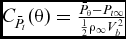
- $C_{\bar{P_t}}(\theta ) = \frac{\bar{P}_{\theta }-P_{t \infty }}{\frac{1}{2} \rho _\infty V_b^2}$
average total pressure coefficient in a sector of AIP of angle θ
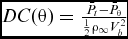
- $DC(\theta ) = \frac{\bar{P}_t-\bar{P}_{\theta }}{\frac{1}{2} \rho _\infty V_b^2}$
distortion coefficient
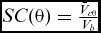
- $SC(\theta ) = \frac{\bar{V}_{c \theta }}{V_b}$
swirl coefficient
- X
axial coordinate along the duct


1.0 INTRODUCTION
The environmental impact related to the expected growth of rotorcraft traffic for passenger transport will surely become more significant in the next decade(Reference Pahlke and Demaret1). In particular, the development of non-classical rotary-wing aircraft configurations, such as tiltrotors aimed at passenger transport, will spur research to find more energy efficient solutions in terms of energy saving.
As a matter of fact, an important aspect of the total system efficiency of an aircraft is the behaviour of the engine air-intake. The key attribute of an efficient subsonic air-intake is gentle diffusion which provides a uniform mass flow to the engine, thus minimising the losses and vibrations. This represents a quite challenging activity as the inlet flow encounters an adverse pressure gradient that could produce boundary-layer instability and flow separation(Reference Seddon and Goldsmith2). The air-intake duct design becomes more critical in the case of turboprops(Reference Jeracki and Heinze3), since the intake duct is forced to bend with an S-shaped geometry due to the integration of the propeller shaft. For these configurations, the flow is channeled through structures with large curvatures, thus negatively affecting the flow uniformity and the total pressure losses at the Aerodynamic Interface Plane (AIP), which corresponds to the first stage of the engine compressor. Indeed, a flow characterised by a certain amount of swirl approaching the engine compressor could produce the stall of the compressor itself. Consequently, the attention of the research activity on this topic is aimed to the optimisation of the internal shape of the curved duct to minimise total pressure losses and flow distortion.
A powerful tool widely employed for this purpose in recent years is Computational Fluid Dynamics (CFD) analysis. An application of CFD methods in this field is the sensitivity study of the S-shaped duct curvature carried out by Atalayer et al(Reference Atalayer, Friedrichs and Wulff4) for the air-intake duct of a highly loaded turboprop. Moreover, Saha et al(Reference Saha, Singh and Seshadri5) investigated the effect of the cross-section shape at the inlet of a transition intake S-duct by computational analysis showing that the elliptic shape provides the best performance in terms of pressure recovery, loss coefficient and flow distortion at the compressor face.
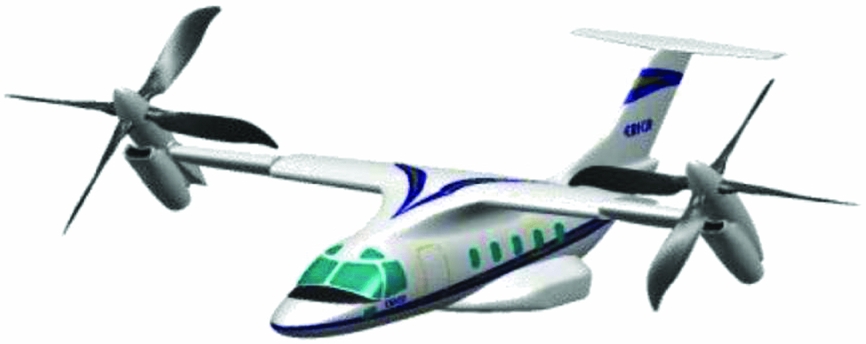
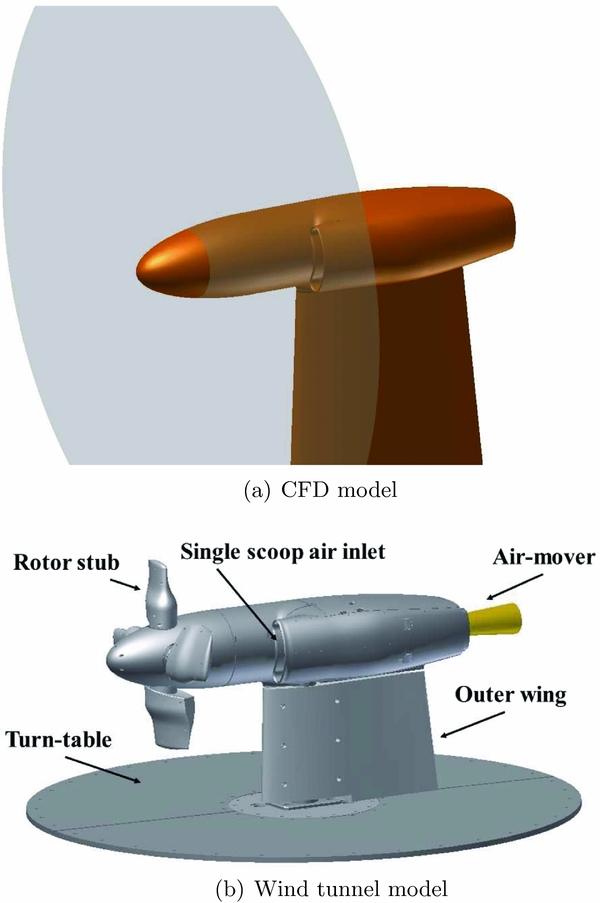
The shape optimisation of the air-intake S-duct of the European platform tiltrotor ERICA (Enhanced Rotorcraft Competitive Effective Concept Achievement)(Reference Alli, Nannoni and Cicalé6), illustrated in Fig. 1, was the object of TILTOp (Efficient Shape Optimization of Intake and Exhaust of a Tiltrotor Nacelle) research project carried out by the Green Rotorcraft GRC2 consortium in the frame of the CleanSky European Programme(Reference Garavello, Benini, Ponza, Scandroglio and Saporiti7). In particular, the baseline configuration of the ERICA tiltrotor intake system was optimised (for cruise condition only) by means of advanced multi-objective genetic algorithms coupled with CFD Navier-Stokes solvers. As can be observed from Fig. 2(a), the CFD model of the air-intake included the nose cone but not the rotor blades or blade stubs. Indeed, the rotor/propeller inflow effect was modelled by a non-uniform disc actuator model, applying a proper pressure jump and swirl radial profiles to the entire rotor disc surface (along the full span of the aircraft blades). Even if not modelled directly, the engine effect on the overall installation efficiency was also considered in the numerical simulations by imposing proper different pressure outlet boundary conditions on a surface downstream the AIP and at the exhaust. A bi-objective optimisation algorithm sought for morphed solutions of the S-shaped region of the duct aimed to improve air-intake performance in terms of both total pressure ratio and total pressure flow distortion. The baseline duct was designed following established best-practices. Also the optimised duct design kept the same costraints in terms of shaping of the baseline one that essentially consisted in considering shape constraint related to the presence of the other nacelle internal components, i.e. the engine, the transmission gearbox and the other accessories, as well as the nacelle external surfaces. Moreover, two additional morphing constraints related to the fixed positions of the AIP surface and of the internal surface of the power shaft fairing were considered for the optimisation of the duct geometry. Further details about CFD-optimisation process can be found in Garavello et al(Reference Garavello, Benini, Ponza, Scandroglio and Saporiti7).
Illustration of the ERICA tiltrotor. (from https://trimis.ec.europa.eu)
Layout of the ERICA air-intake model.
The present work describes the experimental evaluation of the performance of this optimised duct compared to the baseline geometry. The test activity was the object of the TETRA (Test of Tilt-Rotor Air intakes) project in the frame of CleanSky GRC2 Programme and was carried out in the large wind tunnel (LGV) of Politecnico di Milano (POLIMI). In the past years, this facility was used for the assessment of the aerodynamic performance of the complete ERICA tiltrotor aircraft carried out in the frame of NICETRIP (Novel Innovative Competitive Effective TiltRotor Integrated Project) European project(Reference Gibertini, Auteri, Campanardi, Macchi, Zanotti and Stabellini8), while, more recently, a comprehensive experimental campaign was performed in the frame of the CleanSky ROD (Rotorcraft Drag Reduction) project to assess the effectiveness of the CFD optimisation of different helicopter components for drag reduction(Reference Gibertini, Zanotti, Droandi, Grassi, Campanardi, Auteri, Aceti and Le Pape9).
The wind-tunnel tests were performed on a 1/2.5 scale model specifically designed and manufactured for this project. The model reproduced the aircraft nacelle and the outer portion of the wing. The experimental activity comprised measurements carried out with the baseline configuration S-duct and the optimised version. In particular, the total pressure losses and flow distortion at the AIP were evaluated by a complete mapping of the vector velocity field performed by means of five directional probes, which were fixed on a rotating frame to sweep the entire AIP area. Additional pressure measurements were also carried out over more than a hundred points of the duct internal surface to evaluate the pressure distribution along the air-intake.
A comprehensive wind-tunnel campaign was performed considering tests with a proper regulation of the flow rate both at the AIP and on the by-pass duct with the model set-up reproducing different forward flight conditions (i.e. cruise and conversion phases). In particular, one of the goals of the present work was to assess the effectiveness of the optimisation in different conditions than cruise, which was the design target of the CFD optimisation.
The numerical optimisation by GRC2 was carried out at the design cruise speed of ERICA aircraft (M = 0.58), while the present tests were carried out in incompressible regime (M = 0.15) due to wind-tunnel and model limitations. Thus, some non-negligible differences with respect to the full-scale cruise condition can be expected.
The present paper is organised as follows. In Section 2, the set-up of the air-intake model and the employed measurement techniques are described. Section 3 reports the discussion of the main results of the wind-tunnel activity. Final considerations and comments are given in Section 4.
2.0 EXPERIMENTAL SET-UP
The tests were carried out in the POLIMI LGV. The LGV closed test section dimensions are 4m × 3.84m. The maximum wind velocity is 55m/s and the turbulence intensity is less than 0.1%. The LGV closed test section is equipped with a turn-table allowing the adjustment of the model attitude.
2.1 The air-intake model
The 1/2.5 scale model was appropriately designed and built to reproduce the aircraft nacelle and the outer portion of the wing. The general layout of the wind-tunnel model is shown in Fig. 2(b).
The nacelle model was supported by a steel tube flanged directly to the wind-tunnel test section turn-table, which allows setting of the nacelle angle-of-attack. A wing trunk (with 0.55m span), representing a tiltable portion of the aircraft wing, was milled out of resin and mounted over the supporting steel shaft. In particular, the wing could be set independently with respect to the nacelle incidence in order to reproduce different flight conditions of the aircraft (i.e. cruise, conversion).
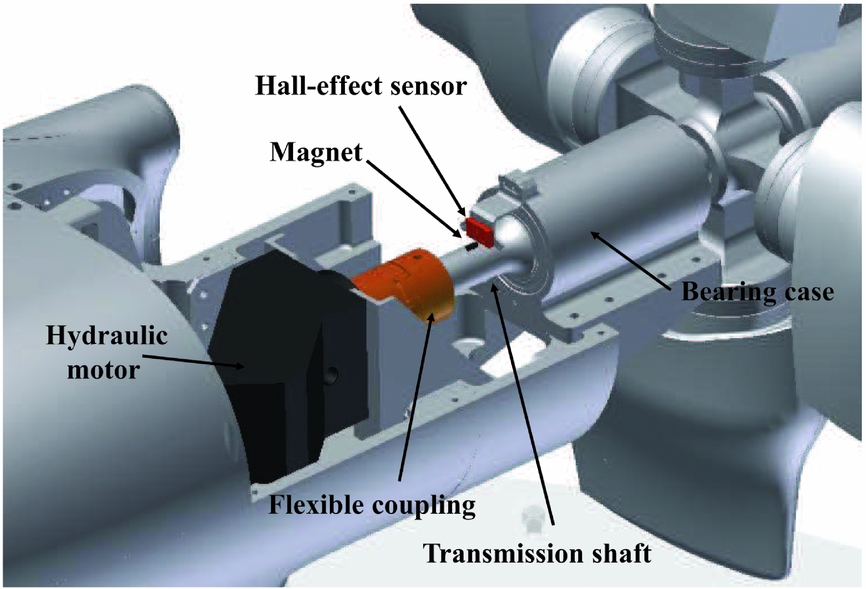
The motor could also be equipped with a rotor hub made of aluminium that included four blade stubs (with 0.425m radius), manufactured from aluminium as well. The rotor hub axis was at 0.76m from the wind-tunnel floor, that is slightly less than two blade stub radius. Nevertheless, the rotor hub interference with wind-tunnel floor is expected to be not so high to influence remarkably the measurements, as the blade stubs are not producing sensitive disk load. Their main effect is the production of turbulent wake far enough from the floor to not be modified in its main features. The nose cone was made of resin by rapid prototyping. The nose cone presented four holes for the stubs passage that were covered for the clean model tests. The rotating hub was driven by a hydraulic motor. The steel transmission shaft was housed in a bearing case and was connected to the motor by a torsionally flexible coupling (see the details in Fig. 3). A Hall-effect sensor provided the feedback control for the hub rotational speed.
Particular of the rotor hub driving system.
The external nacelle structure, entirely machined from aluminium, was designed to house an interchangeable internal duct. The layout of the baseline internal duct model is shown in Fig. 4(a).
(a) Layout of the baseline internal duct model; (b) comparison of the internal ducts longitudinal center lines.
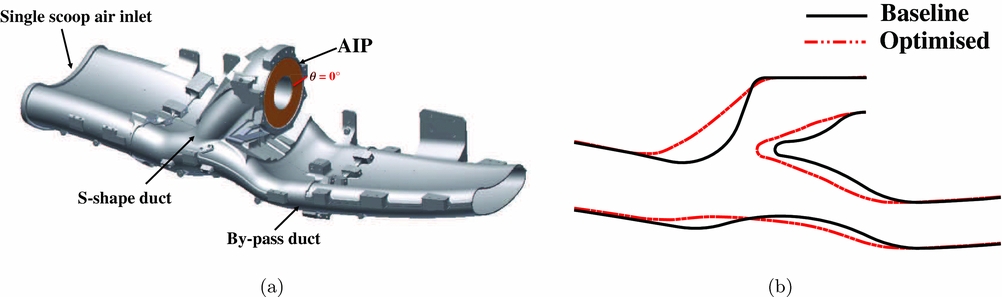
The ERICA aircraft air-intake is characterised by a single-scoop inlet with the air entrance located in the lower part of the nacelle. The geometry of the internal duct presents an S-shape due to the vertical offset between the air entrance and the engine face aligned with the transmission shaft of the turboprop located within the second bend of the S-duct. Consequently, the AIP, being the aerodynamic interface between the engine face and the internal duct, has an annular section, as highlighted in Fig. 4. The internal duct design presents a bifurcation in the first bend of the S-shape leading to a straight by-pass duct working as particle separator to prevent heavy particles from entering the AIP. Two interchangeable internal ducts reproducing the baseline and the optimised geometry were designed and manufactured to compare their performance. The longitudinal center lines of the baseline and optimised duct are illustrated in Fig. 4(b). In particular, the main differences of the optimised geometry with respect to the baseline are a smoother curvature of the duct center line, tending to reduce the slope of the S-duct and a more gradual variation of the area of the transversal section along the duct central line(Reference Garavello, Benini, Ponza, Scandroglio and Saporiti7).
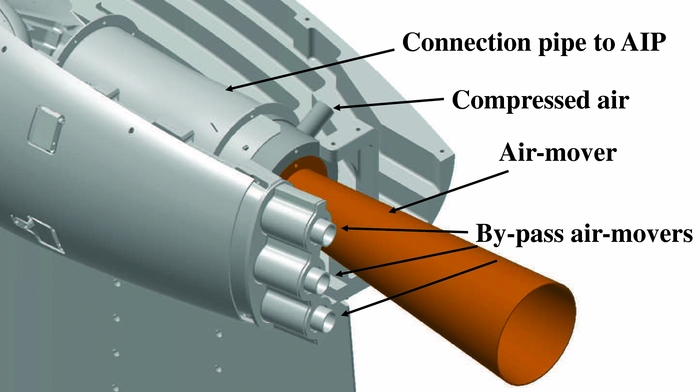
The flow rate at the AIP and by-pass ducts was provided by air-movers. These devices work by exploiting the Coanda effect, thus producing a huge air flow with the use of a small amount of compressed air. In particular, as shown in Fig. 5, a single air-mover was connected to the AIP by a proper connection pipe in correspondence of the aircraft engine position. A different solution involving the use of three smaller air-movers was used on the by-pass duct, as can be seen in Fig. 5. The use of air-movers enabled the required flow rate at both the AIP and by-pass duct while preserving a clean design of the nacelle. This solution was selected as suitable for forward flight tests characterised by high wind-tunnel freestream velocity.
Particular of the air-movers mounting at the air-intake exhaust.
The regulation of the flow-rate inside the intake duct was controlled from velocity measurements carried out by means of an appropriate set of total pressure probes and wall pressure taps placed both in the by-pass duct and in the AIP connection pipe. This flow-rate measurement system was previously calibrated by means of a custom-made Venturi tube that could be directly coupled to the intake inlet section.
All the air-suction system piping and oil piping for the hydraulic motor, as well as the signal and power cabling, were passed through the supporting steel tube so that the model was very clean from the aerodynamic point of view.
2.2 Directional probes and surface pressure measurements
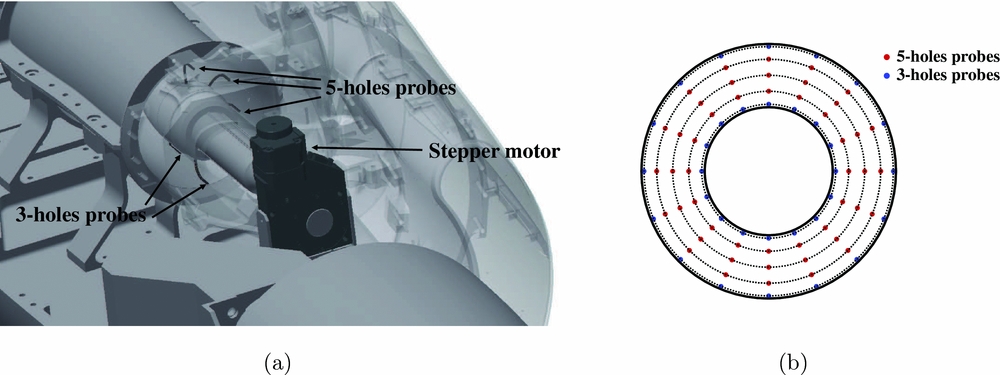
The AIP was instrumented with three 5-hole probes and two 3-hole probes arranged on different radial positions, as shown in the layout of Fig. 6(a). The probes were mounted on a rotating frame driven by a stepper motor. During the tests, the probe rake was used to sweep the entire AIP area with an angular step θ = 22.5°. A sketch showing the measurement points at the AIP is illustrated in Fig. 6(b).
a) Layout of the directional probes mounting at the AIP; b) measurement points at the AIP.
The directional probes were previously calibrated at the Aerodynamics Laboratory of the Department of Aerospace Science and Technology (DAER) of POLIMI. The calibration tests were performed under monitored conditions in a wind tunnel with 150×200mm test section and a maximum speed of 100m/s. The probes were calibrated in a range of angles between −25° and +25° for both pitch and yaw angles(Reference Bryer and Pankhurst10). A check of the calibration accuracy made by direct comparison of the measurements obtained with the probes at known conditions showed an estimated maximum error less than 1° for the reconstruction of both pitch and yaw angle and less than 2% of the freestream velocity for velocity evaluation.
The surface of both baseline and optimised intake ducts were equipped with more than 100 pressure taps. No high-speed unsteady pressure measurements were performed during this test campaign. Pressure measurements from both the directional probes and the surface ports were carried out by means of five 32-port pressure scanners. Pressure signals were acquired for 10s for each rotation angle of the directional probes rake along the AIP. The surface pressure distribution over the internal ducts was obtained by averaging all the results collected during a complete rake rotation.
3.0 RESULTS
The main results of the experimental campaign are discussed in this section. Indeed, the comprehensive experimental campaign included a large number of tests with different settings of the AIP and by-pass flow rates with the model reproducing both cruise and conversion flight condition. In particular, conversion tests were performed with a single setting of the nacelle angle-of-attack (δn = 30°), while the wing was aligned with the free-stream flow. All the runs were performed with a wind-tunnel free-stream velocity U ∞ = 50m/s (M = 0.15). For the sake of conciseness, Table 1 reports the set points for the tests discussed in the present article only. The complete test matrix is reported in the wind-tunnel test conclusion report by Zanotti(Reference Zanotti11), while the raw data and the detailed description of the data reduction techniques are included in the wind-tunnel data analysis report by Gibertini(Reference Gibertini12). The tests were performed for both the baseline and optimised ducts for comparison and included model configurations with and without blade stubs. The tests with the clean model enabled a more clear analysis of the internal flow behaviour and a consequent evaluation of the aerodynamic performance of the duct shape.
Test set points of the air-intake model

For the present wind-tunnel activity, the use of a model equipped with full-span rotor blades was not affordable. Thus, as typically done for wind-tunnel investigations on rotorcraft parts other than the main rotor(Reference Gibertini, Zanotti, Droandi, Grassi, Campanardi, Auteri, Aceti and Le Pape9), rotating blade stubs were used to introduce the effect of rotor hub wake. Nevertheless, for the CFD-based optimisation performed by Garavello et al(Reference Garavello, Benini, Ponza, Scandroglio and Saporiti7), a dedicated non-uniform disc actuator model was used to model the rotor/propeller inflow effect, thus, a direct comparison between CFD and test results with stubs was not feasible.
The flow rate at the AIP was evaluated by the surface integral of the axial velocity measured by the directional probes. A preliminary evaluation of the accuracy of this method, carried out by comparison with direct flow rate measurements performed by a Venturi tube, leads to a maximum error less than 2%.
The following sections discuss the test results obtained with the model configurations with and without the stubs reproducing both the cruise and the conversion flight conditions, as one of the goals of the activity was to evaluate the effectiveness of the duct optimisation at conditions other than the design condition (cruise).
3.1 Directional probes measurements
The global behaviour of the flow field at the AIP is illustrated by comparing the contours of the total pressure coefficient C Pt evaluated over the AIP surface. A quantitative analysis of the baseline and optimised duct performance in terms of total pressure losses is reported by the comparison of the distribution along the AIP of the average  $C_{\bar{P_t}}(60^\circ )$ evaluated over an azimuthal sector θ of 60°, used as a standard azimuthal amplitude for the evaluation of air-intake performance(Reference Atalayer, Friedrichs and Wulff4,Reference Saha, Singh and Seshadri5) . Analogously, a quantitative comparison of flow distortion and swirl is reported by the comparison of the DC(60°) and SC(60°) coefficient distributions, calculated as defined by Seddon and Goldsmith(Reference Seddon and Goldsmith2). In particular, the DC(60°) coefficient compares the average total pressure evaluated over the entire AIP surface with the average total pressure evaluated over an azimuthal sector θ of 60°, while the SC(60°) coefficient is defined as the ratio between the average circumferential velocity evaluated over the same azimuthal sector θ of 60° and the bulk velocity measured at the AIP.
3.1.1 Clean model configuration
Figure 7 shows the clean model without stubs installed in the wind-tunnel test section for the different flight conditions tested.
The ERICA air-intake model in clean configuration.
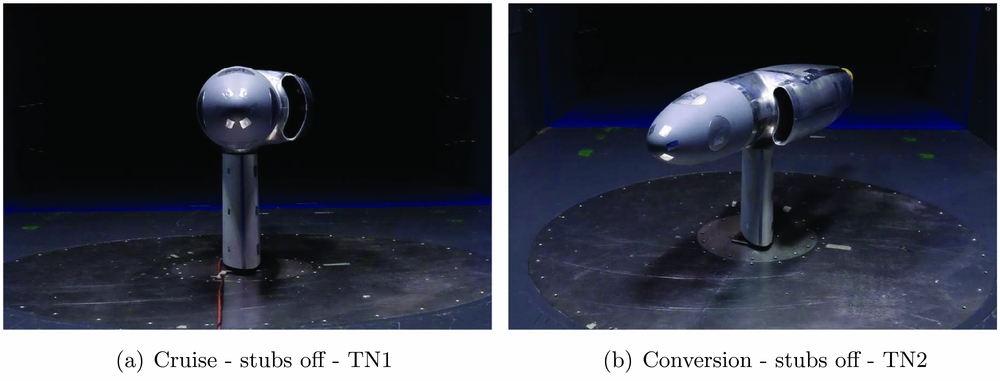
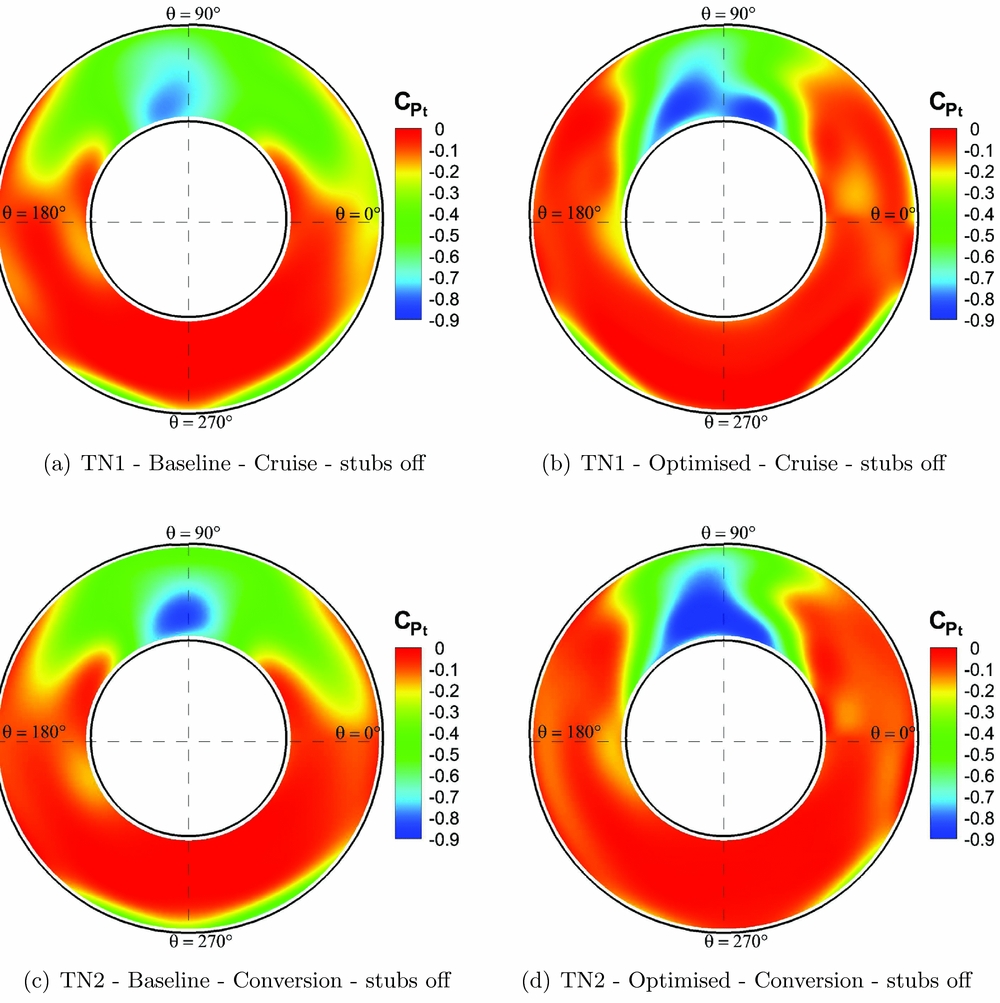
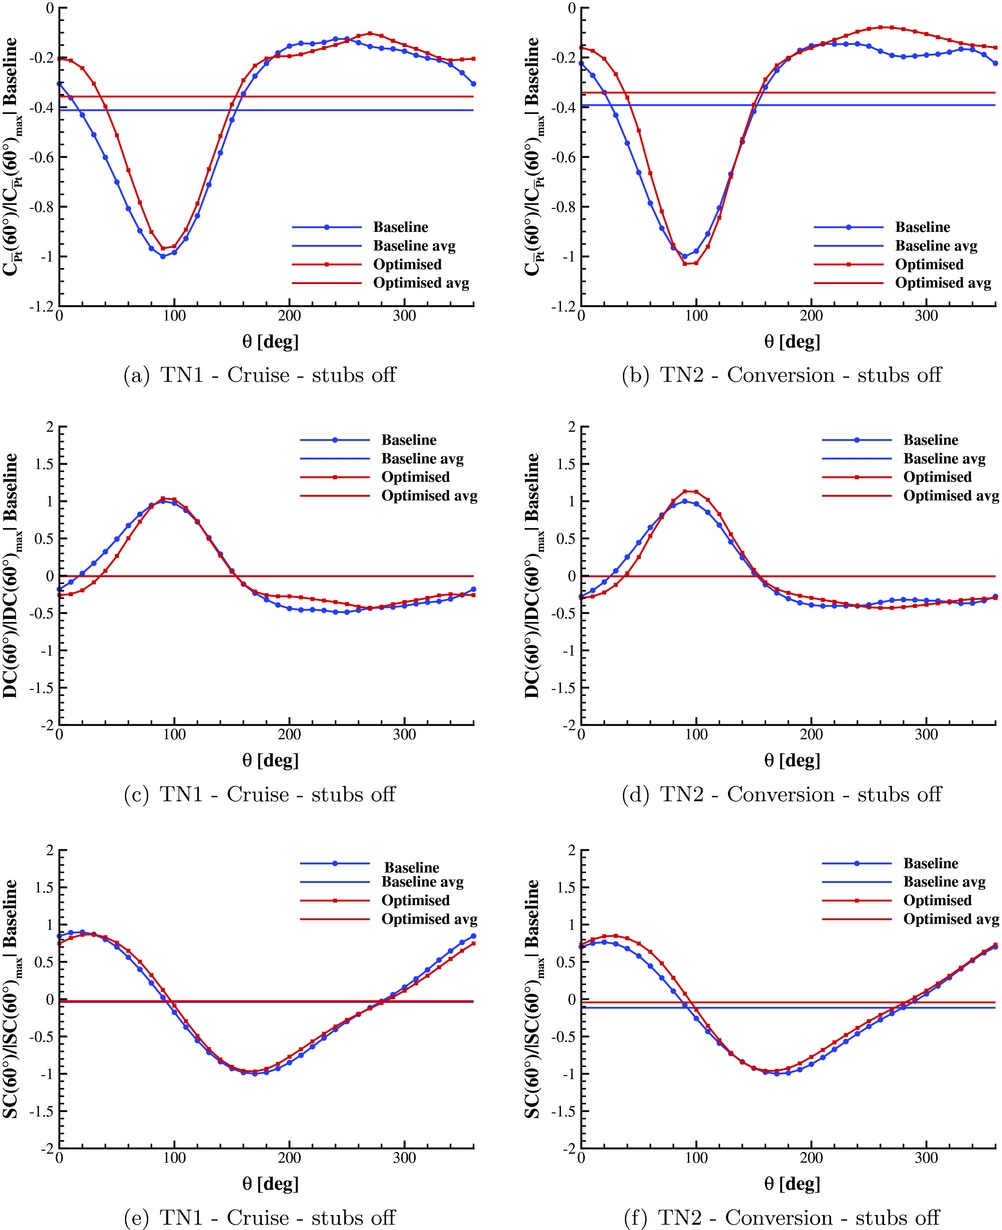
Figure 8 shows the comparison of the C Pt contours obtained for the clean model configuration tests. Each subplot of Fig. 8 illustrates also the origin and sense of rotation of the azimuthal angle θ along AIP used for the representation of all the performance coefficients distributions compared in Figs 9 and 12.
Comparison of the contours of the total pressure coefficient measured at the AIP for stubs-off configuration.
Comparison of the local total pressure, distortion and swirl coefficients distribution along AIP for stubs-off configuration.
The C Pt contours comparison for the clean model configuration in cruise (TN1), shows a highly distorted flow in the upper region of the AIP for the baseline duct (see Fig. 8(a)). This feature is related to the flow separation due to the high slope of the S-shaped duct. In particular, the extent of this distorted flow region is smaller for the optimised duct geometry, as can be seen in Fig. 8(b). Moreover, in the lower portion of the AIP, two small symmetric separated flow regions can be observed. Indeed, in correspondence of the AIP section, the flow is not completely reattached downstream the second bend of the S-shaped duct. Notably, for the optimised duct, these separated flow regions present a slightly smaller extent and a different azimuthal location with respect to the baseline geometry results.
The comparison of the  $C_{\bar{P_t}}(60^\circ )$ distribution shows a higher total pressure level for the optimised duct over the whole upper region (0° < θ < 180°) and the right-bottom quarter of the AIP. This produces a remarkable reduction of the total pressure loss, as highlighted by the horizontal lines in Fig. 9(a) representing the average integral values of the total pressure coefficient on the AIP surface (
 $C_{\bar{P_t}}$). In particular, a reduction of about 13% of the baseline duct average total pressure drop was found with the optimised geometry for the stubs-off model in cruise. Moreover, the comparison of DC(60°) and SC(60°) distributions and of their average values shows that the optimised geometry practically does not produce an alteration of the flow behaviour in terms of distortion or swirl (see Figs 9(c) and (e)).
A similar behaviour of the flow fields was obtained for the clean model in conversion mode (TN2), even if the nacelle has a high angle-of-attack δn = 30°. Indeed, as highlighted by the C Pt contours shown in Figs 8(c) and (d), the optimised geometry produces a less extended distorted flow region in the upper part of the AIP and an apparent reduction of the symmetrical separated flow region in the lower part of the AIP surface. The comparison of the  $C_{\bar{P_t}}(60^\circ )$ distribution shows a higher total pressure level for the optimised duct almost over the whole AIP surface with the only exception in a limited sector around θ = 100° (see Fig. 9(b)). This leads to an overall reduction of about 13% of the baseline duct average total pressure drop, analogous to what was found in cruise. Similarly to the cruise case, the comparisons of DC(60°) and SC(60°) distributions do not show apparent differences on flow distortion (see Fig. 9(d)) or swirl between the baseline and optimised geometry cases. In particular, a slight increase of the average swirl coefficient is observed for the optimised duct in conversion (see Fig. 9(f)). The similar gain in performance observed between cruise and conversion tests indicates the effectiveness of the optimised duct geometry at conditions other than the design flight condition.
3.1.2 Model with rotating stubs configuration
Figure 10 shows the model equipped with rotating stubs installed in the wind-tunnel test section for the different flight conditions tested. The comparison of the two pictures reported in Fig. 10 clearly shows that, differently from the cruise configuration, in conversion mode, the rotor stubs do not occlude the air-intake due to the conspicuous angle-of-attack of the nacelle (δn = 30°).
The ERICA air-intake model with rotating stubs.
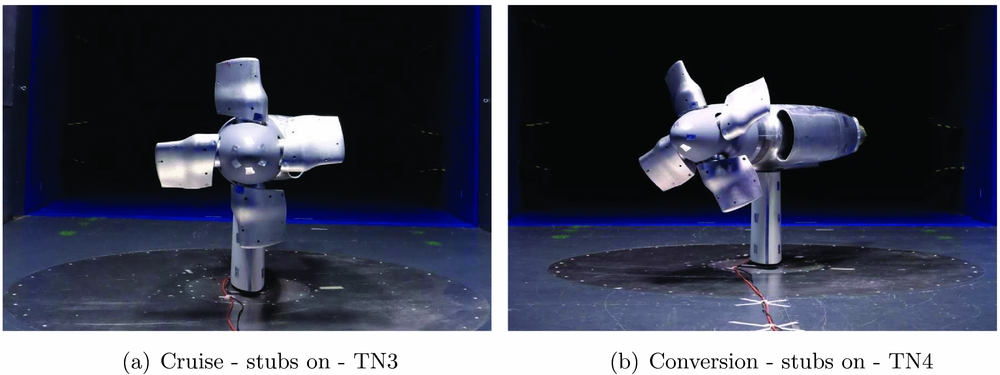
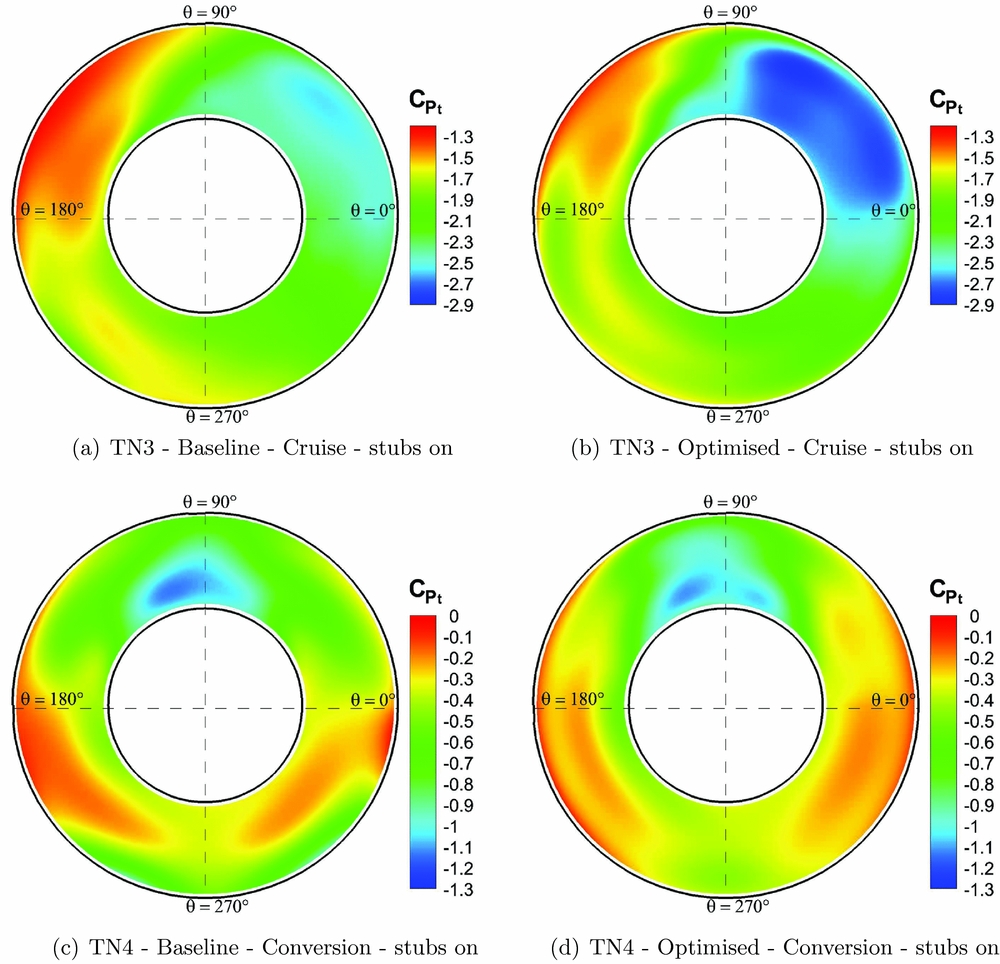
The results of the tests performed with the rotating stubs indicates that for cruise condition (TN3) the presence of the rotating hub significantly alters the flow at the AIP. Indeed, the C Pt contours evaluated with the rotating stubs in cruise show a flow field behaviour characterised by a high swirl for both the baseline and the optimised duct, differently from the ones observed in the same condition for the clean model configuration (see Figs 11(a) and (b)). As can be clearly deduced from Fig. 10(a), this different behaviour could be explained by strong disturbances produced by vortical structures released from the stubs root or tip and ingested by the intake. This feature jeopardises the gain in terms of total pressure loss reduction observed with the optimised duct for the stubs-off configuration in cruise. Indeed, an increase of 6% of the baseline duct average total pressure drop at the AIP was found with the optimised duct (see Fig. 12(a)). Moreover, the comparison of DC(60°) and SC(60°) distributions does not show remarkable differences in terms of flow distortion or swirl between the baseline and optimised ducts, as also indicated by their average values (see Figs 12(c) and (e)). Generally speaking, the presence of the stubs produces a substantial change of the flow field that apparently influences the obtained results in terms of air-intake pressure losses. A more complete test, including rotors, would be required to fully understand this phenomenon. Nevertheless, as previously mentioned, the use of rotating stubs for rotorcraft wind-tunnel tests is often an unavoidable choice. Thus, the present results indicate that the design of the wind-tunnel model rotor hub equipped with blade stubs, particularly their length, is a very critical aspect for a proper experimental evaluation of turboprop air-intake performance.
Comparison of the contours of the total pressure coefficient measured at the AIP for stubs-on configuration.
Comparison of the local total pressure, distortion and swirling coefficients distribution along AIP for stubs-on configuration.
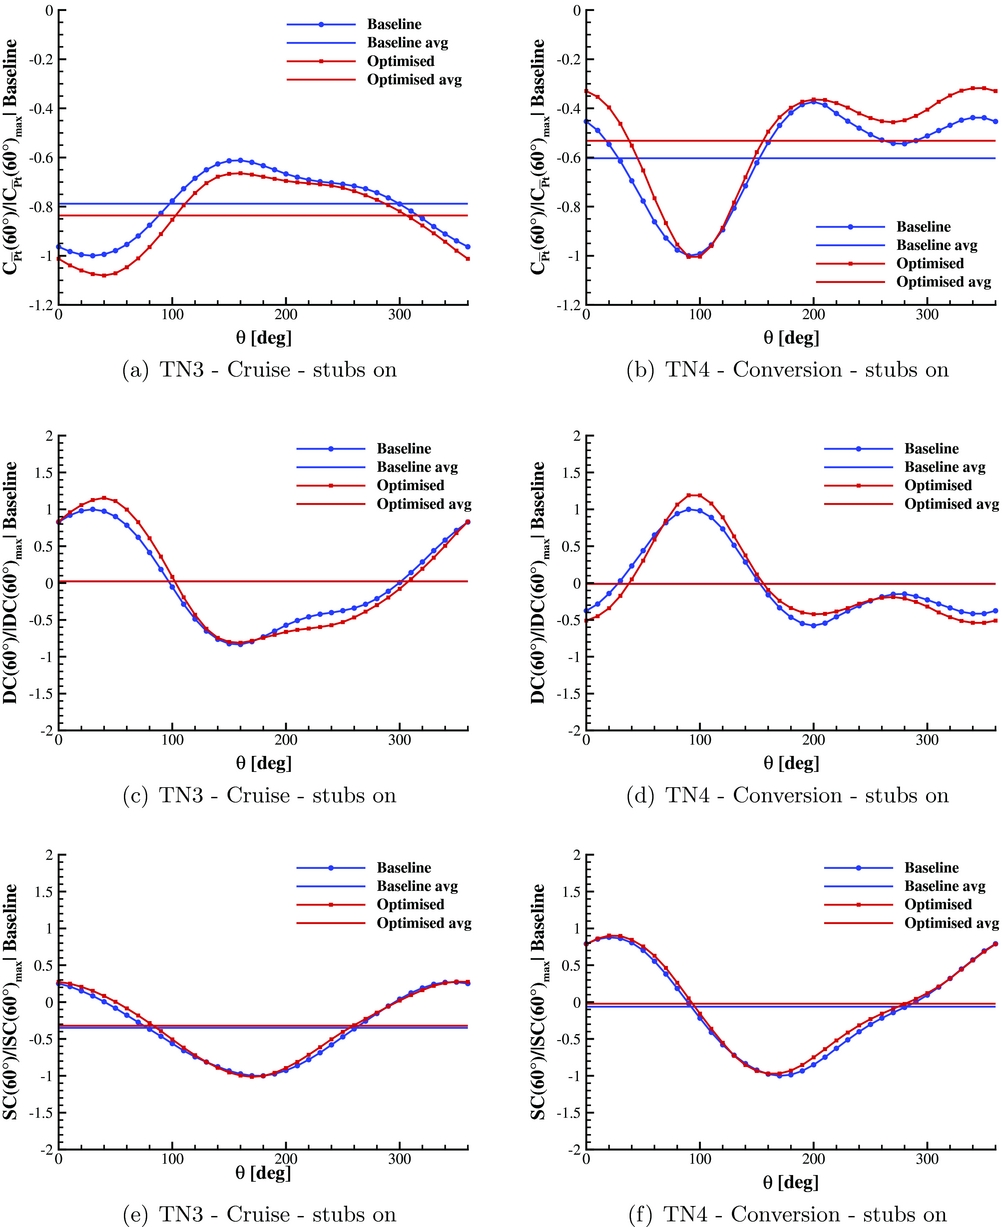
The previous considerations about rotor hub effect are confirmed by the test results obtained in conversion with rotating stubs (TN4). In particular, the C Pt contours at the AIP shown in Figs 11(c) and (d) indicate that in the conversion condition, the rotating hub produces a remarkably lower effect on the internal duct flow field with respect to cruise.
For this flight condition, the test results indicate that the wake of rotor hub interacts weakly with the duct inlet as the optimised duct geometry produces the same performance gain observed for the clean model configuration. Indeed, a higher total pressure level was observed for the optimised duct over almost the whole AIP surface (see Fig. 12(b)), thus leading to an overall reduction of about 12% of the baseline duct average total pressure drop at the AIP, similarly to the gain found for the stubs-off configuration. A very similar behaviour was also observed from the comparison of the distortion and swirl coefficient distributions (see Figs 12(d) and (f)). In particular, a very limited increase of the average swirl coefficient is observed for the optimised duct.
3.2 Surface pressure measurements
Further insight into the effect of the shape optimisation on the flow behaviour in the internal ducts can be obtained by comparing the pressure coefficient distribution measured on the ducts surface along the bent upper central line. The surface pressure measurements are presented just for the clean model configuration without stubs in order to deduce a more clear and quantitative analysis of the effects of the shape changes on the internal flow, avoiding the aerodynamic interference of the rotor wake.
The C P distributions measured in cruise (TN1) presented in Fig. 13(a) show that the smoother curvature of the optimised S-duct, together with the more gradual variation of the area of the transversal section, produces an apparent decrease of the C P curve slope on the upper bent central line (depicted in red). The pressure value at the end of the S-shaped intake duct (i.e. just before the AIP section) is higher for the optimised duct, confirming the already-mentioned lower head loss.
Comparison of pressure coefficient distribution measured on the internal ducts surface along the longitudinal central line.
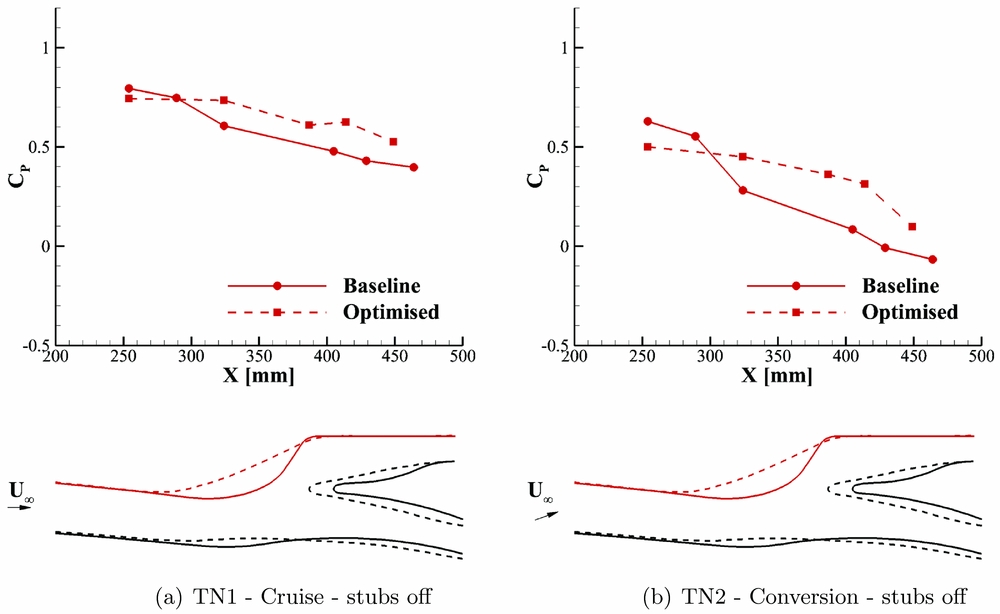
The C P distributions measured in conversion (TN2) presented in Fig. 13(b) show a significant reduction of the adverse pressure gradients for the optimised duct on the bent central line. Similarly to cruise, in conversion mode, the optimised duct leads to a higher pressure in front of the AIP section.
Generally speaking, the C P distribution comparisons on the ducts longitudinal central line confirmed and gave a quantitative evaluation of the real effects expected from the CFD shape optimisation.
4.0 CONCLUSIONS
A comprehensive experimental activity was performed in the POLIMI large wind tunnel to evaluate the performance of the CFD optimisation of the ERICA tiltrotor air-intake internal duct carried out by GRC2 in the frame of a previous EU funded project. The scaled model of the air-intake was purposely designed including a tiltable external portion of the wing to reproduce different flight conditions, including cruise and conversion. The total pressure losses and flow distortion at the AIP were evaluated using directional probes sweeping the entire AIP section. Moreover, pressure measurements carried out on the internal ducts surface were useful to provide further insight about the real effects introduced on the internal flow by the duct shape modification.
The comparison between the experimental results obtained with the baseline and optimised ducts confirmed the effectiveness of the optimised geometry in terms of reduction of the total pressure drop at the AIP with the only exception for the cruise condition with rotating stubs. This result highlighted that a very critical aspect for air-intake performance tests is the design of the stubs, particularly of their length. As a matter of fact, the presence of the stubs altered the flow field and, consequently, the real performance of the internal duct could be highly affected by the disturbance of vortical structures released from the stubs’ root or tip ingested in the duct inlet. Further research activities can be suitable to fully understand this phenomenon, in particular, experiments or numerical simulations including complete rotors or blade stubs with a different root shape. The similar benefit in terms of pressure loss reduction observed for both stubs-on and stubs-off configurations in conversion mode confirmed the effectiveness of the optimised duct when the wake of the rotor hub interacts weakly with the duct inlet due to the high angle-of-attack of the nacelle. Moreover, the experimental results obtained in conversion suggest that the CFD optimisation was also suitable outside of the design flight condition.
The experimental database collected in this activity will be useful to provide the guidelines for the design of the air-intake of the Next Generation Civil TiltRotor (NextGenCTR) that will be developed by GRC2 in the frame of the CleanSky 2 programme.
ACKNOWLEDGEMENTS
The research leading to these results has received funding from the European Community’s Seventh Framework Programme (FP7/2007-2013) for the Clean Sky Joint Technology Initiative under grant agreement no. 619949.



