INTRODUCTION
Protein-containing materials from archaeological and geological sites are susceptible to chemical and environmental processes, which can result in degradation (diagenetic alteration/breakdown) and introduction of exogenous carbon-containing compounds (contamination). In particular, humic substances from the soil may interact with the material of interest and cause major problems for any isotopic application such as radiocarbon (14C) dating (Stafford et al. Reference Stafford, Brendel and Duhamel1988; van Klinken and Hedges Reference van Klinken and Hedges1995; van Klinken Reference van Klinken1999; Van Strydonck et al. Reference Van Strydonck, Boudin and Ervynck2005; Boudin et al. Reference Boudin, Boeckx, Vandenabeele, Mitschke and Van Strydonck2011).
Bones are one of the most preferable materials for paleodietary and archaeological chronology studies because they are often directly related to the prehistoric event. The collagen fraction of bones is usually used for stable isotope and 14C analyses. This fraction is obtained by dissolving the demineralized bone in hot acidic water (Longin Reference Longin1971). However, this treatment will also lead to the presence of other hot water soluble components in the collagen such as humic substances (van Klinken and Mook Reference van Klinken and Mook1990). Adding an alkaline step helps to remove basic soluble organics such as humic acids, but not completely (Arslanov and Svezehentsev Reference Arslanov and Svezehentsev1993; van Klinken and Hedges Reference van Klinken and Hedges1995). Ultrafiltration of bone collagen, dissolved as gelatin (molecular weight [MW] ~100,000 Dalton), has received considerable attention as a means to obtain more reliable 14C dates and stable isotope signatures (Brown et al. Reference Brown, Nelson, Vogel and Southon1988; Bronk Ramsey et al. Reference Bronk Ramsey, Higham, Bowles and Hedges2004; Higham et al. Reference Higham, Bronk Ramsey, Karavanic, Smith and Trinkaus2006; Mellars Reference Mellars2006). This is an effective method for removal of low-molecular weight contaminants from bone collagen but it does not remove high-molecular-weight contaminants, such as cross-linked humic-collagen complexes (Brock et al. Reference Brock, Bronk Ramsey and Higham2007). Moreover, comparative dating studies have raised the question whether this cleaning step itself may introduce contamination with carbon from the filters used (Bronk Ramsey et al. Reference Bronk Ramsey, Higham, Bowles and Hedges2004; Brock et al. Reference Brock, Bronk Ramsey and Higham2007; Hüls et al. Reference Hüls, Grootes and Nadeau2007, Reference Hüls, Grootes and Nadeau2009). Wool, hair, and silk are gaining more attention as suitable 14C dating materials due to their short lifespans (Taylor et al. Reference Taylor, Hare, Prior, Kirner, Wan and Burky1995; Geyh Reference Geyh2001; Van Strydonck et al. Reference Van Strydonck, De Moor and Bénazeth2004).
14C dating of leather textiles and parchments (a collagen-based writing medium made from processed, but untanned, skins of cattle, sheep, and goats) are also increasingly conducted (Mannering et al. Reference Mannering, Possnert, Heinemeier and Gleba2010; Brock Reference Brock2013). Until recent times, dating of textiles was based on stylistical methods but 14C dating can refine and/or improve this stylistical dating (Van Strydonck et al. Reference Van Strydonck, De Moor and Bénazeth2004; Mannering et al. Reference Mannering, Possnert, Heinemeier and Gleba2010). The importance of 14C dating of parchments is that parchments provide a lot of archaeological and historical information, both from the written information on the parchment and also relating to the processes involved in the manufacture (Brock Reference Brock2013). Quality control of parchments can be done by analyzing the C:N ratio and comparing them with the C:N range of collagen defined by De Niro (Reference De Niro1985) as they are untanned (Brock Reference Brock2013). However, setting up a quality-control parameter for tanned leathers is more challenging because tanning will increase the C:N ratio due to the chemical composition of tannins. Wouters (Reference Wouters1992) quantified between 3 and 12% tannic acids in historical leathers. Tannic acids contain circa 50%wt of carbon (Haslam Reference Haslam1966). This signifies that tannic acids can add 1.5–6%wt of carbon to the leather. This implies a C:N increase of 0.1–0.4.
Therefore, the C:N range of collagen defined by De Niro (Reference De Niro1985) cannot be used for tanned leathers. Vegetable tanning was developed by the Egyptians and Hebrews about 400 BC and was used until the end of the 19th century (Groenman-Van Waateringe et al. Reference Groenman-Van Waateringe, Kilian and van Londen1999). Then, it was replaced by chemical tanning (by using chrome salts) (Knapp Reference Knapp1858). The tanning process derives its name from tannin (tannic acid), a naturally occurring plant polyphenol and its main characteristic is that it binds and precipitates protein (Cobzac et al. Reference Cobzac, Moldovan, Olah, Bobos and Surducan2005). Extracts are taken from the parts of plants (such as roots, bark, leaves, and seed husks) that are rich in tannin.
Wool/hair, silk, and leather are pretreated with solvents followed by an acid-base-acid treatment for stable isotopes and 14C analyses. However, this pretreatment may not be adequate for removing all contaminants (Kim et al. Reference Kim, Southon, Imamura and Sparks2008; Boudin et al. Reference Boudin, Boeckx, Vandenabeele, Mitschke and Van Strydonck2011; Santos et al. Reference Santos, Martinez De La Torre, Boudin, Bonafini and Saverwyns2015).
Separation, isolation, and 14C dating of individual amino acids hydrolyzed by preparative high performance liquid chromatography (HPLC) is a good strategy for dealing with contamination in proteins but it is a time-consuming and labor-intensive technique, and also, a large sample is necessary to isolate single amino acids for 14C dating (Gillespie and Hedges Reference Gillespie and Hedges1983; Gillespie et al. Reference Gillespie, Hedges and Wand1984; Stafford et al. Reference Stafford, Jull, Brendel, Duhamel and Donahue1987, Reference Stafford, Brendel and Duhamel1988, Reference Stafford, Hare, Currie, Jull and Donahue1991; van Klinken and Mook Reference van Klinken and Mook1990; Tripp et al. Reference Tripp, McCullagh and Hedges2006; McCullagh et al. Reference McCullagh, Marom and Hedges2010; Marom et al. Reference Marom, McCullagh, Higham, Sinitsyn and Hedges2012, Reference Marom, McCullagh, Higham and Hedges2013; Chavan et al. Reference Chavan, McCullagh, Hedges, Bonsall, Boroneant, Bronk Ramsay and Higham2013).
Another option is cross-flow nanofiltration of hydrolyzed proteins, i.e. amino acids, which is more straightforward and less labor-intensive than individual amino-acid isolation by HPLC. Another advantage is the possibility of using a ceramic filter to avoid exogenous carbon contamination via the filter (Boudin et al. Reference Boudin, Boeckx, Buekenhoudt, Vandenabeele and Van Strydonck2013a, Reference Boudin, Boeckx, Vandenabeele and Van Strydonck2013b, Reference Boudin, Boeckx, Vandenabeele and Van Strydonck2014; Santos et al. Reference Santos, Martinez De La Torre, Boudin, Bonafini and Saverwyns2015)
Nanofiltration is an intermediate filtration process between reverse osmosis (RO) and ultrafiltration (UF) that rejects molecules having a size of about one nanometer (Eriksson Reference Eriksson1988). The pore sizes of the membranes used range from 0.5 to 2 nm and corresponds with Molecular weight of 300–500 Dalton (Mulder Reference Mulder1996). A high pressure between 10–50 bar is applied and separation is based on differences in solubility and diffusivity (Mulder Reference Mulder1996). It has been introduced since the 1980s and is mainly used for softening water and removing organics. It has found many applications in various water purification and treatment uses as well as product separation processes because of its two remarkable features: one is the molecultar weight, which ranges from 200 to 2000 Dalton; the other is the separation of electrolytes due to the membrane materials containing charged groups (Schafer et al. Reference Schafer, Fane and Waite2004; Wang et al. Reference Wang, Shang, Wang, Wu and Tu2009). During cross-flow filtration the feed flow travels tangentially across the surface of the filter. The main advantage of this filtration is that the filter cake or clogging layer (which can block the filter) is substantially washed away during the filtration process, thereby increasing operation time of a filter unit (Koros et al. Reference Koros, Ma and Shimidzu1996). Cross-flow nanofiltration of the hydrolyzed protein leads to more accurate 14C results, as described in Boudin et al. (Reference Boudin, Boeckx, Buekenhoudt, Vandenabeele and Van Strydonck2013a, Reference Boudin, Boeckx, Vandenabeele and Van Strydonck2013b, Reference Boudin, Boeckx, Vandenabeele and Van Strydonck2014) and Santos et al. (Reference Santos, Martinez De La Torre, Boudin, Bonafini and Saverwyns2015). This study presents the results of the analysis of contaminated protein-containing samples after conventional pretreatment as well as after hydrolysis into amino acids and cross-flow nanofiltration.
MATERIALS AND METHODS
Sample Selection
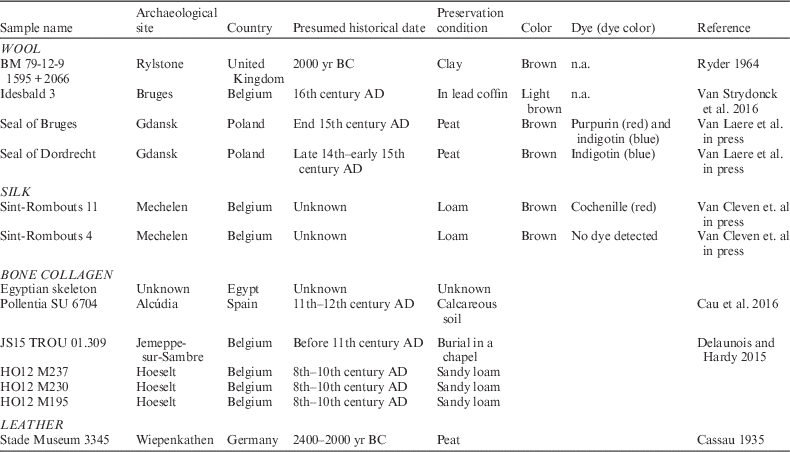
Protein-containing samples from different material types (wool, silk, leather, and bone collagen), selected to represent various ages and preservation conditions, were obtained from sites listed in Table 1. The textile color determined by visual inspection and the dye compounds with obtained dye color (shown between brackets) are also shown Table 1.
Archaeological samples, chosen to represent various potential ages, preservation conditions, were obtained from different sites. The color determined by visual inspection, dye compounds with obtained dye color written between brackets are shown. Dye identification was done by high-performance liquid chromatography coupled to a photo diode array detector following the method described in Vanden Berghe et al. (Reference Van den Berghe, Gleba and Mannering2009). n.a.=not analyzed.

Visual inspection of the wool and silk samples does not indicate degraded textile fabrics. The texture and morphology of all the samples are still visible with the naked eye and may indicate well-preserved samples. Nevertheless, all the samples were brown colored, which may indicate humic substance contamination. Some of the samples (seal of Bruges, seal of Dordrecht, Sint-Rombouts 11, and Sint-Rombouts 4) had originally another color shown by the dye analysis (see Table 1). This is an extra indication of humic substance contamination and can be explained that these samples were buried in soils where humic substances are present (see Table 1).
The color and texture of the extracted collagen of bone and leather may provide some information about the collagen quality. In general, well-preserved collagen is white and fluffy while degraded collagen is brown and crystalline.
However, carbon and nitrogen content analyses are performed to determine the preservation state and the C:N ratio is analyzed to detect the contamination of the samples. This will be discussed below in the sections “Sample Quality Assessment” and “Results and Discussion”.
Sample Preparation
For Bulk Analyses
Collagen was extracted from the bones following the Longin method (Longin Reference Longin1971). The chemical pretreatment consists of a demineralization with 2.4M HCl for 20 min. An alkaline washing with 0.25M NaOH for 15 min is performed to remove contaminants like fulvic and humic acids that can be present in the bone matrix. A final rinse with 0.3M HCl is performed to remove any calcium carbonate precipitation. Each treatment is followed by a Milli-Q water rinsing using an Ezee-Filter™ separator, allowing a better conservation of the sample and a faster process. The sample is than soaked in a closed test tube containing a pH=3 (HCl 10−3M) solution at 90°C for 10 hr to obtain the total extraction of the collagen protein. The remaining solid is separated from the solution with a Büchner funnel by vacuum suction with glass fiber prefilters (7 μm, Merck–Millipore). The solution containing the collagen protein is freeze-dried for 10–15 hr.
The wool, silk, and leather samples were pretreated successively with hexane, acetone, ethanol, 0.25M NaOH, 0.3M HCl, and Milli-Q water (Merck Millipore, Belgium), as described in detail in Boudin et al. (Reference Boudin, Boeckx, Vandenabeele, Mitschke and Van Strydonck2011) for bulk 14C and C:N, carbon and nitrogen content analysis. The pretreatment steps with different solvents are necessary to remove contaminants because depending on the textiles’ function, history, and preservation, some types of contaminants such as waxes, resin, fat of plant and animal origin, or even tar can be expected (Hadjas et al. Reference Hadjas, Cristi, Bonani and Maurer2014). Extracted bone collagen, pretreated wool, silk and leather samples will be referred to as bulk in this paper.
Treatment for Cross-Flow Nanofiltrated Amino Acid Analyses
The in-house–developed filtration installation and the used protocol is described by Boudin et al. (Reference Boudin, Van den Brande, Synal, Wacker and Van Strydonck2013b).
A ceramic filter with a cutoff of 368 Dalton (Buekenhoudt et al. Reference Buekenhoudt, Bisignano, DeLuca, Vandezande, Wouters and Verhulst2013) was used in order to selectively collect amino acids in the permeate of hydrolyzed protein samples (molecular weight of amino acids varies between 75.07 and 204.23 Dalton) (Asquith Reference Asquith1977) and the humic substances (molecular weight of humic substances varies between ca. 1000 and 300,000 Dalton) (Stevenson 1982) in the retentate. This filter can theoretically retain 90% of 368 Dalton and greater molecules by a single cross-flow nanofiltration.
For cross-flow nanofiltrated amino acid analyses the pretreated bulk samples underwent the following steps:
-
1. Hydrolysis of ca. 15–50 mg material using 2 mL 6M HCl in a sealed tube under N2 atmosphere at 110°C for 24 hr;
-
2. The hydrolysate was filtrated through a 0.7-μm glass fiber filter (Millipore APFF03700);
-
3. The filtrate was diluted to 100 mL with Milli-Q water;
-
4. The diluted filtrate was treated by cross-flow nanofiltration;
-
5. The permeate, which are the cross-flown nanofiltrated amino acids, was freeze dryed;
-
6. The freeze-dried permeate was dissolved in 1 mL Milli-Q water;
-
7. 50 μL of solution was transferred in a tin cup and dried at 50°C for and C:N analysis;
-
8. The remaining solution was transferred into a quartz tube with CuO and Ag and dried in a desiccator for graphite production and subsequent 14C analysis.
Sample Quality Assessment
Carbon and nitrogen contents were used as indicators for degradation/preservation and C:N ratio as criteria of contamination for bulk samples. Convergence of the 14C dates with expected age was an additional quality-control tool (in case the contamination has another 14C age than the sample).
Carbon and Nitrogen Contents and C:N Ratio
C:N ratio analyses were done on the bulk samples and the permeate of the hydrolyzed protein sample. Carbon and nitrogen contents were determined from the pretreated bulk samples.
Analyses were performed in duplicate on a ThermoFlash EA/HT elemental analyzer. The standard used was acetanilide (0.5–1 mg was used). Analytical precision was 0.1 for C:N ratio based on multiple measurements of the standard acetanilide.
Classification of Uncontaminated vs. Contaminated
The C:N ratio of all the samples was measured to categorize the collagen sample as uncontaminated or contaminated. The applied criteria to define uncontaminated archaeological samples were as follows:
-
1. Collagen: C:N ratio between 2.9 and 3.6 (De Niro Reference De Niro1985; Ambrose Reference Ambrose1990);
-
2. Wool: C:N between 3.4 and 3.8 (Boudin et al. Reference Boudin, Van den Brande, Synal, Wacker and Van Strydonck2015);
-
3. Silk: C:N between 2.9 and 3.4 (Boudin et al. Reference Boudin, Bonafini, Vanden Berghe and Maquoi2016).
Samples not fulfilling these conditions (i.e. higher C:N) were defined as contaminated. A higher C:N is the result of introduction of exogenous carbon-containing compounds (i.e. contamination).
Classification of Well-Preserved vs. Poorly Preserved (Degraded)
The amount of carbon and nitrogen present in the bulk sample (bone gelatin, wool, or silk) in relation to the bulk weight was determined and will be referred to as carbon and nitrogen content in weight percent (%wt). These two quality indicators provide information on protein degradation. A higher %C than the average %C of modern bulk may indicate contamination.
The carbon and nitrogen contents of modern undyed, mordanted, non-mordanted, and naturally dyed silk (n=14, all Bombyx mori) were determined, 44.3±2.6%wt and 16.7±0.7%wt, respectively (Boudin et al. Reference Boudin, Boeckx, Vandenabeele and Van Strydonck2014). Ambrose (Reference Ambrose1990) cites a collagen carbon and nitrogen contents range for modern bone and tooth between 15.3 to 47%wt and 5.5 to 17.3%wt for carbon and nitrogen, respectively. Hair protein and thus also wool contains about 45%wt of carbon and 15%wt of nitrogen (Benfer et al. Reference Benfer, Typpo and Graff1978).
The amount of extracted collagen (gelatin) in relation to the weight of the whole bone sample will be referred to as collagen weight proportion in percent (% collagen). The collagen yield (%wt) is a quality indicator for collagen preservation. The threshold used in our laboratory is 2%wt and bones containing less than 2% collagen are considered as poorly preserved.
14C Dating
Samples were transferred into quartz tubes with CuO and Ag and combusted to CO2. Graphitization of CO2 was carried out using H2 over a Fe catalyst. Targets were prepared at the Royal Institute for Cultural Heritage in Brussels (Belgium) (Van Strydonck and van der Borg 1990–1991) and 14C concentrations were measured with accelerator mass spectrometry (AMS) at the Royal Institute for Cultural Heritage, Brussels, Belgium (Boudin et al. Reference Boudin, Bonafini, Vanden Berghe and Maquoi2016). 14C results are expressed in pMC (percentage modern carbon) and indicate the percent of modern (1950) carbon normalized to δ13C=–25‰ using the δ13C measurements (Stuiver and Polach Reference Stuiver and Polach1977).
Calibrations of 14C dates and χ2-test (weighted mean) calculations were performed using OxCal 3.10 and the IntCal13 calibration curve data (Shennan Reference Shennan1988; Bronk Ramsey Reference Bronk Ramsey1995; Bronk Ramsey Reference Bronk Ramsey2001; Reimer et al. Reference Reimer, Bard, Bayliss, Beck, Blackwell, Bronk Ramsey, Buck, Cheng, Edwards, Friedrich, Grootes, Guilderson, Haflidason, Hajdas, Hatté, Heaton, Hoffmann, Hogg, Hughen, Kaiser, Kromer, Manning, Niu, Reimer, Richards, Scott, Southon, Staff, Turney and van der Plicht2013).
RESULTS AND DISCUSSION
Wool Samples
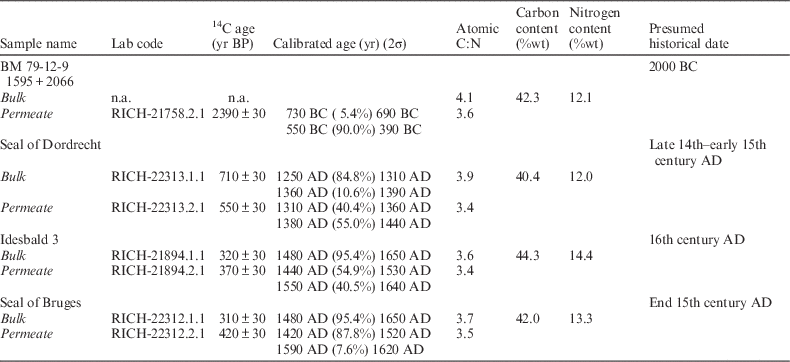
Table 2 lists the results of wool samples.
Laboratory code, 14C ages (yr BP), calibrated ages (yr) (2σ), atomic C:N ratio of wool samples before (bulk) and after (permeate) cross-flow nanofiltration (analytical precision for C:N ratio is 0.1), carbon content (%wt) and nitrogen content (%wt) of bulk (analytical precision is 0.5).

With values of 4.1 and 3.9, respectively, bulk C:N ratio of the samples “BM 79-12-9 1595+2066” and the “seal of Dordrecht” indicates contaminated wool. The C:N range for uncontaminated wool goes from 3.4 to 3.8 (Boudin et al. Reference Boudin, Van den Brande, Synal, Wacker and Van Strydonck2015). Cross-flow nanofiltration decreased the C:N ratio for these two samples (3.6 and 3.4, respectively), falling within the C:N range for uncontaminated wool and resulting in a more accurate 14C date.
However, the obtained 14C date for “BM 79-12-9 1595+2066”, 2390±30 yr BP (550–390 yr BC for 90% of the 2σ calibrated probability of the calendar age) is not in agreement with the presumed historical date (2000 yr BC). This wool was excavated in Rylstone (United Kingdom) from an inhumation burial in an oak coffin that is typically known for the Bronze Age in the United Kingdom. Either the 14C date is reliable and the oak coffin was also used in the first millennium BC, or the wool is contaminated with modern carbon, but this seems unlikely. If the wool is contaminated with modern carbon of 180 pMC (at the top of the bomb peak) the part of contamination should be 9.6% using the presumed historical date of 2000 yr BC as the right date. This contamination should have been observed in the C:N ratio. If the contamination is caused by younger modern carbon than 180 pMC, the contamination contribution should have been higher and even more observed by a higher C:N.
The 14C date of the “seal of Dordrecht” after cross-flow nanofiltration, 550 ± 30 yr BP ([1310–1440 yr AD] for 95.4% of the 2σ calibrated probability of the calendar age) fits perfectly with the presumed historical date (late 14th–early 15th century AD), while the bulk date is too old, 710±30 yr BP ([1250–1390 yr AD] for 95.4% of the 2σ calibrated probability of the calendar age).
The bulk C:N ratio of the samples “Idesbald 3” and “seal of Bruges” (3.6 and 3.7, respectively) fall within the C:N range for uncontaminated wool (3.4–3.8). Cross-flow nanofiltration decreased the C:N ratio for both samples 3.4 and 3.5, respectively). The 14C dates of the bulk and permeate of “Idesbald 3” (320 ± 30 yr BP and 370 ± 30 yr BP, respectively) are in perfect agreement (χ2-test pass at 5%, df=1 T=1.5 (5% 3.8) and both 14C dates (bulk: [1480–1650 yr AD] and permeate: [1440–1640 yr AD] for 95.4% of the 2σσ calibrated probability of the calendar age) correspond with the presumed historical date (16th century AD).
Nevertheless, the 14C dates of the bulk and permeate of “seal of Bruges” are not in agreement (310 ± 30 yr BP and 420 ± 30 yr BP, respectively) (χ2-test fails at 5%, df=1 T=7.457 [5% 3.8]). The bulk 14C date ([1480–1650 yr AD] for 95.4% of the 2σ calibrated probability of the calendar age) is too young compared with the presumed historical date (end 15th century AD). However, the permeate 14C date ([1420–1620 yr AD] for 95.4% of the 2σ calibrated probability of the calendar age) is in perfect agreement with the presumed historical date (end 15th century AD). This indicates that the sample quality of the permeate was better than of the bulk and is also reflected by the C:N ratio. The theoretical value of keratin is 3.4 and the permeate C:N ratio (=3.5) really approaches this value. The carbon content (%wt) and nitrogen content (%wt) indicate that all wool samples were well preserved.
Silk Samples
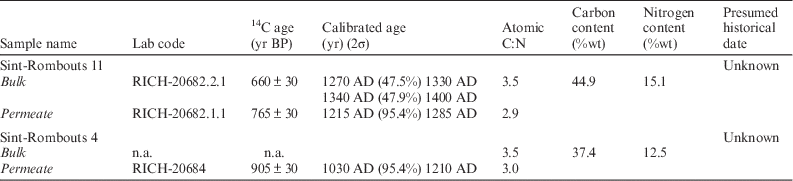
Table 3 lists the results of the silk samples.
Laboratory code, 14C ages (yr BP), calibrated ages (yr) (2σ), atomic C:N ratio of silk samples before (bulk) and after (permeate) cross-flow nanofiltration (analytical precision for C:N ratio is 0.1), carbon content (%wt) and nitrogen content (%wt) of bulk (analytical precision is 0.5).

The carbon and nitrogen contents indicate that both silk samples were well preserved. The C:N ratio of the two silk samples (3.5 and 3.5, respectively) indicates contamination (C:N range of uncontaminated silk: 2.9 and 3.4). Nevertheless, the C:N ratio after cross-flow nanofiltration for both samples (2.9 and 3.0, respectively) falls within the C:N range of uncontaminated silk (between 2.9 and 3.4) and we thus think that the nanofiltration method derived 14C ages are the reliable ones. Also, the bulk and permeate 14C date are not in agreement, shown by the failed χ2-test at 5% (df=1 T=5.956[5% 3.8]).
Bone Collagen Samples
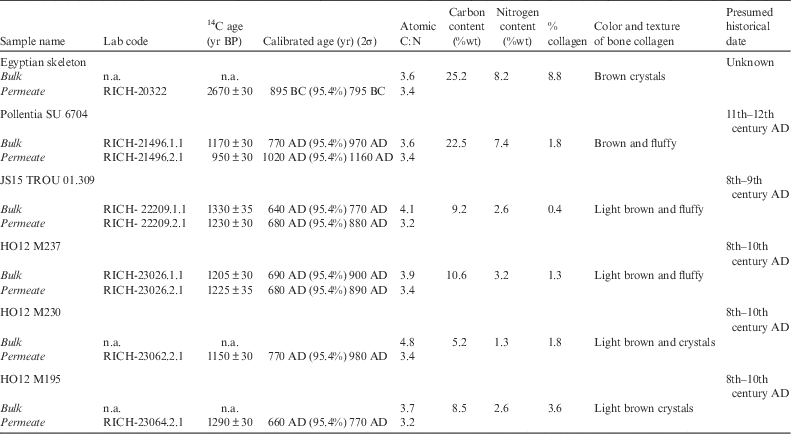
The bone collagen results are shown in Table 4.
Laboratory code, 14C ages (yr BP), calibrated ages (yr) (2σ), atomic C:N ratio of bone collagen samples before (bulk) and after (permeate) cross-flow nanofiltration (analytical precision for C:N ratio is 0.1), carbon content (%wt) and nitrogen content (%wt) of bulk (analytical precision is 0.5).

The bulk C:N ratio of the samples “Egyptian skeleton” and “Pollentia SU6704” (3.6 and 3.6, respectively) falls within the C:N range of uncontaminated bone collagen (between 2.9 and 3.6), proposed by De Niro (Reference De Niro1985). However, 14C dates with a C:N ratio of 3.6 should be used with caution as 2% of exogenous carbon increases the ratio with 0.1. Well-preserved, uncontaminated fresh bone collagen has normally a C:N ratio of 3.1–3.2. This means that the bone collagen with a C:N ratio of 3.6 contains 8% of carbon contamination and can really alter a 14C date. This is demonstrated by the sample “Pollentia SU6704”. Firstly, the color of the bone collagen was light brown, which may indicate the presence of humic substances. Secondly, the bulk 14C date, 1170±30 yr BP ([770–970 yr AD] for 95.4% of the 2σ calibrated probability of the calendar age) is too old compared to the presumed historical (11th–12th century AD) date and the permeate 14C date, 950±30 yr BP ([1020–1160 yr AD] for 95.4% of the 2σ calibrated probability of the calendar age), confirmed by a failed χ2-test at 5% (df=1 T=23.9 [5% 3.8]). Nevertheless, the permeate has a lower C:N ratio (=3.4) and its 14C date is in perfect agreement with the presumed historical date. The same bone was also analyzed by liquid scintillation counting (LSC) by the University of Barcelona and the 14C date (UBAR-1135: 968±30 yr BP) is in perfect agreement with the permeate 14C date (Cau et al. Reference Cau Ontiveros, Van Strydonck, Boudin, Mas Florit, Mestres, Cardona, Chavez-Alvarez and Orfila2016). This example demonstrates that a revision of the C:N range proposed by De Niro (Reference De Niro1985) is maybe necessary as it was set up for stable-isotope analysis, which is less susceptible to contamination than 14C analysis.
The bulk bone collagen of the Egyptian skeleton (C:N ratio=3.6) was composed of brown crystals instead of white, fluffy material. Therefore, it was chosen to perform cross-flow nanofiltration, which yielder better sample quality, demonstrated by the lower C:N ratio of the permeate.
All the other bone samples (JS15 TROU 01.309, H012 M237, H012 M230, H012 M195) had a larger C:N ratio than the upper boundary of the C:N range for uncontaminated bone collagen (see Table 4). Cross-flow nanofiltration was conducted on all these samples and resulted in a decreased C:N ratio falling within the C:N range for uncontaminated bone collagen (between 2.9 and 3.6) (see Table 4). The permeate 14C dates are also in agreement with the presumed historical dates (see Table 4).
The bulk 14C date for JS15 TROU 01.309, 13,3170 ± 30 yr BP ([640–770 yr AD] for 95.4% the 2σ calibrated probability of the calendar age) is older than the permeate 14C date, 1230±30 yr BP ([680–880 yr AD] for 95.4% of the 2σ calibrated probability of the calendar age) and the presumed historical date (8th–9th century AD) due to contamination (χ2-test fails at 5%, df=1 T=4.726 [5% 3.8]).
The bulk 14C date, 1205 ± 30 yr BP ([690–900 yr AD] for 95.4% of the 2σ calibrated probability of the calendar age) and the permeate 14C date, 1225 ± 35 yr BP ([680–890 yr AD] for 95.4% of the 2σ calibrated probability of the calendar age) of sample H012 M237 are statistically the same (χ2-test passes at 5%: df=1 T=0.2 [5% 3.8]). The elevated C:N ratio (=3.9) of the bulk collagen, indicating contaminated bone collagen, is probably due to in-situ humification.
The collagen yield, carbon and nitrogen content for all samples indicate poorly preserved bone collagen except for the samples Egyptian skeleton and Pollentia SU6704 where they indicate average bone collagen preservation. Nevertheless, the collagen of these samples was contaminated indicated by the C:N ratio and also the brownish color of the collagen.
Leather Sample
Table 5 lists the leather sample results.
Laboratory code, 14C ages (yr BP), calibrated ages (yr) (2σ), atomic C:N ratio of leather samples before (bulk) and after (permeate) cross-flow nanofiltration and of collagen extracted from leather (analytical precision for C:N ratio is 0.1), carbon content (%wt), and nitrogen content (%wt) of bulk (analytical precision is 0.5).

The 14C date of the bulk leather, 3260 ± 35 yr BP ([1620–1440 yr AD] for 95.4% of the 2σ calibrated probability of the calendar age) and collagen extracted from the leather, 3250±35 yr BP ([1620–1440 yr AD] for 95.4% of the 2σ calibrated probability of the calendar age) are too young compared to the presumed historical date of 2400–2000 yr BC. However, the C:N ratio of the bone collagen is too high and indicates contamination. Probably, humic substances from the peat bog, where the sample was excavated, contaminated the leather sample. Therefore, a cross-flow nanofiltration was conducted and a decreased C:N ratio was obtained, indicating a uncontaminated sample. However, the permeate 14C date, 3380±35 yr BP ([1760–1560 yr AD] for 95.4% of the 2σ calibrated probability of the calendar age) is still younger than expected (2400–2000 yr BC).
CONCLUSION
Cross-flow nanofiltration of hydrolyzed contaminated protein-containing samples, e.g. bone collagen, wool, leather, and silk, decreases the C:N ratio, which is indicative of contaminant removal and improvement of sample quality for 14C dating. If the C:N ratio of the permeate falls within the boundaries of uncontaminated samples, more accurate 14C dates are obtained. Cross-flow nanofiltration is a quick and non-labor intensive technique and can easily be implemented in any 14C laboratory for routine sample pretreatment analyses.