The recent politics of immigration have added to the urgency and importance of understanding why skilled immigrants move. There is strong evidence that the economic returns to US industry from science and engineering immigration are substantial (Kerr, Reference Kerr2018). And two countries in particular, China and India, have been an important source of science and engineering talent (Kerr and Lincoln, Reference Kerr and Lincoln2010). Moreover, there is reason to believe that US firms, and those in other countries, are becoming increasingly dependent on this global talent pool.
Recent research has identified factors that shape the immigration decision—economic growth, potential wages, and immigration policies all determine where an immigrant decides to move. And historically these factors have all played to the advantage of, in particular, the technology sectors of the US economy. While the USA has historically attracted many high-skilled immigrants (Khoo, Reference Khoo2014), this might be changing (USCIS, 2017). Stricter visa quotas and non-point-based systems make it harder to immigrate.
In this paper we focus on the effect of politics on the immigration decision—in particular the decision of high-skilled immigrants to move to the USA. We explore whether political populism, nativism, and anti-immigrant rhetoric—“Trumpian policies”—might deter high-skilled immigration to the USA. Nativism is “an ideology, which holds that states should be inhabited exclusively by members of the native group (the nation) and that non-native elements (persons and ideas) are fundamentally threatening to the homogeneous nation-state” (Mudde, Reference Mudde2012, 2). There is evidence that nativism has been on the rise in the USA (Wadhwa, Reference Wadhwa2009). The “Muslim ban”—immigration restrictions for Muslim-majority countries; defamations of Hispanics and African Americans as criminals and rapists; the claim that immigrants take American jobs; that Mexico is sending their criminals to the USA; and Trump's alleged dismissal of Haiti, El Salvador, and African nations as “shithole countries” are some examples of nativist frames in contemporary US discourse. This nativism forms a key constituent part of populist party strategies on the Right (Mudde, Reference Mudde2013), and is evident in Trump's rhetoric and political actions.
Our contribution is to estimate the impact of policy declarations on immigration decisions. More specifically, we measure how hostile nativist actions and rhetoric impact the destination preferences of high-skilled immigrants. Our test case is Trump's anti-immigrant rhetoric. The conventional wisdom is that, yes, nativist immigration policy has short-term political pay-offs but significant collateral economic costs. We find that these economic costs vary dependent on the migrant's country of origin: while nativist policies deter some potential migrants, this negative effect is not observed for Indian and Chinese student subjects.
Our experimental study is unique, first in that it focuses on the migration preferences of university student subjects with relatively high skills, and second that it identifies the causal effect of nativist politics on their immigration decisions. We conduct a conjoint survey experiment on students from the Nuffield Centre for Experimental Social Sciences (CESS) subject pools in Chile, China, India, and the UK to identify causal drivers of emigration preferences. China and India represent the two most important talent pools for US technology firms while immigrants from Chile and the UK have historically favored the USA as a destination.Footnote 1
The experimental design allows us to isolate the causal effect of nativist, anti-immigrant, pronouncements on where these university student subjects would choose to immigrate. The two “nativist” policy pronouncement treatments highlighted “Muslim bans” and “Deportation of illegal immigrants.” For the Chilean and UK student subjects these attributes overall had a significantly negative effect on their choice of an immigration destination. For the Indian and Chinese student subjects, on the other hand, the overall treatment effects were, at best, much weaker and typically not significant. The third treatment, identifying the USA as the immigration destination, had a significant negative effect on the choice of Chilean student subjects; had a weak negative effect on British subjects; but, again, had no significant effect on the Chinese and Indian samples. As a robustness check, we included an incentivized real effort task experiment to recover, unobtrusively, subjects’ immigration destination preferences. Consistent with the conjoint experiment findings, Chinese and Indian student subjects exhibit a significantly stronger preference for the USA than is the case for the Chilean and British student subjects.
To explore whether differences in treatment effects might be explained by non-geographic factors, we also test for alternative sources of treatment effect heterogeneity across the four experimental samples. We do not find that our results are driven by age differences between countries or different likelihoods of emigrating. We do find some suggestive evidence that the negative effect of nativist policies are particularly salient for subjects who self-identify with the political Left. These results further support our main finding that student subjects’ responses to the anti-immigrant primes differ substantially dependent on their country of origin.
1 Nativist rhetoric and immigration
As we pointed out, the use of nativist rhetoric, specifically anti-immigrant pronouncements by elected government officials, is on the rise. And there is considerable evidence suggesting that politicians articulating these themes can reap electoral benefits (Dekeyser and Freedman, Reference Dekeyser and Freedman2018; Hooghe and Dassonneville, Reference Hooghe and Dassonneville2018), at least in the short run (Monogan and Doctor, Reference Monogan and Doctor2017). Between January 2018 and January 2019, President Trump tweeted about his proposed border wall, a clear use of nativist anti-immigrant rhetoric, 179 times, and tweeted about borders, more generally, 391 times. Figure 1 shows the cumulative use of these tweets over this period.Footnote 2 While certain political episodes catalyze Trump's usage of this rhetoric, it is nevertheless clear that this nativist frame has continuously and consistently been deployed during his presidential tenure.
Cumulative tweets by President Trump mentioning “border” or “wall,” January 2018–January 2019.

While there clearly are positive electoral payoffs from this nativist rhetoric, it is plausible that these public anti-immigrant signals have significant reputation costs. By undermining a country's reputation as an immigration destination for skilled immigrants, this rhetoric could impose serious economic costs on firms that depend on foreign human capital. We implement a conjoint experiment in multiple countries designed to test this specific proposition. And we focus on the costs to the USA's reputation as an immigration destination as a result of Trump's nativist rhetoric.
An important presumption here is that there are significant numbers of firms, or large sectors of the economy, for whom skilled immigrant workers are an essential component of their labor inputs. Certainly in the case of US firms, there is persuasive evidence that foreign skilled immigrants have contributed significantly to certain sectors of the economy. Kerr and Lincoln (Reference Kerr and Lincoln2010) use changes in the H-1B worker population as an instrument to identify the effect of science and engineering immigration on firm patenting in the USA, over the period 1995–2008. Most importantly, they find a strong relationship between immigration and innovation: “A 10 percent growth in the H-1B population corresponded with a 1–4 percent higher growth in Indian and Chinese invention for each standard deviation increase in city dependency” (p. 475). This study, and others (Brunello et al., Reference Brunello, Garibaldi and Wasmer2007; Hunt, Reference Hunt2011), highlight the important contribution of science and engineering immigrants, particularly from China and India, to innovation in US firms.
The USA has typically been successful at attracting science and engineering immigrants. Thirty percent of all degree-level (and higher) science and engineering workers in the USA are foreign-born, double the number in 1993 (National Science Board, 2018). A number of factors potentially play important roles in attracting skilled immigrants (Ortega and Peri, Reference Ortega and Peri2013). Unsurprisingly, earnings play a preeminent role in explaining the immigration destination decision (Czaika and Parsons, Reference Czaika and Parsons2017). But Ortega and Peri (Reference Ortega and Peri2013) make a strong empirical case that immigration policy initiatives also impact immigration flows and that the impact of these initiatives is quite quick. Tightening of immigrant entry rules in the European Union as a result of the Maastricht and Schengen treaties lead to rapid decreases in the flow of inward immigration. Mayda (Reference Mayda2010) draws similar conclusions from the analysis of OECD country immigration flows. Clearly policies that either tighten or loosen immigration visa requirements will be quickly incorporated into skilled immigrants’ choice of emigration destination.
A country's provision of public goods may also affect the immigration decision. Education is one of these public goods. As Kerr (Reference Kerr2018, Chapter 5) points out, education infrastructure is a magnate for skilled immigrants. A second, less obvious public good, concerns the social welfare infrastructure. We have evidence to suggest that the generosity of welfare benefits affects the migration destination decisions of low-skilled immigrants (Borjas, Reference Borjas1999; Boeri, Reference Boeri2010). It is less clear whether they should be a magnet or deterrent to potential skilled immigrants. Skilled migrants might be deterred by generous welfare states, as they imply higher taxes and lower economic returns from migration (Borjas, Reference Borjas1999), though others conclude that there is no significant relationship between welfare and immigration (Giulietti et al., Reference Giulietti, Guzi, Kahanec and Zimmermann2013).
While it is certainly true that attracting global talent has become an increasing priority for governments in developed countries around the world, our understanding of precisely what shapes these decisions is a work in progress (Kerr, Reference Kerr2018). As Ortega and Peri (Reference Ortega and Peri2013) point out, improving our understanding of the decision to emigrate remains an important research challenge, and one that we now turn to.
1.1 Where will I go?
High-skilled and well-educated potential emigrants will often have some choice over the country to which they immigrate. What specifically enters into this immigration utility function? Our characterization of their utility when choosing between two countries builds on what we know about immigration attitudes more generally. One of the very general findings from the literature on immigration attitudes is that we should distinguish between narrow economic self-interest and broader socio-tropic policy preferences (Hainmueller and Hopkins, Reference Hainmueller and Hopkins2014). With respect to how citizens view incoming immigrants—i.e., the demand side of migration—there is considerable evidence that socio-tropic issues trump economic self-interest in affecting attitudes. In fact, Hainmueller and Hopkins (Reference Hainmueller and Hopkins2014, 227) conclude that, “Overall, hypotheses grounded in self-interest have fared poorly, meaning that there is little accumulated evidence that citizens primarily form attitudes about immigration based on its effects on their personal economic situation.”
Our interest is in the preferences of those on the supply side—i.e., the countries where potential migrants wish to relocate. A similar distinction between economic and socio-tropic concerns, we believe, is relevant here too. In the case of supply, however, the narrow economic self-interest should be more influential in shaping emigrant's destination choices since emigrating is a costly exercise on many dimensions. Moreover, much of what we know about immigration patterns suggests that migration decisions respond to market signals. For instance, the evidence cited earlier confirms that the volume of immigration is affected by expected earnings and the costs of entry (Ortega and Peri, Reference Ortega and Peri2013; Czaika and Parsons, Reference Czaika and Parsons2017). Accordingly, we specifically expect earnings in the country to which immigrants move to be influential in their decision calculus. In a similar vein, public goods provisions should affect the economic dimension of a potential migrants’ decision. In particular, basic social benefits and the quality of education provision make a move to a given country, in theory, more or less costly. In turn, they should affect the economic self-interest calculations of immigrants and thus where they decide to move to.
On the other hand, given the evidence from the demand perspective, we expect socio-tropic considerations, related to immigration policy, to also affect decision making of immigrants. Recent empirical evidence on the demand side suggest higher levels education are correlated with positive attitudes toward immigration (Ford et al., Reference Ford, Morrell, Heath, Park, Clery, Curtice, Phillips and Utting2012; Hainmueller and Hopkins, Reference Hainmueller and Hopkins2014). Moreover, this correlation is attributed not to narrow self-interest but rather to cultural values and broader socio-tropic preferences. Since our focus is on the supply-side decisions made by young well-educated subjects who are prospective high-skilled migrants, we would expect these individuals to be similarly pro-immigration. A country's anti-immigrant policies and rhetoric, therefore, should weigh negatively on their choice of emigration destinations. More educated, and therefore more socio-tropically pro-immigration individuals, should favor destinations that are similarly pro-immigration.
Since this mechanism is socio-tropic, high-skilled individuals might be put off migrating to a destination by policies and rhetoric that seriously restrict immigration (or certain types of immigration) even if it does not affect them directly. Hainmueller and Hiscox (Reference Hainmueller and Hiscox2007) analyze the 2003 European Social Survey and find that higher skilled respondents expressed positive views for all types of, incoming, immigration. And there is also evidence that younger age cohorts have much more positive attitudes, again, to all types of immigration irrespective of whether they themselves are directly affected (McLaren and Paterson, Reference McLaren and Paterson2019). In summary, our expectation is that young potential migrants who are high-skilled would respond negatively to nativist, anti-immigrant policies, and rhetoric.
1.2 Context
Very generally speaking we know that “national” publics can have quite different opinions on specific policy issues. For example, there is an extensive literature exploring the extent of, and the explanations for, cross-national variations in the public's preferences for redistribution policies (Alesina et al., Reference Alesina, Stantcheva and Teso2018). Similarly, there is evidence that public opinion regarding immigration policy varies quite significantly cross-nationally (Heath and Richards, Reference Heath and Richards2019). How and why these quite distinct national perspectives emerge regarding immigration is beyond the scope of this paper. A contributing factor, we suspect, is the role that immigration plays in a country's labor market, historical settlements, and ethnic conflict, for example.
We have selected four very different national contexts where we believe immigration has played very different roles in their political and economic development. Immigration, and the immigration debate, seems to have varied quite significantly across these four countries. China, comparatively speaking, has virtually no immigration. For a range of reasons, the policy status quo in China has been closed to immigration and the public salience of the issue has been quite low. India has more significant levels of immigration, mostly from bordering countries, and there is a political debate regarding the issue. Nevertheless, compared to Europe and North America, immigrants represent a small fraction of the Indian population. At the other extreme is the UK where foreign-born individuals make up around 15 percent of the population and the immigration debate has been very salient.
It is clear that the nature of immigration policy, how it was discussed and debated, would vary across these countries. Hence, the socio-tropic policy perspectives, i.e., how immigration affected the country as a whole, would likely vary across these four cases. And potential emigrants from these countries might have quite distinct immigration policy views. Our conjecture is that anti-immigrant policies and rhetoric could, similarly, resonate more positively (or less negatively) in some of these countries than in others. Before data collection, though, we had no strong priors as to how this contextual variation might play out.
2 Stated preference experiment
2.1 Design
Isolating the effects on immigration decisions of nativist rhetoric is challenging. We should ideally observe the immigration choices of potential migrants who are treated, and not treated, with nativist rhetoric. But of course we are unlikely to observe actual random assignment to treatment and control; and probably less likely to measure revealed preferences under these conditions. Accordingly, we designed a conjoint experiment with high-skilled subjects who are potential immigrants.Footnote 3 In the conjoint experiment our student subjects make binary choices over hypothetical immigration destinations that have randomly assigned characteristics including variations in immigration policies. Separately, the subjects make an incentivized decision that provides further insight into their preferred immigration destinations.
Hence this is a stated preference experiment in which student subjects are asked to choose between two immigration destinations that differ on attributes that we believe determine the immigration decision.Footnote 4 By randomly assigning the values of these critical attributes across respondents, and over the different binary options subjects choose from, we are able to estimate the relative importance of each item for the resulting choice.
The outcome of interest in this experiment is the subject's expressed preference over two possible employment destinations. Student subjects are shown the profiles of two destinations—Employment Destination 1 and Employment Destination 2 (those exact choice names are provided). The subjects are simply asked “which of the employment destinations do you prefer?,” as well as to rate separately how strongly they approve or disapprove of the two destinations. Screenshots of the conjoint treatments are presented in the Online Appendix (Figures A6–A8). Each employment destination has five attributes and each attribute has three possible values. The values associated with each attribute are randomly assigned to each of the two destinations for each choice set presented to the subjects.
A properly specified conjoint experiment includes the most salient choice attributes that are likely to affect the choice made by the student subjects. The five attributes of the conjoint design correspond to the factors we believe drive the migration decision for skilled labor. Table 1 provides a full summary of the conjoint specifications, along with their values.
Immigration conjoint experiment treatments

2.2 Immigration treatment
We implement three distinct conjoint experiments in each of the online sessions. Each of these three experiments includes a different version of the “nativist” immigration treatment. The nativist immigration treatments characterize, or signal, the political or policy context of a country. In Conjoint 1, each of the subjects’ choice profiles are randomly assigned one of the three immigration treatments: a relatively neutral one (“Change in visa processing centers”); a positive one (“Implementation of a point system”); and a negative, or “nativist,” value (“Restriction on Muslim immigration/tourist visas”). We chose the “implementation of a point system” policy treatment as the positive attribute (compared to the other two policies) because it is generally perceived as favoring high-skilled potential migrants. Points-based systems are considered by many to make it easier for high-skilled migrants to gain entry compared to systems that do not weight admission decisions on skill indicators (Tani, Reference Tani2014). There is also considerable survey evidence suggesting that the public, world-wide, is generally more favorable to skilled immigration (Blinder and Richards, Reference Blinder and Richards2018; Valentino et al., Reference Valentino, Soroka, Iyengar, Aalberg, Duch, Fraile, Hahn, Hansen, Harell, Helbling, Jackman and Kobayashi2019). And, of course, given that our subjects are skilled potential migrants our expectations is that this policy attribute would resonate quite positively.
In Conjoint 2, the negative immigration treatment is replaced with “Deportation of all illegal immigrants.” In Conjoint 3, we replace the immigration policy treatment with a new attribute randomly assigning one of three country labels (“Australia,” “UK,” or the “USA”). For UK subjects, the UK label is changed to “Canada.” This third immigration treatment is designed to test whether the US “brand” has been sufficiently tarnished by “Trumpian” policies and rhetoric to cause potential highly skilled migrants to avoid the US Subjects make three choices per conjoint, for a total of nine choices. The random assignment of attribute values allows us to estimate the relative importance of these nativist policy declarations in shaping their emigration destination decisions.
Alongside this immigration attribute, each destination choice has four additional attributes. Again, the goal here is to capture as best as possible the range of emigration destination features that might enter into the immigration decision. As the evidence summarized earlier suggests, income is a preeminent consideration in the choice of emigration destination. Accordingly, we include two attributes that we believe capture distinct dimensions of income concerns. (1) The first attribute is simply the notion that higher economic growth attracts new immigrants: GDP growth rates of 2, 4, and 6 percent are randomly assigned. (2) A separate income attribute is salary, which we present as the average international rank of salaries in the service sector. Again, there is random assignment of a high value (90th percentile), neutral value (70th percentile), and low value (50th percentile).
The remaining two attributes are meant to capture the public goods provisions we noted earlier that have been shown to affect migration decisions. (3) The education attribute has three values: a positive one (universities ranked in the world's top 90th percentile); a negative one (universities ranked in the 40th percentile) and a neutral attribute (universities in the 60th percentile). (4) Our welfare benefits attribute includes three randomly assigned values: a positive value (“generous monthly family allowance”), a negative one (“No state minimum wage or income support”); and a neutral value (“Basic hourly minimum wage”).
2.3 Subject pool
A critical element in the experimental design is the choice of subject pools. Our goal was to include subjects that represent distinct global talent pools from which US firms would recruit immigrant employees. The experiments were conducted with university student subjects from the two most important talent pools for US firms: China and India. As we noted earlier, high-skilled immigrants from these two countries have been the primary recipients of H-1B visas but also they have had significant positive effects on innovative, high-tech industries. We also administered these experiments to university student subjects from talent pools that play less central roles for US firms, certainly less important roles for US high-tech firms: Chile and the UK. Nevertheless, both countries have strong historical and political ties with the USA. The UK represents a mature developed European economy and Chile represents a highly developed Latin American economy. The USA has been a dominant destination for emigrants from both countries.Footnote 5
A further concern in selecting the subject pools was their skill profile. Our primary interest is in understanding the migration preferences of high-skilled potential emigrants. Accordingly, we administer the experimental treatments to subjects that resemble this sub-group in the population. The experiments were conducted with subjects recruited to the Nuffield Centre for Experimental Social Sciences (CESS) university student subject pools in Chile, China, India, and the UK. Respectively, these were students currently or recently studying at the Universidad de Santiago de Chile; Nankai University (Tianjin); FLAME University (Pune); and the University of Oxford. Most of these students had education profiles that resembled those of skilled immigrants that might consider emigration to the USA.Footnote 6
Finally, given the comparative element of this research design, a critical concern is that we recruit similar kinds of subjects to the experiment and that the experiment take place under very similar conditions. Since we implemented the experiment in the four Nuffield CESS centers—Oxford, Pune, Tianjin, and Santiago—we had good control over subject recruitment and sampling. Each of these centers has an experimental lab and maintains a student subject pool for experiments. In Oxford, Pune, and Santiago, subjects are recruited from the student body into an ORSEE subject pool database. Students from the Nankai University are recruited into the CESS Subject pool using a WeChat recruitment and database platform. The student subject recruitment procedures are similar across the four centers. Nuffield CESS has a very strict no deception rule for all experiments conducted with its subjects; all experiments, including those conducted online, are paid; and CESS has very strict privacy and data protection rules. Subjects in the four locations are provided with identical descriptions of the general experimental rules and procedures, all of which are described in detail on the CESS web site: https://cess-nuffield.nuff.ox.ac.uk/
The experiments were conducted with Nuffield CESS Online facilities and implemented on Qualtrics. Subjects were paid for their participation and aspects of the survey experiment were incentivized.Footnote 7 Participants in the study are predominantly young, as expected with a student subject pool that includes post-graduates. Female participants slightly outnumber males. The ideological preferences of subjects have a fairly normal distribution although the UK subject pool is skewed slightly to the Left, whereas both Chile and India subjects are slightly skewed to the Right. For density plots see Figures A1–A5 in the Online Appendix. Subjects were asked to indicate their interest in migrating on a scale that ranged from “Not at all interested” (1) to “Very interested” (7). Mean subject pool responses were clearly skewed toward “very interested” ranging between 5.5 and 6.0 in a 1–7 point scale. The full summary statistics for subjects are presented in Table A1 in the Online Appendix.
3 Estimation strategy and results
We recover the causal estimates of specific characteristics of employment destinations with logistic regression (with standard errors clustered by participant). For each choice option we regress their binary decision on dichotomous variables representing the attribute values of the destination choice. Since we are interested in the relative effects of levels within models, the logistic coefficients are sufficient to demonstrate the difference in relative magnitude and the direction of any causal effect within and between attributes. Readers should note that these coefficients should not be directly interpreted as the marginal effect on the probability of choosing a given destination.
Recall that subjects make choices for nine two-destination choice sets—each subject makes three dichotomous choices for each of the three conjoint treatments.Footnote 8 Figure 2 presents graphical summaries of the estimated logit coefficients with 95 percent confidence intervals for each country. For each of the three different immigration treatments we only present the logit coefficients for the identically measured immigration policy attributes. Full regression tables for each country model are included in the Online Appendix. The reference categories for the conjoint attributes are the neutral categories included as dots with coefficient zero in Figure 2.
Immigration policy treatment and country label logit coefficients from the three separate conjoint experiments. Full results for each regression are reported in the Online Appendix. The 95 percent confidence intervals are shown for each point estimate, clustered by subject.

The results for the three conjoint experiments tell a fairly consistent story about nativist policy pronouncements and the destination preferences of skilled immigrants. In the first immigration treatment, the “Muslim Ban” attribute has a large negative coefficient for student subjects in both Chile and the UK. For the India and China student subjects, the coefficient is negative but almost half the size and barely indistinguishable from zero. In the second immigration treatment the “Deportation of all illegal immigrants” attribute is negative and large for both the UK and Chile. For Chinese and Indian student subjects the coefficient is indistinguishable from zero. In the third treatment, the “USA” value has a negative coefficient in Chile and the UK, indicating a large negative country brand effect (relative to the baseline Australia). The magnitude of the US brand treatment effect is roughly half that of the “Muslim Ban” and “Deportation” in the UK, but it has a stronger effect on Chilean student subjects relative to the “Muslim Ban’ and “Deportation of all illegal immigrants.” Again, China and India are distinctive in that the US brand attribute has no discernible effect on their immigration destination choices.Footnote 9
Overall these results suggest that the nativist rhetoric of “Trumpian” politics has mixed effects on the destination decisions of skilled migrants. The nativist rhetoric plays differently depending on the audience. With respect to student subjects from the two most important immigrant talent pools for US firms, China and India, the overall effect on migration destination choice is essentially zero. This is not the case with more traditional talent pools that have historical ties to the USA but are much less important sources of human capital for US domestic firms. In both Chile and the UK, the two nativist immigration treatments and the US brand name treatment had significant negative effects on the destination choices of our student subjects.
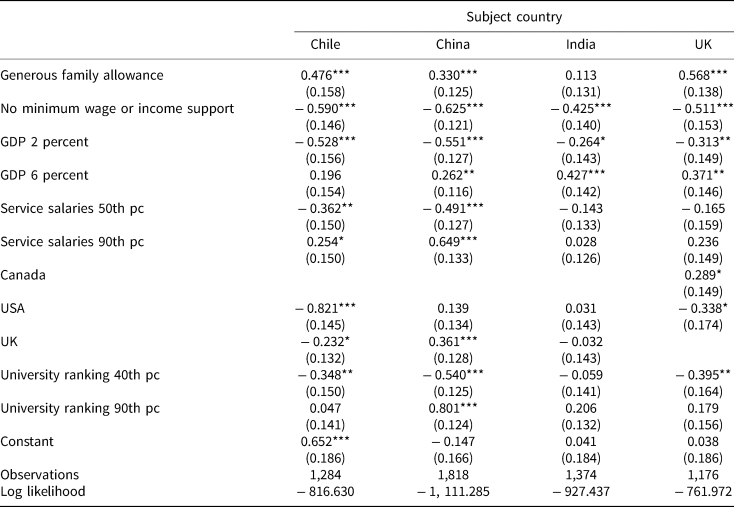
As we pointed out earlier, each of the three different conjoint experiments included four additional attributes that were designed to measure other important factors that shape the migration decision. For the sake of brevity, we only report the full results for the conjoint experiment that included country names. These are reported in Table 2 for each country. Aside from immigration treatments, the coefficients for the remaining attributes are substantively and statistically similar across the three conjoint experiments. Complete regression results for each conjoint experiment can be found in the Online Appendix.
Treatment 3 (country labels) regression results by subjects’ country

Standard errors clustered by subject.
*p < 0.1; **p < 0.05; ***p < 0.01.
We expected that economic earnings should matter for the immigrant's destination choice and this is precisely what we find in our stated preference experiment. Higher GDP growth increases the attractiveness of a destination, lower GDP growth deters potential high-skilled migrants. The UK and Indian subjects have a particularly strong preference for destinations with higher economic growth. Income opportunities for the highly skilled—proxied by service sector salaries—also have the anticipated effect. They are particularly important for Chinese student subjects and least important for those from India.
Public goods provision increases the attractiveness of an immigration destination. In all four student subject pools the choice of an immigration destination is affected positively by the availability of generous family allowances and negatively by the “no minimum wage or income support” attribute (although the positive treatment is insignificant for Indian subjects). University rankings are not important to Indian student subjects; however, there is a very strong effect on the China student subject pool; and a somewhat mixed effect on the UK and Chilean subjects.
Results for these additional attributes of the immigration destination are reassuring on a number of fronts. First, they confirm findings from observational studies suggesting that the decision to immigrate into a country is shaped by expected earnings but also by public goods provision—social welfare benefits and education infrastructure, in particular. Second, the fact that many of these other attributes are significant determinants of choice in our conjoint lends credence to our claim that we have isolated the causal effect of nativist pronouncements on the immigration decision. Under-specified conjoint experiments can result in inflated effect sizes for the treatment attributes of interest.
3.1 US antipathy
An important implication of these findings is that the adoption of populist or nativist measures designed to preclude certain types of immigration are ignored by some potential immigrants but are important considerations for others. China and India tend to be among the former while Chile and the UK tend toward the latter group. The implication, suggested by the third treatment results above, is that, for the Chileans and British student subjects, the US brand as an immigration destination has been tarnished. With these data we can only speculate that Chilean and British exposure to nativist rhetoric has eroded the brand reputation of the USA for high-skilled potential migrants.
We did, however, include an additional incentivized experiment in the online session that confirms the antipathy held by Chilean and British student subjects toward the USA (and the relatively more positive attitudes of Indian and Chinese subjects). Subjects were asked to complete an Information Extraction Task (IET) that required them to read a short passage of text describing the visa requirements for one of four countries, the UK/Canada (for UK subjects), the USA, and Australia. Each subject was given free choice over which country's rules to read about, and this was followed by four incentivized questions concerning the text. We treat the choice of country visa text as an unobtrusive, implicit measure of the student subject's preferences regarding immigration destinations.
Given the conjoint experiment results our expectation is that this unobtrusive measure of immigration preference should find that Indian and Chinese subjects choose the US option much more than is the case for the Chilean and British subjects. This is precisely what we see in Table 3. Chinese and Indian student subjects chose to answer questions on the USA nearly 50 percent of the time. UK student subjects choose the USA roughly one-third of the time, while Chileans choose the USA the least frequently.
Proportion of times each country was chosen for the information extraction task (by subject pool)

Subjects were also asked to rate each country as an employment destination. Student subjects in Chile rated Australia more favorably than both the USA and the UK, whereas, conversely, Chinese student subjects favored the USA over both the UK and Australia. Student subjects in the UK rated Canada more favorably than Australia, but Australia more favorably than the USA. All these results are highly significant (see Online Appendix Table A2). India is a clear exception, however, where subjects were statistically indifferent between the three locations.
These results are consistent with the causal claim we make above: recent nativist pronouncements by President Trump seem to resonate with Chilean and British potential skilled immigrants but do not affect the immigration preferences of those from China and the India. At least for participants in these high-skilled student subject pools, one's country of origin does seem to moderate preferences over named immigration destinations.
4 Treatment effect heterogeneity
The results of the conjoint experiments and IET suggest there are country differences in how subjects respond to nativist policies. There are other plausible sources of heterogeneity. We present three sub-group analyses of treatment effect heterogeneity: ideology, age, and likelihood of emigrating respectively.Footnote 10
4.1 Ideology
Nativist pronouncements (by Trump or others) are decidedly political and are typically associated with populist sentiment from the political right (Golder, Reference Golder2016). Some of the antipathy toward the USA or toward the Trumpian nativist pronouncements might be accounted for by the partisan leanings of potential skilled immigrants. The nativist pronouncements may resonate with partisans of the right but leave partisans of the left indifferent. We explore whether partisan leanings interact with the three treatment effects in the conjoint experiment. Subjects in all four countries were asked to self-identify on a 11-point left-right continuum.Footnote 11 For this analysis, subjects are divided into Left, Center, and Right groups and then we estimate separate models using the same conjoint specification as in Figure 2.Footnote 12 Graphical results for the immigration attribute across rounds for Left and Right subjects are presented in Figure 3.Footnote 13
Conjoint results by ideological self-placement. Logistic coefficients are plotted with 95 percent confidence intervals clustered by subject.

We do observe partisan differences in the treatment effects. And there is evidence across the student subject pools of stronger treatment effects for partisans of the Left compared to those of the Right. Differences in the effect of nativist immigration policies are clearly more evident in the UK and India where Left student subjects exhibit stronger, negative effects for both the “Muslim ban” and “Deportation of all illegal immigrants” treatments. It is also the case that Chile's negative effect toward immigrant deportation appears to be driven by the Left. Aversion to the US country label is driven by the Left in the UK, whereas both left and right subjects in Chile are deterred by this label. Left respondents in China are, in fact, more likely to prefer the destination if it is labeled as the USA. Across the board, the points-based visa system treatment is neutral as expected.
4.2 Age
While all four student subject pools have a clear skew toward young adult participants, this is slightly less pronounced in Chile and the UK compared to India and China. This difference also corresponds to the differences in the observed effects of nativist policy primes within the conjoint experiments. While we have no theoretical reason to think that age would drive these differential results, the observed differences across countries may nevertheless be confounded by age differences across subject pools.
To test the robustness of our findings, we run a pooled model for all respondents across the four countries. We divide respondents into two groups (age ≤ 25; age > 25), and estimate separate logistic models for each group and conjoint experiment. The models include all conjoint attributes, plus country fixed effects. If age is a confounder, we would expect that the nativist policy treatments would have differential impacts between young and old categories. Specifically, given the observed differences in age distributions, older respondents should be more negatively affected by these treatments.
Table 4 reports the immigration-related logit coefficients for these models. Full regression results are available in the Online Appendix. Overall, the estimated effects are very similar across the two groups. The direction of each effect is the same for each attribute level. The deportation, point-system visa and Muslim ban policies do not exhibit substantial differences in terms of the size of the effects. One notable difference is that there is some discrepancy between younger and older subjects in terms of the size of the US label in the third conjoint. Despite the lower sample size, older subjects (irrespective of country) appear to react more strongly than younger subjects to the US attribute level in the third conjoint. However, the USA effect is negative and at least borderline significant for both age cohorts.
Partial regression results run on a pooled sample, by age cohort

Standard errors clustered by subject.
*p < 0.1; **p < 0.05; ***p < 0.01.
In short, older student subjects (irrespective of country) do not appear to be driving the differences in responses to nativist rhetoric between country subject pools. The difference in effect size for the US country attribute is interesting, though with the data in this paper we can only speculate as to why older participants would react more strongly against this label. With respect to the two explicitly nativist treatments there is no evidence of age cohort differences.
4.3 Likelihood of emigrating
Clearly not all of these educated and young university subjects are prospective emigrants. Nevertheless, their self-reported likelihood of emigrating is high. We asked subjects, pre-treatment, “Thinking about the next 2 or 3 years, what is the possibility that you would move to a foreign country to take a new job?.” Subjects could respond on a scale that ranged between “Not at all Likely” (1) to “Very Likely” (7). Across the four subject pools, the mean response was between 3.8 and 5.3 on this 7-point scale. As a final test of preference heterogeneity, we assess whether our results hold for just those who declare they are likely to emigrate. We run identical models to the main analysis, but subset the data to only include student subjects who rated their likelihood of emigrating as 4 or higher (on a 7 point scale). As before, we only plot the logit coefficients for the immigration policy attributes and country labels. Full regression tables of the complete models are available in the Online Appendix.
Figure 4 displays the results. Substantively, the results are very similar to those reported for the full sample. Indian student subjects, who are more likely to emigrate, are slightly more favorable toward the USA as a destination, and Chilean student subjects, most likely to emigrate, are even more opposed to the USA as an emigration destination. Otherwise the results resemble the full sample.
Logit coefficients for immigration policy treatments and country labels, for subjects who rated their likelihood of emigrating as 4 or higher (out of 7). The 95 percent confidence intervals are shown for each point estimate clustered by subject.

In this section we estimate heterogeneity in the nativist treatment effects. The treatment effects of nativist rhetoric, and their variations across countries, that we observed in the full sample, hold when we control for age cohort, ideology and likelihood of emigrating.
5 Conclusion and discussion
There is an increasingly global competition for highly skilled immigrants. While the USA has historically attracted many high-skilled immigrants, this might be changing. In this paper, we examined whether the politics of immigration affects the immigration decision—in particular the decision of high-skilled immigrants to move to the USA. In order to isolate the causal effect of nativist pronouncements on the immigration decision we implement a stated choice conjoint experiment with student subject pools of likely skilled immigrants in China, India, Chile, and the UK. Subjects are asked to choose between two different immigration destinations that vary on five key attributes—one of which directly captures nativist immigration policies. Across three different conjoint experiments, we test various facets of this nativism: one invokes the “Muslim ban” rhetoric of Trump; a second alludes to the deportation of illegal immigrants; and a third simply calls attention to the US’ brand image.
We find that the political populism, nativism, and anti-immigrant rhetoric of “Trumpian policies” deters high-skilled immigration to the USA. But the negative effect on skilled immigration of this anti-immigrant rhetoric likely varies across the global talent pool. Nativism has a negative impact on the preferences of likely skilled immigrants from countries with more developed economies, that have historical immigration ties with the USA but are not an important source of immigration for US firms. We base this conclusion on the overall estimated conjoint results for our student subject pools in Chile and the UK. In contrast, again based on student subjects, we find that populist pronouncements have little overall effect on the destination preferences of likely skilled immigrants from US industries’ two largest talent pools: China and India.
The nativist treatment effect differences between these two types of talent pools are quite striking. One factor that might explain these differences is the political preferences of the different talent pools. Populist immigration policies will not be well-received by partisans of the Left. Our evidence is very much preliminary and is simply based on the student subjects’ self-identification on a Left-Right continuum. Even given these qualifications (or possibly because of them), we do find that the nativist treatment effects are largely confined to partisans of Left in the UK; there is some evidence of a nativist treatment effect on Left partisans in India; while both Right and Left respond negatively in Chile.
The focus of this article is on the supply side of the immigration decision. Nevertheless, the central finding is very much consistent with the extensive research on demand for immigration, i.e., public support for immigration (Hainmueller and Hopkins, Reference Hainmueller and Hopkins2014; Valentino et al., Reference Valentino, Soroka, Iyengar, Aalberg, Duch, Fraile, Hahn, Hansen, Harell, Helbling, Jackman and Kobayashi2019). Public support for immigration is very much motivated by socio-economic concerns; how these policies would affect the country as a whole. Hence, for example, in many countries there is relatively high support for immigration policies that favor skilled immigration. These broader socio-tropic considerations also shape the supply-side decision; specifically, the countries to which high-skilled immigrants decide to migrate. While much of the recent anti-immigrant rhetoric of US immigration policy does not have immediate self-interested consequences for high-skilled immigrants, it of course reflects on broader policy issues that are socio-tropic in nature. We provide evidence that this policy rhetoric dissuades potential immigrants from selecting the USA as a migration destination. But the causal effect is restricted to our sample of more mature developed countries that have historically supplied immigrants to the USA—Chile and the UK. These socio-tropic concerns for the Chinese and Indian student subjects do not seem to be negatively triggered by this recent US nativist rhetoric. One explanation is that high-skilled immigrants from China and India may either share these nativist policy views or be indifferent to them. Alternatively, there may be a “push” element to how high-skilled potential immigrants from China and India assess overall immigration policy in the USA. Our negative immigration policy treatments might be perceived by some as considerably more moderate (or less negative) than their prevailing policy environment, i.e., the push factor, in China and India. To the extent that this is the case, the relative negative effect of the nativist treatments might be attenuated.
The global talent pool of skilled immigrants is heterogeneous. US firms have an important economic interest in understanding the specific factors that account for the migration destination of skilled migrants. Findings from our conjoint experiment provide some initial insights into the heterogeneous effect of nativist pronouncements on the migration decisions of the global talent pool of skilled migrants. At least for those talent pools that are of particular importance to US firms, China and India, these anti-immigrant policy pronouncements seem to have little effect on their choice of migration destinations.
Supplementary material
The supplementary material for this article can be found at https://doi.org/10.1017/psrm.2020.33.
Acknowledgments
Constantin Reinprecht and Thomas Robinson were both recipients of ESRC scholarships during the writing of this article. Research funding was generously provided by the Nuffield College Centre for Experimental Social Sciences. Denise Laroze would like to thank the proyecto POSTDOC_DICYT, code 031864DN_POSTDOC, Vicerectoría de Investigación, Desarrollo e Innovación, Universidad de Santiago de Chile. All replication materials can be found at https://github.com/rayduch/Nativist-policy-Trumpian-politics.