Introduction
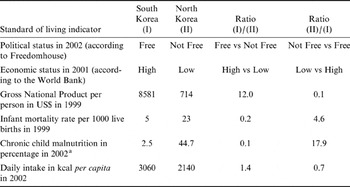
In previous centuries, the Korean peninsula was an independent, homogenous nation that experienced little migration or influence from the outside, leading to its infamous reputation elsewhere as a ‘hermit kingdom’. After the period of Japanese colonization (1910–1945) and liberation by the allied forces at the end of World War II, the Korean peninsula was split politically at the 38th parallel into two nations – North and South Korea – separated by the emerging Cold War. Even after the end of socialism and the disintegration of the Eastern Bloc in the 1990s, the two Koreas (in contrast with the two Germanies) remained one people living in two nations. Socialist North Korea is one of the poorest nations in the world, classified as a ‘low income’ country by the World Bank (2010). In one human biological manifestation of this situation, North Korean children were found to have the third-highest prevalence of acute malnutrition (or wasting) in all of Asia (Weingartner & Weingartner, 2000) as well as the twelfth-highest rate of chronic malnutrition (or stunting) around the year 2000 (Schwekendiek, Reference Schwekendiek2010). In contrast, South Korea is one of the world's most developed nations, a member of the OECD since 1996 and the world's tenth-largest economy as of 2004. South Korean men have also been found to be the tallest in East Asia (Schwekendiek & Jun, Reference Schwekendiek2010), and South Korean babies have the lowest prevalence of low birth weight in the Asia-Pacific region (Popkin et al., Reference Popkin2001), both of which facts suggest that South Koreans are among not only the wealthiest but also the healthiest on the Asian subcontinent. Table 1 confirms that the biosocial situation is considerably worse in the northern half of the Korean peninsula, with infant mortality almost five times higher and chronic child malnutrition nearly eighteen times higher in the socialist North compared with the free-market-oriented South. Daily intake of kilocalories is also estimated to be 1.4 times lower in the North.
Indicators of comparative living standards in the two Koreas around 2002

a Rate of stunting or share of children whose height-for-age falls below −2 SD from the reference group.
Not surprisingly, several comparative studies have looked at the diverging biosocial development of the two Koreas. John Komlos (Reference Koepke and Baten1985) suggested the term ‘biological standard of living’, which is now standard (Baten & Wagner, Reference Baten and Wagner2003; Koepke & Baten, Reference Kim, Choi, Kim and Merrill2005; Choi & Schwekendiek, Reference Choi and Schwekendiek2009; Moradi, Reference López, Calvo, Poy, Balmaceda and Càmera2010). Indeed, human biological measurements such as height and weight are very sensitive to underlying living conditions. As social, economic and epidemiological stresses are known to result in stunting of growth and lead to underweight status, anthropometric measurements capture quite well the overall standard of living as well as the socioeconomic performance of a particular country by adding a biosocial component to the ‘classical’ economic assessment of standard of living.
Previous studies on biosocial differences between the two Koreas have been conducted along this line, by reporting height and weight gaps as manifestations of diverging socioeconomic development (Pak, Reference Moradi2004, 2012; Schwekendiek & Pak, Reference Schwekendiek and Jun2009; Pak, Reference Pak2010; Pak et al., Reference Pak2011). As Korea has been an ethnically homogenous nation for centuries, genetic factors are not likely to have caused these anthropometric differences, which were consistently found across the aforementioned studies. In this light, the Korean people can be seen as a unique and extreme historical experimental population, allowing scholars to investigate environmental effects on humans under a number of genetic, climatic and hemispheric ceteris paribus conditions (Schwekendiek et al., Reference Schwekendiek and Pak2009). Hence, biosocial studies on the two Koreas might be of particular concern for auxologists, anthropometrists, epidemiologists and the like, for the light they can shed on the nature-versus-nurture effects among human populations. Perhaps more importantly, biosocial differences between socialist North Korea and free-market-oriented South Korea have become of enormous public interest globally, as prominent figures such as former US President George W. Bush and former Secretary of Defense Donald Rumsfeld have pointed out the considerable human growth deficits of North Koreans in an effort to highlight the poor socioeconomic performance of its repressive communist state in the media (Schwekendiek, Reference Schwekendiek2011). Consequently, anthropometric differences between North Koreans and South Koreans were even discussed in the 2008 US presidential debates between Barack Obama and John McCain (Schwekendiek & Pak, Reference Schwekendiek and Jun2009).
Therefore, given the considerable scientific and public interest in human growth differences between the two Koreas, this article attempts to give further statistical insights into the biological standards of living within the Korean peninsula by reporting differences in mid-upper arm circumference (MUAC) among women measured in North and South Korea.
Methods
Though a large proportion of the current malnutrition literature focuses on child undernutrition, the number of studies on adult malnutrition has increased since the late 1990s (Ferro-Luzzi & James, Reference Ferro-Luzzi and James1996). Similar to another common height and weight composite indicator, body mass index (BMI), MUAC is an acknowledged indicator of adult physical growth status (World Health Organization, 1995). It is defined as ‘the circumference of the left upper arm, measured at the mid-point between the tip of the shoulder and the tip of the elbow’; in contrast to weight, it is independent of stature (Collins et al., Reference Collins, Duffield and Myatt2000). As MUAC measures arm muscles and subcutaneous fat, it has become an effective quick means of assessing acute adult malnutrition in emergency situations, in addition to being a supplementary indicator to BMI (Ferro-Luzzi & James, Reference Ferro-Luzzi and James1996). Moreover, MUAC is a useful indicator for both screening for acute undernutrition in individuals and assessing the prevalence of chronic undernutrition at the population level (Collins et al., Reference Collins, Duffield and Myatt2000). In this sense, MUAC represents an indicator of the biological standard of living in a society. Furthermore, compared with height and weight, used to calculate BMI, the measurements used for MUAC are much easier to perform. To measure MUAC among adults, a single trained researcher using a tape-measure is sufficient, whereas height and weight measurements require a stadiometer, a weighing scale and ideally two trained surveyors. In addition, some individuals might be too weak or old to stand up or get weighed, making it impossible to assess their anthropometry using standard measuring equipment (and such equipment is often also too expensive). Therefore, MUAC has become a common anthropometric indicator, particularly in emergency situations (Collins et al., Reference Collins, Duffield and Myatt2000). For instance, the MUAC of mothers has been routinely collected in Multiple Indicator Cluster Surveys carried out by the United Nations Children's Fund since the late 1990s. Moreover, as BMI data are not available on North Koreans inside the country, MUAC has become the best available way to assess the nutritional status of adults living inside this terra incognita.
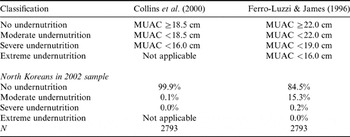
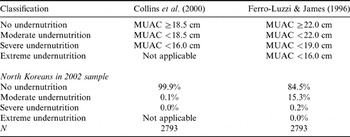
Biosocial research is focused on relative values, counting the number of individuals falling above or below certain cut-offs. For instance, individuals with a BMI of over 25 kg/m2 are usually classified as overweight. However, this paper focuses on absolute metric MUAC values (measured in centimetres) for two reasons. First and more important, the author did not have access to the raw data used for the South Korean population and therefore could not recalculate percentages. Instead, therefore, this study limits itself to a comparison of descriptive statistics between the two Koreas. Second, in contrast to BMI, there are no standardized cut-offs for MUAC endorsed by international organizations such as the World Health Organization. For instance, whereas Collins et al. (Reference Collins, Duffield and Myatt2000) suggest a MUAC cut-off of 18.5 cm for moderate undernutrition and 16.0 cm for severe undernutrition (among women and men), Ferro-Luzzi & James (Reference Ferro-Luzzi and James1996) recommended cut-offs of 22.0 cm for moderate undernutrition, 19.0 cm for severe undernutrition and a cut-off of under 16.0 cm for extreme undernutrition (among women) (Table 2). Even disregarding this discrepancy, there are still no proposed MUAC cut-offs for obesity and overnutrition, as most studies in the field focus on human energy deficiency. Nonetheless, for the sake of completeness, this research briefly presents the prevalence of undernutrition among North Korean women (Table 2); a discussion of the data source will follow in the data section. Table 2 shows that the prevalence of severe undernutrition among North Korean women in 2002 was very low, ranging from 0.0% to 0.2%. This result is not surprising, as in 2002, North Korea had already recovered from the macroeconomic shocks following the disintegration of the Eastern Bloc in the early 1990s, and its nutrition situation was relatively stable compared with that in the 1990s (Schwekendiek, Reference Schwekendiek2011). Yet moderate undernutrition (Table 2) was revealed to be relatively high (15.3%) when applying the cut-offs suggested by Ferro-Luzzi & James (Reference Ferro-Luzzi and James1996) but quite low (0.1%) when using those from Collins et al. (Reference Collins, Duffield and Myatt2000). These results clearly call for further investigation. Of note is that a survey of 1124 North Korean women escaping to China from July 1999 to June 2000 (Robinson et al., Reference Popkin, Horton and Kim2001) found that 9.9% were moderately undernourished and 1.3% severely undernourished, employing the MUAC cut-offs proposed by Ferro-Luzzi & James (Reference Ferro-Luzzi and James1996). These statistics do not really agree with the findings of the 2002 survey carried out inside of North Korea (mentioned above), as the rates of moderate and severe undernutrition of women were found to be 15.3% and 0.2%, respectively, applying the same cut-offs (Table 2). However, it should be noted that the 1999 survey was conducted closer to the collapse of the North Korean economy in the 1990s, and the data could have been distorted by a self-selection effect among refugees and by the fact that they had already stayed for some time in China before getting measured. Even so, it can be said that severe (and acute) undernutrition among women has generally been low in North Korea. In the following, this paper limits itself to metric MUAC data.
Proposed MUAC classifications and cut-offs for undernutrition in women
Data
With respect to South Korea, this paper uses anthropometric findings from Size Korea 2004, a nationally representative survey carried out by the South Korean government from March 2003 to November 2004 (Korean Agency for Technology and Standards, Reference Komlos and Kriwy2004). The survey was conducted primarily to create a database providing body-size standards for industry: for instance, to match clothes or car seats to consumers. It drew upon 15,576 randomly selected individuals, who were measured by trained anthropometricians. The MUAC of the right arm was measured with a plastic tape. The mid-point of the upper arm was identified through visual inspection, with the section of the upper arm that appeared to have the largest circumference being selected for the measurement. Individuals were up to 90 years old and came from all areas of South Korea, with disabled individuals being excluded. The valid sample size among women in the presently relevant age bracket of 20–39 years was 1428.
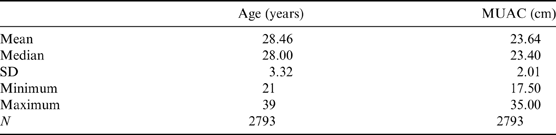
For its North Korean data, this paper borrows findings from a survey conducted in 2002 by the United Nations in collaboration with the North Korean government (Central Bureau of Statistics of the Democratic People's Republic of Korea [CBS] et al., 2002). The survey covered 6000 randomly selected pre-school children (CBS et al., 2002) across North Korea, excluding two provinces declared inaccessible by the North Korean military based on national security concerns. Previous research based on that survey has focused on the height, weight and BMI status of the children (Schwekendiek & Pak, Reference Schwekendiek and Jun2009). However, the MUAC of mothers of children under two was also measured, provided the mother agreed. The MUAC was measured at the mid-point of the tip of the elbow and the tip of the shoulder with a plastic tape. A total of 2793 MUAC measurements were generated in this manner. Additionally, each mother was asked for her age. The descriptive statistics for this sample of North Korean mothers are shown in Table 3. Mean age of the respondents was 28.46 years, with a standard deviation of 3.32 years and a range of 21 to 39 years. Mean MUAC was 23.64 cm, with a standard deviation of 2.01 cm and a range of 17.50 to 35.00 cm.
Descriptive statistics for North Korean women in 2002 sample
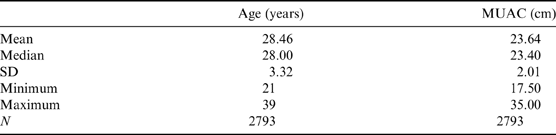
Two individuals who were in fact 40 years of age were assigned an age of 39 years for purposes of comparison with South Korea.
Results
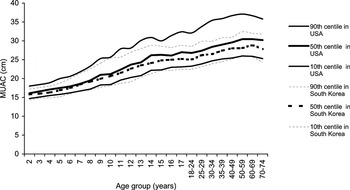
First, a brief comparison of South Korean women and US-American women is presented to see how well South Koreans perform against a well-nourished reference group in the wealthy Western hemisphere. Data were taken from Frisancho (Reference Frisancho1990), who reported MUAC measurements of 19,414 white US-American females from 1.0 to 74.9 years of age from 1971 to 1980. Figure 1 depicts the 10th, 50th and 90th centiles for MUAC of females from the United States and South Korea according to age group. The US-American women clearly have a higher MUAC than their South Korean peers across all birth cohorts, and the gap becomes pronounced with age, beginning around adolescence (Fig. 1). As mentioned elsewhere, ethnic differences in MUAC have not yet been established (Collins et al., Reference Collins, Duffield and Myatt2000); hence, there is no reason to believe that the MUAC of Koreans differs from that of Westerners simply due to genetic predisposition. Another question might be which of the two populations serves as a ‘healthy’ reference group, given that US-Americans are notoriously among the fattest people worldwide (Komlos & Baur, Reference Komlos2004; Popkin, Reference Pak, Schwekendiek and Kim2009), whereas South Koreans are among the slimmest due to healthy lifestyle factors (Kim et al., Reference Frisancho2001; Lee et al., 2002) and are neither undernourished nor overnourished (Pak, Reference Pak2010).
Differences in MUAC between South Korean and white US-American females. Some age groups were combined for comparative purposes. Source: Frisancho (Reference Frisancho1990); Korean Agency for Technology and Standards (Reference Komlos and Kriwy2004).

The preliminary finding is that South Korean females display a significantly lower MUAC than US-Americans in all age cohorts (Fig. 1), implying that the gap between North Koreans and US-Americans is much larger than the intra-Korean gap.
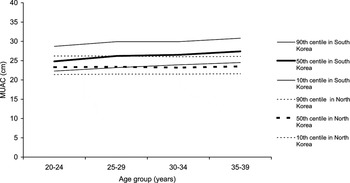
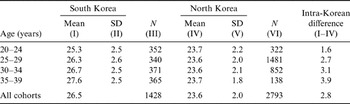
Next, the MUAC of South Korean and North Korean females by 10th, 50th and 90th centiles according to age group is compared (Fig. 2). North Korean females clearly have a lower MUAC than their South Korean peers in all age groups. Between the ages of 20 and 39, the median for North Korean females corresponds to the 10th centile for South Korean females. Similarly, the 90th centile for North Koreans is broadly equal to the median of South Koreans. Moreover, as reflected in Fig. 2, MUAC increases with age in this group in South Korea but not in North Korea (thus, the gap between them becomes more pronounced with age). A simple explanation could be that nutritional stress in North Korea affects all birth cohorts as a result of the national food shortage, whereas South Korean women gain weight with age. Note that statistical tests on the (accessible) North Korean data revealed no statistically significant age differences in MUAC. Last but not least, intra-Korean differences by age cohort were calculated, and are shown in Table 4. On average, MUAC of South Korean women was 2.8 cm greater compared with their Northern peers, with gaps ranging from 1.6 cm to 3.9 cm.
Differences in MUAC between South Korean and North Korean females. Source: Korean Agency for Technology and Standards (Reference Komlos and Kriwy2004); North Korean MUAC was recalculated by the author of this study from a UN-assisted survey conducted by the North Korean government (CBS et al., 2002).

Differences in mean MUAC (cm) of women between the two Koreas around 2002

As South Korean raw data were inaccessible, North Korean data had to be adapted to the reported South Korean 5-year age group classifications. Also note that South Korean age was calculated based on unconventional 0.49 to 0.50 age classifications instead of the common 0.00 to 0.99 standard; hence, the South Korean women in each group are slightly younger overall.
Discussion
As all women in the North Korean sample were mothers, there might be a certain selection bias in these results. The MUAC seems to increase during pregnancy (López et al., Reference Lee, Popkin and Kim2011), and given that all measured North Korean women were mothers with babies under two years of age, they might have had a higher MUAC than a random sample of North Korean woman would have compared with the random Southern sample. Thus, the true biosocial gap between the two Koreas is probably even larger.
However, MUAC was measured at the (stronger) right arm among South Korea women and at the (weaker) left arm among their North Korean peers. Further, the mid-point of the upper arm of North Korean women was identified mathematically and that for South Korean women through visual inspection. The MUAC for South Korean women would probably be somewhat lower if the same measurement procedures were applied as in North Korea. Because MUAC was probably overstimated in North Korea, these two effects may mitigate each other or even cancel each other out.
Previous biosocial studies on the two Koreas focused on height and weight. Pak (Reference Moradi2004) compared the heights of North Korean adults fleeing to South Korea before 2003 with those of their agemates in South Korea, finding North Korean adults were on average 6 to 7 cm shorter than their South Korean peers. Pak et al. (Reference Pak2011) investigated the terminal height of adult North Korean refugees fleeing to South Korea before 2007 and born from the 1930s to the 1980s. As terminal height is largely influenced by factors prevailing in the first years of life (Tanner, Reference Schwekendiek, Pak and Kim1990), these two studies shed light on the biological standards of living in the two Koreas during the Cold War. Interestingly, while North Koreans born before the division of the peninsula were found to be 0.5 to 0.8 cm taller than their Southern peers, South Koreans were taller in all decades thereafter (Pak et al., Reference Pak2011). This height gap was most pronounced in the cohort born in the 1980s, with South Koreans standing taller by 5 to 8 cm (Pak et al., Reference Pak2011). Overall, the height of North Koreans stagnated during the Cold War, whereas a remarkable secular trend in height emerged among South Koreans. Notably, these differences are larger than those previously identified between the two Germanies, with adult East Germans being about 1 cm shorter than their Western counterparts (Komlos & Kriwy, Reference Komlos and Baur2003). This smaller height gap probably exists because the economic differences between the two Germanies were not as large as those between the Koreas.
In addition, in a study based on anthropometric data on North Korean pre-school children as measured by the North Korean government in collaboration with international humanitarian agencies, Schwekendiek (Reference Robinson, Lee, Hill, Hsu and Burnham2009) found that South Korean children were on average 7 to 8 cm taller and 3 to 4 kg heavier than their Northern peers in 2002. In a meta-analysis on pre-school children using data collected inside North Korea in 1997 and 2002 and on North Korean refugee children arriving in South Korea from 2000 to 2007, Schwekendiek & Pak (Reference Schwekendiek and Jun2009) reported that the South Korean children were on average 6 to 8 cm taller and 1 to 3 kg heavier than their North Korean counterparts. In a further anthropometric study based on North Korean refugee data, Pak (Reference Schwekendiek2010) investigated the growth of older children and adolescents. These individuals were 6 to 19 years of age at the time of measurement (when they arrived in South Korea) from 1995 to 2007. Height gaps ranged from 5 to 16 cm among males and 1 to 12 cm among females, with South Koreans being taller. South Korean male and female youth have been reported elsewhere to be 3 to 15 kg and 1 to 7 kg heavier than their Northern peers. Compared with the earlier-mentioned studies conducted among pre-school children, these much wider anthropometric gaps among adolescents can be largely attributed to differences in growth tempo during pre-puberty (Pak, Reference Schwekendiek2010).
By taking MUAC data as an indicator of biological living standards, this research confirms the aforementioned studies that used height and weight measurements. This study found that the nutritional status of North Korean adults measured inside the country is lower than in South Korea. The major shortcoming of previous studies focusing on adult North Korean refugees measured in China or South Korea was bias caused because individuals lived for longer periods of time in their host nation before getting weighed or measured, and so these studies assessed the biological standard of living in the host country rather than that inside North Korea. In addition, a drawback of previous studies assessing the stature of North Korean adult refugees born from the 1930s to the 1980s was that terminal height is a proxy for nutritional and environmental conditions prevailing around birth. These studies therefore merely provide insights into the biological living standard during the Cold War, as opposed to currently. Thus, the present study is the first to assess the biological standard of living of adult North and South Koreans in a more recent period, in addition to being the first comparative study assessing the biological living standards of adults measured inside North Korea.
Conclusion
To sum up, anthropometric gaps between the developed nation of South Korea and the developing nation of North Korea are of considerable public and scientific interest, given the political dimension of nutrition in North Korea and the unique circumstances that both nations share (history and genetic ancestry). This research finds that North Koreans are worse nourished than their southern counterparts, with their MUAC values being 2.9 cm lower on average. Due to the inaccessibility of South Korean raw data, this study can neither statistically test this trend in MUAC nor make advanced statistical comparisons. However, given the consistent gaps in MUAC across all age cohorts, this research does confirm previous studies on the biological standard of living in the two Germanies and in the two Koreas (Komlos & Kriwy, Reference Komlos and Baur2003; Schwekendiek & Pak, Reference Schwekendiek and Jun2009), which have found that biosocial performance is worse in socialist economies than in free-market-oriented regimes.
Acknowledgments
This work was supported by the National Research Foundation of the South Korean Government (MEST) (NRF-2007-361-AL0014).