Statement of Research Significance
Research Question(s) or Topic(s): What is the source of atypically large switch costs in children with attention-deficit/hyperactivity disorder (ADHD)? What is the cognitive architecture of the asymmetric switch phenomenon in children? Main Findings: Both switch and asymmetric switch costs were found and were due to a combination of slower drift rate (i.e., less efficient evidence accumulation representing the presence of task set inertia) as well as longer Ter (i.e., longer pre-decisional processes, of which task set reconfiguration is prominent). We found no evidence of switch-specific weaknesses in children with ADHD compared to non-ADHD controls, but instead evidence of a task-general slower drift rate. Study Contributions: This evidence adds to mounting literature suggesting that the performance deficits commonly observed in childhood ADHD is related to quite basic perceptual decision-making that has downstream effects on higher-order processing.
Introduction
Flexibly and rapidly switching between task demands is a fundamental cognitive skill that is important for attending to and successfully transitioning between tasks. It is key to successful learning in childhood and is traditionally considered a key aspect of cognitive control (Chevalier & Blaye, Reference Chevalier and Blaye2009; Stad et al., Reference Stad, Wiedl, Vogelaar, Bakker and Resing2019). The additional control/effort necessary to execute a switch is referred to as “switch cost,” and it is commonly operationalized in experimental paradigms as the difference in mean response times (RTs) on switch versus nonswitch trials (Monsell, Reference Monsell2003; Wylie & Allport, Reference Wylie and Allport2000). Most major accounts suggest that switch costs occur due to a combination of task set inertia as well as task set reconfiguration (Vandierendonck et al., Reference Vandierendonck, Liefooghe and Verbruggen2010). Task set inertia refers to the carryover of the activation from the n-1 trial into the subsequent trial, n, that must be suppressed. Task set reconfiguration refers to the preparation phase in which the individual reconfigures or reprograms the mental system for the new task and biases attention toward that new task (Monsell, Reference Monsell2003; Schmitz & Voss, Reference Schmitz and Voss2014).
Important work documenting the role of these separable processes has come from use of the diffusion model (DM), an influential computational model of binary decision-making that was developed within the cognitive sciences in the 1970s and has since been widely adopted in clinical and developmental research (Feldman & Huang-Pollock, Reference Feldman and Huang-Pollock2021a; Huang-Pollock et al., Reference Huang-Pollock, Karalunas, Tam and Moore2012; Huang-Pollock et al., Reference Huang-Pollock, Ratcliff, McKoon, Roule, Warner, Feldman and Wise2020; Manning et al., Reference Manning, Hassall, Hunt, Norcia, Wagenmakers, Evans and Scerif2022; Neufeld & Shanahan, Reference Neufeld and Shanahan2022; Schubert & Frischkorn, Reference Schubert and Frischkorn2020). The DM makes full use of multiple dimensions of the data – that is, the shape of the RT distribution for correct and incorrect responses to yield a more complete picture of performance than one based solely on indices of central tendency, and is able to go beyond telling us if someone is slow, to explaining what step in the flow of information processing is the cause of slower RTs. There are several parameters, or variables, used to describe performance, two of which are most relevant to the switching process.
The first, “drift rate” (denoted as v) is the rate at which evidence accumulates toward a decision, can be experimentally manipulated. For example, switch trials (vs. repeated trials) reliably result in slower drift rate, and this is believed to be due to task set inertia from the previous trial (Schmitz & Voss, Reference Schmitz and Voss2012; Schuch & Konrad, Reference Schuch and Konrad2017; Weeda et al., Reference Weeda, van der Molen, Barcelo and Huizinga2014). The task-set inertia account proposes that switch costs arise from proactive interference from the previous task which impairs the execution of the response to the current task (Schmitz & Voss, Reference Schmitz and Voss2012; pg. 5); drift rate measures evidence accumulation toward a decision/response, which is directly impacted by these carryover effects. Individual/developmental differences in drift also exist. For example, children have slower drift rates than healthy adults, and drift rates are slower among children with ADHD compared to their same aged non-ADHD peers (Feldman & Huang-Pollock, Reference Feldman and Huang-Pollock2021b; Ratcliff et al., Reference Ratcliff, Love, Thompson and Opfer2012; Weeda et al., Reference Weeda, van der Molen, Barcelo and Huizinga2014).
The DM is also able to capture and isolate processes that occur outside of the decision-making stage but that still contribute to the total reaction time (RT) (e.g., stimulus encoding, task set reconfiguration, and motor preparation processes). The parameter Ter captures these non-decision processes; consistent with its hypothesized role in task set reconfiguration, Ter is longer for task-switch trials vs. task-repeat trials (Boag et al., Reference Boag, Stevenson, van Dooren, Trutti, Sjoerds and Forstmann2021; Imburgio & Orr, Reference Imburgio and Orr2021; Schmitz & Voss, Reference Schmitz and Voss2012 Schuch & Konrad, Reference Schuch and Konrad2017; Weeda et al., Reference Weeda, van der Molen, Barcelo and Huizinga2014). The task-set reconfiguration account proposes that switch costs arise due to the time needed to prepare for the next task, i.e., task encoding, cue processing (Schmitz & Voss, Reference Schmitz and Voss2012, pg. 4); Ter measures these non-decision processes, which are core to the reconfiguration account, as well as motor preparation processes. Interestingly, the relative contributions of task set inertia or reconfiguration to switch costs vary by age. Using the DM decomposition of the data, Weeda et al. (Reference Weeda, van der Molen, Barcelo and Huizinga2014) found that in adults, RT switch costs were predominantly due to task set inertia but in young children, RT switch costs are primarily due to slower task set reconfiguration processes. Thus, switch costs are accrued at different stages of processing for different developmental periods.
Where a full description of this model and the validating process is beyond the scope of the current paper, these variables are obtained by fitting observed RT distributions for both correct and error responses, to the RT distributions that are predicted by the model. Using an initial set of parameter values, predictions are derived and then the values of the parameters are adjusted using an automatic routine that computes the goodness of fit and replaces the worst fitting parameter values with new ones. By this method, the model iterates to the parameter values that produce the best fit to the data. The best fitting set of parameters values are then used as indices of the latent psychological processes that each parameter represents (i.e., decision speed or encoding speed). Interested readers to the following papers and reviews (Boag et al., Reference Boag, Innes, Stevenson, Bahg, Busemeyer, Cox, Donkin, Frank, Hawkins, Heathcote, Hedge, Lerche, Lilburn, Logan, Matzke, Miletić, Osth, Palmeri, Sederberg and Forstmann2025; Ratcliff et al., Reference Ratcliff, Smith, Brown and McKoon2016; Voss et al., Reference Voss, Voss and Lerche2015; White & Kitchen, Reference White and Kitchen2022).
The switch process is one of three fundamental executive functions, alongside inhibitory control and updating (Friedman et al., Reference Friedman, Miyake, Altamirano, Corley, Young, Rhea and Hewitt2016; Miyake & Friedman, Reference Miyake and Friedman2012) but it is much less frequently the target of study. Where the body of literature in these latter two areas has generated a number of well cited reviews in ADHD alone (Alderson et al., Reference Alderson, Rapport and Kofler2007; Lipszyc & Schachar, Reference Lipszyc and Schachar2010; Martinussen et al., Reference Martinussen, Hayden, Hogg-Johnson and Tannock2005; Oosterlaan et al., Reference Oosterlaan, Logan and Sergeant1998; Pievsky & McGrath, Reference Pievsky and McGrath2018), the same cannot be said for switching. This may be in part due to a relative dearth of modern paradigms that are suitable to answering questions of interest that go beyond documentation of developmental or individual differences. That is, there is ample literature demonstrating ADHD-related group differences on traditional neuropsychological tasks such as Wisconsin Cart Sorting Task and Trails A/B (Frazier et al., Reference Frazier, Demaree and Youngstrom2004; Nigg et al., Reference Nigg, Blaskey, Huang-Pollock and Rappley2002; Reitan & Wolfson, Reference Reitan and Wolfson2004; Romine et al., Reference Romine, Lee, Wolfe, Homack, George and Riccio2004). However, the line of inquiry has not progressed beyond that basic demonstration. This is likely because such tasks were designed to detect individual differences, or the sequelae of injury (Golden et al., Reference Golden, Moses, Fishburne, Engum, Lewis, Wisniewski, Conley, Berg and Graber1981; Vega & Parsons, Reference Vega and Parsons1967). They are not well suited to asking where in the stream of information processing the difficulty resides (e.g., in the management of task set inertia or task set reconfiguration). Previous application of the DM to ADHD on a range of executive and non-executive function tasks has consistently found evidence of slower drift rates relative to non-ADHD controls (Feldman & Huang-Pollock, Reference Feldman and Huang-Pollock2021b; Huang-Pollock et al., Reference Huang-Pollock, Ratcliff, McKoon, Roule, Warner, Feldman and Wise2020; Karalunas et al., Reference Karalunas, Huang-Pollock and Nigg2012; Metin et al., Reference Metin, Roeyers, Wiersema, van der Meere, Thompson and Sonuga-Barke2013; Weigard & Huang-Pollock, Reference Weigard and Huang-Pollock2014). In fact, this pattern of slow drift rate is one of the most consistent, salient measures of cognitive dysfunction in ADHD (Ging-Jehli et al., Reference Ging-Jehli, Ratcliff and Arnold2020). If slowed drift rate is a defining cognitive characteristic of ADHD, one could argue that this would also be the central process driving elevated switch costs in that population.
However, developmental work suggests that slower task set reconfiguration (i.e., Ter) explains greater switch costs in children relative to adults (Schuch & Konrad, Reference Schuch and Konrad2017; Weeda et al., Reference Weeda, van der Molen, Barcelo and Huizinga2014). Developmental immaturity or delay in brain development has been proposed as an explanatory mechanism in both psychopathology in general (Sato et al., Reference Sato, Salum, Gadelha, Crossley, Vieira, Manfro, Zugman, Picon, Pan, Hoexter, Anes, Moura, Del’Aquilla, Amaro, McGuire, Lacerda, Rohde, Miguel, Jackowski and Bressan2016) as well as ADHD in specific (Lesch, Reference Lesch2019; Nakao et al., Reference Nakao, Radua, Rubia and Mataix-Cols2011; Shaw et al., Reference Shaw, Eckstrand, Sharp, Blumenthal, Lerch, Greenstein, Clasen, Evans, Giedd and Rapoport2007). If this is the case, then the task switching process might instead resemble that of younger children, where switch costs are more heavily influenced by the task set reconfiguration than inertia process (i.e., Ter vs. drift rate). Although ADHD-related group differences are not commonly found in Ter (e.g., Huang-Pollock et al., Reference Huang-Pollock, Ratcliff, McKoon, Roule, Warner, Feldman and Wise2020; Huang-Pollock et al., Reference Huang-Pollock, Ratcliff, McKoon, Shapiro, Weigard and Galloway-Long2017; Shapiro & Huang-Pollock, Reference Shapiro and Huang-Pollock2019; Weigard & Huang-Pollock, Reference Weigard and Huang-Pollock2017), many of the paradigms used in previous experimental research make relatively few demands on pre-decisional processes such as reconfiguration. When ADHD-related atypicalities have been observed, they are observed in tasks that require relatively more complex pre-decisional processes (e.g., Feldman & Huang-Pollock, Reference Feldman and Huang-Pollock2021a; Weigard & Huang-Pollock, Reference Weigard and Huang-Pollock2014), suggesting that ceiling effects may account for the general absence of group differences in Ter. For example, evidence of faster Ter among children with ADHD was found on a mental rotation task and was interpreted as resulting from incomplete predecisional processes (i.e., incomplete rotation of the stimulus). This led to the encoding of a stimulus of lower quality and subsequently slower process of evidence accumulation during the decision process (Feldman & Huang-Pollock, Reference Feldman and Huang-Pollock2021a). Similarly, in a task-switching context, if children with ADHD do not fully reconfigure their task set prior to the onset of a switch trial, more interference/negative priming of the previous task set would be present and help explain slower drift rates.
Also of interest to ADHD is a phenomenon known as asymmetric switching, in which switch costs are greater when switching from a less dominant (more difficult) response to a more dominant (less difficult) response (Bryck & Mayr, Reference Bryck and Mayr2008; Gilbert & Shallice, Reference Gilbert and Shallice2002; Schneider & Anderson, Reference Schneider and Anderson2010; Yeung & Monsell, Reference Yeung and Monsell2003). Simply put, switch costs are larger when switching from a hard to an easy task, compared to switching from an easy to a hard task. The best-known example of this effect is observed in Stroop-type tasks in which the RT cost of switching from a color naming trial to a word naming trial is greater than from a word naming trial to a color naming trial. This phenomenon has been observed in both children and adults (Ellefson et al., Reference Ellefson, Shapiro and Chater2006) and across multiple paradigms (Vandierendonck et al., Reference Vandierendonck, Liefooghe and Verbruggen2010). Completion of the less dominant task (i.e., color naming) requires strong activation to overcome the innate activation of the more dominant response (i.e., word reading). This strong activation then carries over into the subsequent word trial, leading to larger switch costs. In contrast, if the more dominant process is completed first, no additional activation is required for its completion. The negative priming effect into the less dominant subsequent trial is therefore reduced (Gilbert & Shallice, Reference Gilbert and Shallice2002; Yeung & Monsell, Reference Yeung and Monsell2003).
If it is true that the asymmetric switching effect is due to the need to overcome or inhibit particularly strong activation in the n-1 trial, such an effect is expected to be reduced in children with ADHD for whom poor inhibitory control has long been noted (Figueiredo et al., Reference Figueiredo, Ramiao, Barroso and Barbosa2023; Pievsky & McGrath, Reference Pievsky and McGrath2018; Yang et al., Reference Yang, Shields, Zhang, Wu, Chen and Romer2022). This study therefore has the potential to answer two questions: What is the source of atypically large switch costs in ADHD? And, because it utilizes a clinical population with known weaknesses in interference control, it also allows us to ask: what is the cognitive architecture of the asymmetric switch phenomenon?
Hypotheses are as follows. First, where both task set inertia and task set reconfiguration contribute to the observation of switch costs, ADHD-related group differences are commonly observed in drift rate but not Ter. However, in the context of a switching task that places greater demand on pre-decisional processes than most tasks that only require basic stimulus encoding, we anticipate finding group differences in both Ter and drift rate, where faster Ter (indicating suboptimal task set reconfiguration) and slower drift rates (indicating greater task set inertia) will be observed. Second, because children with ADHD have known weaknesses in interference control, a Switch × Difficulty x ADHD interaction is expected in which the Switch × Difficulty interaction (i.e., asymmetric switch costs) will be present for non-ADHD controls but reduced in children with ADHD. In this case, an ADHD-related weaknesses in interference control would be expected to protect against carryover activation from an n-1 trial.
Methods
Participants
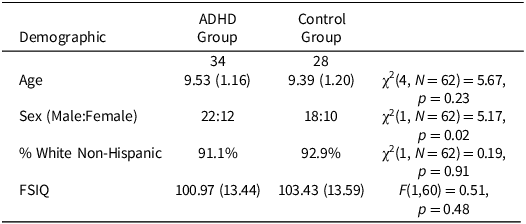
Sixty-two children aged 8–12 (mean age: 9.45) completed a computerized switching paradigm. Ethnic breakdown was as follows: 74.2% Caucasian/non-Hispanic, 3.2% Caucasian/Hispanic, 4.8% “Other,” and 17.7% declined to provide. Sample demographics are provided in Table 1.
Sample demographics

Note: Means (standard deviation in parentheses). FSIQ (full-scale intelligence quotient) reported as a standard score.
Children with ADHD (N = 34; 22 boys) were required to meet all DSM-5 diagnostic criteria for ADHD (any presentation) including cross situational impairment, chronicity, and onset (American Psychiatric Association, 2013). Parent report of symptomology was obtained via the Diagnostic Interview Schedule for Children-IV (DISC-IV; Shaffer et al., Reference Shaffer, Fisher and Lucas1997). To demonstrate the age-inappropriate and impairing nature of these symptoms, at least one parent and one teacher report of behavior on the Attention, Hyperactivity, or ADHD subscales of the Behavioral Assessment Scale for Children (Reynolds & Kamphaus, Reference Reynolds and Kamphaus2004, Reference Reynolds and Kamphaus2015) or the Conners’ Rating Scales (Conners, Reference Conners2001, Reference Conners2008) were required to exceed the 85th percentile (i.e., T-score ≥ 61). Following DSM field trials, diagnostic determination and final symptom counts followed an “or” algorithm to integrate parent responses on the DISC with teacher reports on the ADHD Rating Scale (Lahey et al., Reference Lahey, Applegate, McBurnett, Biederman, Greenhill, Hynd, Barkley, Newcorn, Jensen, Richters, Garfinkel, Kerdyk, Frick, Ollendick, Perez, Hart, Waldman and Shaffer1994). Specifically, a symptom was counted as present if either the parent or the teacher indicated that a symptom was present “often” or “very often”. Children prescribed a psychostimulant medication (N = 5, 8%) completed a medication-free 1–2 day “wash-out” period (mean = 94.12 h, median = 55.5 h, range = 2–6 days) before testing.
Non-ADHD controls (N = 28; 10 boys) did not meet ADHD criteria on the DISC-IV, had T-scores below the 80th percentile (T-score ≤ 58) on all ADHD-related parent and teacher rating scales, and had never been previously diagnosed or treated for ADHD.
Children were excluded from participation if they were (a) currently prescribed and taking a non-stimulant medication, (b) had a parent-reported pervasive developmental disorder, intellectual or sensorimotor disability, psychosis, or neurological disorder, and (c) estimated Full Scale IQ (FSIQ) < 80. Common childhood disorders, such as anxiety, depression, oppositional defiant disorder, and conduct disorder, were assessed using the DISC-IV for all children, but were not exclusionary.
Procedure
All participants completed the following measures as part of a larger study dedicated to examining the cognitive correlates of attention problems in children. The child’s parent completed questionnaires and a clinical interview in a separate room while the child completed executive function tasks in an adjacent room. The research was completed in accordance with the Helsinki Declaration; all data were collected in compliance with human subjects’ approval from the Pennsylvania State University Institutional Review Board (IRB#32126). Informed written consent from parents and verbal assent from children were obtained prior to participation. Children received a small prize for participation. Following completion of study procedures, parents received monetary compensation and informal clinical feedback.
Paradigm
Children completed a task switching paradigm (see Figure 1). Children were presented with a central cue that appeared for 350 prior to stimulus onset and indicated what type of decision was required in the subsequent trial. After the cue offset, a box containing a variable number of asterisks in a 10×10 array appeared on screen. In the Numerosity condition (cued with a #), children were asked to indicate with a button press whether the box contained “many” (56–70) or “few” (31–45) asterisks. In the Side condition (cued with a < >), they were asked whether the box appeared on the right (65–80% on the x-axis) or left (20–35% on the x-axis) side of the screen. Stimuli appeared on screen until a response was given, or until 3000 ms elapsed, after which the next trial began.
Switching paradigm.
Note. Switching paradigm. < > indicates participants should respond whether the following stimulus appears on the right or left side of the screen. # indicates that they should respond whether the stimulus contains many or few asterisks. The participant first sees the cue followed by the trial where they need to respond either by answering the side or the numerosity of the box on the screen. In this example, the second trial is a switch trial, and the third trial is a repeat.

Children completed 195 trials across 3 blocks. Ninety-six trials were switch trials (48 from Numerosity to Side, and 48 in the reverse) and 96 were nonswitch trials. Trials were presented pseudo-randomly, and the first trial in each block was removed from analysis.
Visually perceiving side/directionality is easier than perceiving number magnitude (Gilbert & Li, Reference Gilbert and Li2013) so “side” was intended to be the more dominant (easier) task. Preliminary analyses validated that assumption. Accuracy was higher (F(1,61) = 138.38, p < 0.001, ηp2 = 0.694), RT faster (F(1,61) = 177.77, p < 0.001, ηp2 = 0.745), and variance smaller (F(1,61) = 24.26, p < 0.001, ηp2 = 0.285) for Side versus Numerosity judgments.
Data analytic plan
Anticipatory responses <150 ms and time-outs were removed from analysis. Trial-by-trial RT and accuracy data for each subject was input into the Fast-dm modeling program (downloadable at http://www.psychologie.uni-heidelberg.de/ae/meth/fast-dm; Voss & Voss, Reference Voss and Voss2007) to provide individual estimates of drift rate and nondecision time by Switch/Non-switch and by Difficulty (i.e., Side vs. Numerosity). Boundary separation was allowed to vary freely. AIC model selection favored this model over others in which boundary separation varied by switch or task conditions (see Supplemental Table 1a). Inter-trial variability parameters contribute little to the shape of the distribution and were therefore fixed at zero (Voss & Voss, Reference Voss and Voss2007). A comparison of simulated data based on estimated parameters of this model and raw data indicated reasonable model fit (see Supplementary Table 1b).
Results
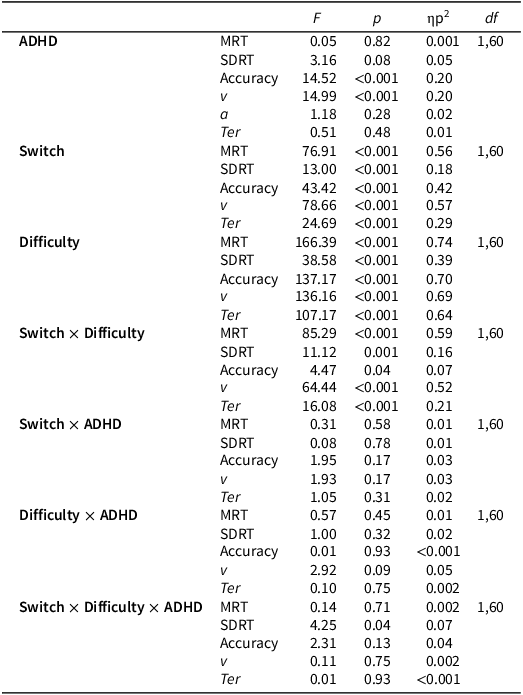
Summary statistics for all conditions and dependent variables are reported in Table 2. Table 3 provides summary F, η 2 , p, and df values for all analyses. As a reminder, the visually perceiving side/directionality is easier than perceiving number magnitude so “side” is the easier task.
Mean (SD) for response times, SDRT, accuracy, v, and Ter by switch, difficulty, and diagnostic group

Note: Values are means with standard deviations in parentheses. SD = standard deviation, MRT = mean response time, SDRT = standard deviation of response time; drift rate represents task-set inertia, Ter represents task-set reconfiguration. Easy = side decision, Hard = numerosity decision.
3-way GLM: 2 (Switch) × 2 (Difficulty) × 2 (ADHD)

Note: 3-way generalized linear model. MRT = mean response time, SDRT = standard deviation of response time; a = boundary separation, v = drift rate, Ter = nondecision time. Drift rate represents task-set inertia, Ter represents task-set reconfiguration.
As expected, main effects of Switch and Difficulty were found. Switch trials and more Difficult trials led to slower RT, worse accuracy, and larger SDRT (all p < 0.001, all ηp2 ≥ 0.178). Asymmetric switch costs (i.e., Switch × Difficulty interactions) were also present for RT, SDRT, and accuracy. That is, RT was slower (Figure 2a), SDRT was larger (Figure 2b), and accuracy was worse (Figure 2c) during the transition from harder to easier trials (all p ≤ 0.04, all ηp2 ≥ 0.07); see Figure 2.
Plots of performance data by switch and difficulty.
Note. Plots of A. mean response time (MRT), B. standard deviation of response time (SDRT), C. accuracy, D. drift rate, and E. nondecision time (Ter) by switch and difficulty. Drift rate represents task-set inertia, Ter represents task-set reconfiguration. Dark gray = repeat trials, light gray = switch trials.

Consistent with the switching literature in adults, DM decomposition of the data suggested that both traditional and asymmetric switch costs were due to a combination of slower drift rate and longer nondecision time (main effect of Switch for drift rate: F(1,60) = 78.66, p < 0.001, ηp2 = 0.57, Figure 2d; for Ter: F(1,60) = 24.69, p < 0.001, ηp2 = 0.29, Figure 2e; Switch × Difficulty for drift rate: F(1,60) = 64.44, p < 0.001, ηp2 = 0.52; for Ter: F(1,60) = 16.08, p < 0.001, ηp2 = 0.21).
With respect to ADHD group differences, children with ADHD were less accurate than non-ADHD controls (F(1,60) = 14.524, p < 0.001, ηp2 = 0.20); see Figure 3c. DM decomposition of the data indicated this was due to slower drift rate, F(1,60) = 14.99, p < 0.001, ηp2 = 0.20, Figure 3d. The Switch × ADHD interaction was not significant for any dependent variable (all p ≥ 0.17, all ηp2 ≤ 0.03), suggesting that slow ADHD-related drift rate was not specifically related to the switch process (although the means were in the correct direction). Similarly, the Switch × Difficulty × ADHD interaction was not significant for any variable except for SDRT, F(1,60) = 4.25, p = 0.04, ηp2 = 0.07, in which the asymmetric switch cost for SDRT was larger for controls than children with ADHD.
Plots of switch costs by diagnostic group.
Note. Plots of switch costs (i.e., Switch–Nonswitch) for A. mean response time (MRT), B. standard deviation of response time (SDRT), C. accuracy, D. drift rate, and E. nondecision time (Ter) by diagnostic group. Drift rate represents task-set inertia, Ter represents task-set reconfiguration.

Overall, there was evidence of slower accumulation of evidence to decision for children with ADHD, but the absence of a Switch × ADHD effect for either drift rate or Ter suggests that the performance deficit is not a switch-process specific. It is instead consistent with the presence of a generalized reduction in the speed of evidence accumulation that affects both switch and nonswitch trials. Further, the absence of a three-way Switch × Difficulty × ADHD interaction for all dependent variables (with the exception of SDRT) suggests that carryover interference from the n-1 trial also does not vary by ADHD status. The absence of this effect is consistent with the absence of a switch-specific performance weakness.
Discussion
The current study examined the source of switch costs in children with and without ADHD. In adults, switch costs are driven by a combination of task set inertia and task set reconfiguration processes (Schmitz & Voss, Reference Schmitz and Voss2012). Consistent with that literature, we found both switch and asymmetric switch costs were due to a combination of slower drift rate (i.e., less efficient evidence accumulation representing the presence of task set inertia) as well as longer Ter (i.e., longer pre-decisional processes, of which task set reconfiguration is prominent).
Although children with ADHD committed more errors overall, their performance was not specifically worse for either switch or asymmetric switch trials, indicating that the performance deficit was general and seen equally for switch and nonswitch trials. This was unexpected. There is strong evidence that different EF tasks capture more shared than unique variance (Friedman & Miyake, Reference Friedman and Miyake2017; Miyake & Friedman, Reference Miyake and Friedman2012). This is true of both statistical covariances in performance and in the common areas of neural activation observed when engaged in a variety of EF tasks (Fiske & Holmboe, Reference Fiske and Holmboe2019; Friedman & Robbins, Reference Friedman and Robbins2022; McKenna et al., Reference McKenna, Rushe and Woodcock2017). Where extensive empirical work has documented ADHD-related weaknesses in inhibitory control and working memory using modern measures of those constructs, the literature on the switch process has not been as intensively investigated. However, because of these known shared variances, it was reasonable to assume the same might be true for switching.
There is often an implicit assumption that EF tasks are process pure and that they capture uniquely distinct capacities (e.g., digits backwards is a measure of working memory; go-no-go is a measure of inhibition; Trails A/B or WCST are measures of switching). Poor overall performance is therefore commonly interpreted as weaker capacity in that domain. In fact, had we leaned on this standard method of interpretation (i.e., that poor overall performance is indicative of poor switching), we might have concluded that the switch process was impaired. However, the more appropriate interpretative approach is in the evaluation of the ADHD × Switch interaction, which was not significant for either traditional outcome measures (e.g., RT, accuracy) or for DM parameters.
DM decomposition of the data did indicate that the ADHD-related task-general poor performance could be attributed to slower drift rate, however. Slower overall drift rates (i.e., less efficient accumulation of evidence to reach a decision) among children with ADHD has been widely replicated across EF and non-EF cognitive tasks (Feldman & Huang-Pollock, Reference Feldman and Huang-Pollock2021a; Huang-Pollock et al., Reference Huang-Pollock, Ratcliff, McKoon, Roule, Warner, Feldman and Wise2020; Karalunas et al., Reference Karalunas, Huang-Pollock and Nigg2012; Rubia et al., Reference Rubia, Smith and Taylor2007; Weigard & Huang-Pollock, Reference Weigard and Huang-Pollock2014). The currents study is yet another piece of evidence suggesting that the slower and less accurate performance among children with ADHD is not limited to cognitive processes typically attributed to executive functions. Instead, it hints at broader cognitive weaknesses that impact even the most basic perceptual decision-making.
ADHD-related group differences in pre-decisional processes such as task set reconfiguration (as represented by Ter) was not observed. Group differences in Ter are not often seen in empirical studies of ADHD, so it may just be that the role of pre-decisional processes simply do not contribute much explanatory power to understanding ADHD-related atypicalities in performance. When group differences are observed, they tend to be seen in tasks that have relatively more complex pre-decisional requirements (e.g., mentally rotate a stimulus then make a decision). Reconfiguring a task set prior to making a decision could reasonably be assumed to be more complex than basic stimulus encoding, but it may not be complex enough for a group effect to be observed. It is also possible that the lack of group differences in Ter was due to the use of a cue that signaled whether the upcoming trial would be a switch (or repeat) trial. Including a switch cue maximizes a paradigm’s potential sensitivity to group differences in drift rate specifically. That is, cueing allows for greater experimental separation of pre-decisional from decisional processes. Although this reduces the risk that any decisional costs could erroneously be attributed to pre-decisional processes, it risks underestimating the influence of pre-decisional processes that could be completed prior to the onset of the stimulus. In fact, designs that use an alternating runs procedures (where similar to cues, task switches and repeats are predictable) report smaller contributions of task set reconfiguration to switch costs than studies in which switches/repeat trials are unpredictable, uncued, or when the cue-stimulus delay is short (Schmitz & Voss, Reference Schmitz and Voss2012, Reference Schmitz and Voss2014).
The switching literature is under-developed in children, but has suggested that while task switch inertia (drift rate) is an important contributor to switch costs, switch costs in young children are driven primarily by a slower task set reconfiguration (Ter) process (Weeda et al., Reference Weeda, van der Molen, Barcelo and Huizinga2014). Specifically, in Weeda et al. (Reference Weeda, van der Molen, Barcelo and Huizinga2014), the influence of Ter on switch costs was largest in the 7-year-old age group. It decreased steadily in the 11, 15, and 21 year old age groups and by 15 years of age, task switch costs were predominantly driven by drift rate in a similar manner to adults (Weeda et al., Reference Weeda, van der Molen, Barcelo and Huizinga2014). Children in the current study ranged in age from 8–12, with an average age of 9.45, indicating that only a very narrow developmental window exists where task set reconfiguration is the primary driving force for switch costs.
Limitations and future directions
Despite representing one of three primary executive functions, the switching literature is largely under-developed in both typically developing children as well as children with ADHD. Large gaps in knowledge remain. One of the many strengths of the current study was in the use of a cued switching paradigm that allowed for a trial-by-trial examination of performance and an ability to identify sources of individual variance that is not accessible for analog switching tasks. However, as noted, it is possible that the contribution of pre-decisional processes were attenuated by the use of a cue in the study design. Thus, future studies can build on this existing work by utilizing un-cued designs, or designs in which the cue-stimulus interval is more attenuated to more fully evaluate the role of task set reconfiguration in ADHD-related performance weaknesses. In addition, extant work (including the current study) has predominantly used dichotomous stimuli. However, in real-life decision-making, stimuli are rarely (if ever) categorical. Much of the more recent work that examining human decision-making has focused on dimensional stimuli, which may more closely resemble information processing in real-life decisions (Huk et al., Reference Huk, Bonnen and He2018; Kvam et al., Reference Kvam, Marley and Heathcote2022; Yoo et al., Reference Yoo, Hayden and Pearson2021). To our knowledge, that work has not yet been attempted in children and would be a fruitful extension of the current work.
Conclusion
The switch process is one of three primary executive functions alongside inhibitory control and updating but remains relatively understudied in childhood ADHD compared to investigations into working memory and inhibitory control deficits. In a switching task, we found no evidence of switch-specific weaknesses, but instead evidence of a task-general slower drift rate. Such evidence adds to mounting literature suggesting that the performance deficits commonly observed in childhood ADHD is related to quite basic perceptual decision-making that has downstream effects on higher-order processing.
Supplementary material
The supplementary material for this article can be found at https://doi.org/10.1017/S135561772510180X.
Funding statement
This research was supported by National Institute of Mental Health grant R01MH084947.
Competing interests
The authors have no known conflicts of interest to disclose.