I. INTRODUCTION
The need to predict the corrosion of iron/mild steel rebars embedded in carbonated concrete over a long period (>10 years) has become a full-fledged scientific challenge for various emerging applications: reinforced containers for interim storage facilities of intermediate-level wastes,Reference Feron and Macdonald1, Reference Cattant, Crusset and Feron2 civil engineering,Reference L’hostis, Foct and Dillmann3, Reference Molina, Alonso and Andrade4 and conservation of heritage artifacts.Reference Scott and Eggert5 Because of the great thickness and the complex nature of the corrosion product layer (CPL),Reference Suda, Misra and Motohashi6–Reference L’Hostis, Neff, Bellot-Gurlet and Dillmann10 the empirical approach is not sufficient. A mechanistic approach is needed for the prediction of long-term.Reference Graedel and Frankenthal11–Reference Chitty, Berger, Dillmann and L’Hostis13 This approach requires an accurate description of the physicochemical at micrometer scale. For that purpose, we propose a methodology based on the recorrosion of ferrous artifacts, previously naturally corroded for several decades in depassivated concrete, in specific short-term in-lab experimentations.
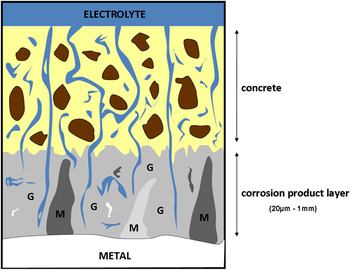
Most of published long-term corrosion mechanisms show that after an initial period, concrete becomes completely carbonated, decreasing the pH of pore-filling solution. This scenario implies that the initial passivating CPLs that form on steel progressively evolve toward a depassivated system, containing thick and porous corrosion products.Reference Duffo, Morris, Raspini and Saragovi8, Reference L’Hostis, Neff, Bellot-Gurlet and Dillmann10, Reference Chitty, Berger, Dillmann and L’Hostis13 Then, corrosion processes are assumed to be ruled by the oxygen transport through a porous multilayer system (successively the concrete and the CPL, as illustrated in Fig. 1), followed by its consumption at the cathodic sites.Reference Chitty, Berger, Dillmann and L’Hostis13, Reference Gonzáles, Molina, Otero and López14 As the CPL is generally considered as the most compact barrier, the corrosion kinetics is assumed to be controlled by the oxygen diffusion through it.
Schematic section of a mild steel rebar corroded in concrete (G: goethite matrix, M: marbling).

In this context, the role played by those thick CPLs (which can grow up to several hundred micrometers over secular periods) must be understood to elucidate the long-term corrosion mechanisms. CPL thickness plays a role in the protective ability of the layer, but it is not the only key parameter. The protective ability of the CPLs also depends on the nature of their constitutive phases.Reference Graedel and Frankenthal11–Reference Yamashita, Miyuki, Matsuda, Nagano and Misawa22 These phases directly impact the localization of the oxygen reduction sites, which is one key point of the corrosion mechanism. The place of anodic and cathodic reactions may greatly influence the nature of the rate-limiting step, depending on whether they are both located at the same place in the CPL or if they are delocalized, due to the presence of conducting phases in the layer (see below). In such a context, a microstructural investigation of thick corrosion layers is necessary for any further phenomenological approach.
The literature dealing with the microstructure of the corrosion layer reveals a polyphasic material, consisting of several iron oxides and oxyhydroxides, with various physicochemical properties.Reference Suda, Misra and Motohashi6–Reference L’Hostis, Neff, Bellot-Gurlet and Dillmann10 Thick corrosion layers are described as a matrix of goethite (α-FeOOH), which is frequently embedded with microscopic areas of iron oxides (magnetite, Fe3O4 and maghemite, γ-Fe2O3) or oxyhydroxides (lepidocrocite, γ-FeOOH).Reference Duffo, Morris, Raspini and Saragovi8, Reference Chitty, Berger, Dillmann and L’Hostis13, Reference Demoulin, Trigance, Neff, Foy, Dillmann and L’Hostis23 Some phases formed during hot rolling of the rebars may be also locally present in the CPL (wustite FeO, magnetite, and hematite, α-Fe2O3).Reference Demoulin, Trigance, Neff, Foy, Dillmann and L’Hostis23 Each of these phases has specific physical and chemical properties that may affect the corrosion process (in particular, the oxygen reduction sites) in radically different ways.
The location of the oxygen reduction sites within the CPL can be determined by using isotopic tracer methods.Reference Chitty, Berger, Dillmann and L’Hostis13, Reference Vega, Berger and Dillmann24, Reference Monnier, Burger, Berger, Neff, Guillot and Dillmann25 This method consists in resubmitting ancient corroded ferrous artifacts to corrosion in marked atmospheres (18O) and revealing the 18O by nuclear microprobe analyses on transverse sections. By using this method, previous studies revealed that oxygen does not exclusively reduce at the metal/CPL interface but can be delocalized within the thick corrosion layers, depending on the local microstructure.Reference Chitty, Berger, Dillmann and L’Hostis13, Reference Vega, Berger and Dillmann24, Reference Monnier, Burger, Berger, Neff, Guillot and Dillmann25
By studying corroded rebars embedded in hydraulic binders, Chitty et al.Reference Chitty, Berger, Dillmann and L’Hostis13 pointed out two possible oxygen reaction sites within CPL: a dominant one located at the metal/CPL interface and a secondary site located at magnetite marblings. This latter site was interpreted, in the light of previous literature,Reference Réguer, Dillmann and Mirambet26 as a decoupling of anodic and cathodic reactions (the iron oxidation and the oxygen reduction, respectively). Nevertheless, these experiments have been conducted in water-saturated medium and thus do not simulate accurately the corrosion of iron in carbonated concrete under wet/dry cycles. First, when exposed to atmospheric environment, the porous system is not fully saturated with water. Second, the seasonal variations of the external conditions [temperature, relative humidity (RH)] induce cyclic variations of the water saturation within the pore network, described (for atmospheric media) as wet–dry cycles.Reference Evans15–Reference Strattmann and Streckel19 According to data available in literature, such a dynamic system considerably modifies the nature of the corrosion layer, and thus its protective ability.Reference Evans15–Reference Strattmann and Streckel19
More recently, Monnier et al.Reference Monnier, Burger, Berger, Neff, Guillot and Dillmann25 extrapolated the same isotopic tracers method by immerging the artifact in unsaturated water media and reproducing the natural RH cycles observed in indoor atmospheres. By studying historic corrosion layers developed in atmospheric media, the author detected a delocalization of the oxygen precipitation sites at the extremity of a ferrihydrite marbling. This phenomenon has been related to the poor electrochemical stability of such a phase, which probably reduces and reoxidizes during the RH cycles.Reference Stratmann17–Reference Strattmann and Streckel19, Reference Monnier, Burger, Berger, Neff, Guillot and Dillmann25, Reference Antony, Perrin, Dillmann, Legrand and Chaussé27–Reference Cox and Lyon30 Nevertheless, the extrapolation of those results to reinforced concrete seems hazardous. Despite some similarities, long-term corrosion patterns are different depending on whether they have developed in atmospheric conditions or in depassivated concretes. The main difference is the nature of the marblings, which are mainly composed of ferrihydrite/lepidocrocite in indoor atmospheresReference Misawa, Hashimoto and Shimodaira20–Reference Yamashita, Miyuki, Matsuda, Nagano and Misawa22, Reference Leidheiser and Music31–Reference de la Fuente, Díaz, Simancas, Chico and Morcillo39 and magnetite/maghemite in cementitious materials.Reference Suda, Misra and Motohashi6–Reference L’Hostis, Neff, Bellot-Gurlet and Dillmann10, Reference Demoulin, Trigance, Neff, Foy, Dillmann and L’Hostis23
The aim of this article is to use the isotopic tracer method to explore the mechanisms of depassivated concrete rebars exposed to water unsaturated medium. Historic mild steel rebars (originally covered with concrete) were sampled from a 50-year-old historical building, immersed in a controlled unsaturated atmosphere with 18O2 and submitted to RH cycling. The 18O sites were then labeled using nuclear microprobe analysis. With this method, the possible delocalization of the cathodic reaction can be observed and compared to the variation of local microstructure.
II. EXPERIMENTAL METHODS
The specific methodology consists in (i) reactivating corrosion processes on ancient corroded historical artifacts in an 18O-rich medium, (ii) characterizing the microstructure of the corrosion patterns by Raman microspectroscopy, and (iii) labeling the 18O precipitation sites within the CPL by nuclear analyses [Rutherford backscattering spectroscopy (RBS) and nuclear reaction analysis (NRA)].
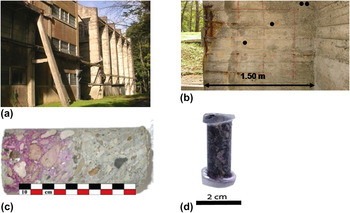
For these experiments, the samples were taken from the air purifier building of the ONERA wind tunnel (Meudon, France).Reference Demoulin, Trigance, Neff, Foy, Dillmann and L’Hostis23 This facility was built in 1950, using CEM II/A-S concrete, reinforced by mild steel rebars [Fig. 2(a)]. The mild steel is a hypoeutectoïde carbon steel (about 0.1 wt% C).Reference Knowles40 The metallic substrate was analyzed by energy dispersive spectroscopy (EDS) coupled to a scanning electron microscope (accelerating voltage of 15 kV, Cambridge Instrument, Si(Li) detector, Cambridge, UK). Elemental analysis confirmed that all elements other than iron showed amounts lower than 0.3 wt% (Si ∼ 0.1 wt%; Mn ∼ 0.3 wt%). No second phase particles or slag inclusions were detected by optical and electronic microscopes. In the corrosion patterns, EDS analyses revealed the presence of around 2 wt% calcium, which may have diffused from the hydraulic binder. No other exogenous elements were detected. The “ONERA” corrosion system has been previously described in details,Reference Demoulin, Trigance, Neff, Foy, Dillmann and L’Hostis23 and the different layouts studied in this article are presented in Section III.A.
View of (a) the Onera Wind tunnel building, (b) localization of the sampled rebars in the building, (c) concrete core, and (d) sample preparation.

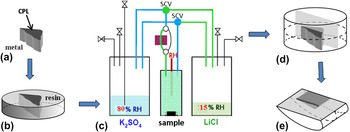
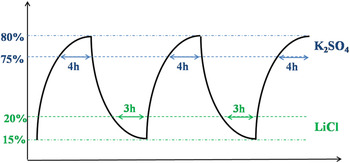
Several slices of the samples were cut from the multilayered system from metal to concrete (Fig. 2). For each sample, collected at different places on the external walls of the building, the complete section was sprayed with a concentrated phenolphthalein solution, and the absence of purple color confirmed that the concrete was carbonated (pH lower than 8). For the 18O tracer method, the metallic extremities of each sampled rebar were covered with resin to let only the corrosion products in contact with the atmosphere [Fig. 2(d)]. Then, the concrete, as well as the transformed medium, was scraped off to leave the corrosion layer exposed to air. Afterward, the specimens were submitted to a specific recorroding treatment devoted to simultaneously (i) recorrode the sample under 18O medium and (ii) reproduce the natural wet–dry cycling [Fig. 3(c)].Reference Monnier, Burger, Berger, Neff, Guillot and Dillmann25 This setup is based on the use of saline-saturated solutions, which controls the RH in a waterproof chamber. An airtight treatment reactor was connected alternatively to two containers in which saturated saline solutions impose RH of respectively 15 and 80%. The samples were submitted to wet/dry cycles over 6 months. One cycle involves a high humidity plateau for about 4 h (RH > 75%) followed by a low humidity plateau (RH < 20%) for about 3 h. The transition between wet and dry stages lasts around 30 min (Fig. 4). Considering an average corrosion layer thickness of 20 μm, it was estimated that oxygen would have enough time to migrate from the external surface of the CPL to the interface during the wet/dry cycle’s high RH plateaus.
Schematic view of the sample preparation (a,b,d,e) and the specific setup dedicated to the recorrosion of samples under 18O atmosphere (c), according to Monnier et al.25. (SCV: solenoid control valve).

View of wet–dry cycles applied to the samples during the atmospheric exposure test in marked medium.

After treatment, samples were cut in cross sections [Fig. 3(d)], ground under ethanol using SiC paper, and polished with diamond paste [Fig. 3(e)]. Their microstructure was first examined through optical microscopy. Then, the different constitutive phases of the corrosion layer were identified by Raman microspectrometry, using an Invia Renishaw spectrometer equipped with a frequency-doubled Nd:YAG laser at 532 nm (laser power < 100μW; spectral resolution: 2 cm−1). Phases were identified by comparison with analyses of commercial powder references (32 nm, 80 μW, 600 s).
Afterward, the isotope enrichment was measured on maps encompassing the whole layer from the metal to the external zone of the CPL (∼100 × 40 μm2), by using ion beam analyses (RBS and NRA). The NRA method is based on the measurement of α particles induced by the nuclear reaction 18O(p,α)15N.Reference Khodja, Berthoumieux, Daudin and Gallien41 The energy of proton beam was offset at 850 keV, which corresponds to a broad resonance of the nuclear reaction for a detection angle of 170°.Reference Amsel and Samuel42 For the quantification, the local stoichiometry of the target is previously refined by the adjustment of the RBS experimental spectrum. Then, the local 18O/16O ratio is derived from the NRA simulation (the reaction observed is 18O(p,α)15N). The region of interest on the NRA region (1750 à 3450 keV) is defined to have a negligible contribution of the pileup. A CPL unexposed to 18O atmosphere was investigated by RBS/NRA technique to evaluate the residual 18O present in a blank sample. This latter is around 0.3%. To consider only the 18O enrichment due to the specific treatment in isotopic tracer, the 18O enrichment is expressed as δ18O, which corresponds to Eq. (1):

The standard deviation has been evaluated around δ18O = ±1000. This variation is mainly related to the heterogeneity of the samples physicochemical properties (porosity, composition).
III. RESULTS
A. Characterization of the crystalline phases
The thickness of CPLs sampled varies between 20 and 50 μm. Some microscopic cracks parallel to the metal/oxide interface are occasionally observed. The CPL microscale shows the coexistence of two kinds of CPLs: one associated with the remains of the initial layer formed during the manufacturing of the metallic piece at high temperature (mill scale products) and one linked to the aqueous corrosion process. On one hand, the mill scale products are mostly made of magnetite (Fe3O4) mixed at some places with other phases such as wüstite (FeO) or hematite (α-Fe2O3). On the other hand, the aqueous corrosion products are mostly iron oxyhydroxides and hydrated oxides in a matrix of goethite,Reference Demoulin, Trigance, Neff, Foy, Dillmann and L’Hostis23 which is sporadically embedded with marblings of poorly crystallized maghemite (γ-Fe2O3). These marblings are frequently observed as isolated islets of no more than 10 μm dimension within the goethite matrix. On the same sample, the relative proportion of “mill scale remains” and “aqueous corrosion products” can vary radically. Mill scale remains can be totally absent of the corrosion patterns or observed as small ribbons embedded in the thick corrosion layer, or it can represent the majority of the layer.
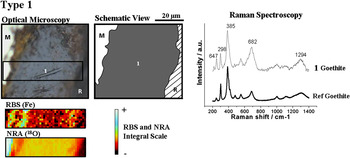
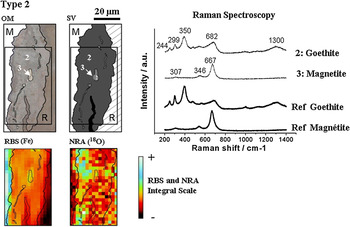
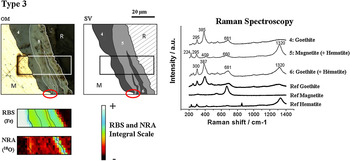
The heterogeneous nature of the CPL microscale enables us to define three types of patterns that have been investigated. Type 1 scale represents a corrosion pattern entirely made of goethite (Fig. 5). Type 2 is made of a goethite matrix, which contains some discontinuous magnetite-rich ribbons, apparently not connected with the metallic substrate (Fig. 6). In the type 3 scale patterns (Fig. 7), the layer is constituted both by an inner patch of goethite-rich corrosion layer and an outer area of magnetite-rich mill scale. One important point to note is that, on the contrary to “type 2 patterns,” the magnetite-rich mill scale is connected with the metallic substrate (as highlighted by the circle in Fig. 7) and the external zone of the layer.
Optical microphotograph and schematic view of the type 1 corrosion layer, with a corresponding Raman spectrum (compared with a goethite reference spectrum) and the RBS and NRA maps (M: metal, R: resin, 1: zone corresponding to Raman spectrum 1).

Optical microphotograph and schematic view of the type 2 layer, with the corresponding Raman spectra (compared with a goethite and magnetite reference spectra) and the Rutherford backscattering spectroscopy (RBS) and nuclear reaction analysis (NRA) maps. (M: metal, R: resin, 2 and 3: zone corresponding to Raman spectra 2 and 3).

Optical microphotograph and schematic view of the type 3 corrosion layer, with the corresponding Raman spectra (compared with a goethite, magnetite and hematite reference spectra) and the RBS and NRA maps. (OM: optical microscopy, SV: schematic view, M: metal, R: resin, 4, 5, and 6: zone corresponding to Raman spectra 4, 5, and 6).

B. Localization of the 18O precipitations sites within the CPL
The three different types of corrosion patterns were investigated with microRBS and NRA mappings in transverse sections. Results clearly confirm that, depending on the phase nature and location in the different corrosion layers, the precipitation of 18O containing phases occurs at different places.
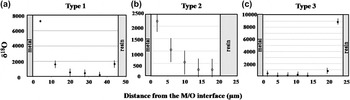
Figure 5 shows the RBS and NRA mappings corresponding to type 1 zone, entirely composed by goethite. The RBS map confirms the structural homogeneity of the corrosion pattern, revealing high enrichment of 18O at the metal/oxide interface. The corresponding profile [Fig. 8(a)] confirms this observation, showing a maximum δ18O value at the metal/oxide interface, which progressively decreases between 0 and 40 μm from the metal interface. After 40 μm, this decrease is followed by a slight increase located at the 10 μm scale outer zone of the CPL. The external 18O enrichment is appreciably less intense than the internal one.
δ18O profiles on transverse sections of (a) type 1, (b) type 2 layer, and (c) type 3 of corrosion pattern. These profiles were plotted by integrating the δ18O value (see methods) on successive equidistant rectangular zones parallel to the metal/CPL interface. The sum of all rectangular zones paves the entire corrosion layers, from the metal/corrosion product interface to the outer part.

Figure 6 shows the RBS and NRA mappings corresponding to type 2 zone. As magnetite and goethite provide different Fe:O ratio (0.75 and 0.5, respectively), both phases are clearly distinguished on the RBS map. As in a type 1 pattern, the NRA map shows high enrichment of 18O at the internal part of the layer. On the quantitative profile [Fig. 8(b)], the maximum δ18O is reached at the metal/oxide interface and continuously decreases with the distance from the metal interface to the outer extremity. No external enrichment is detected in this case.
Figure 7 shows the RBS and NRA mappings corresponding to type 3 zone. Magnetite and goethite are located on the RBS map. In this corrosion pattern, the circle highlights the contact between the magnetite-rich area and the metallic substrate. In this case, contrary to type 1 and 2, NRA map reveals 18O enrichment in the outer area. The δ18O profile shows a maximum at the external extremity and a very sharp decrease into the CPL. Beyond a depth of 15 μm under the CPL surface, almost no 18O is observed [Fig. 8(c)].
IV. DISCUSSION
The three types of CPL presented in this article confirm that oxygen precipitation sites are strongly impacted by the nature and distribution of the various microconstituents of the CPL. In particular, two specific phases are studied here, presenting opposite conductivity properties: goethite and magnetite. At room temperature, magnetite presents a low resistivity (ρ = 5.62 × 10⁻³ Ω·m),Reference Pascal43–Reference Chikazumi and Charap45 whereas goethite is known to show the highest resistivity of the iron corrosion products (1.37 × 10⁷ Ω·m).Reference Guskos, Papadopoulos, Likodimos, Patapis, Yarmis, Przepiera, Przepiera, Majszczyk, Typek, Wabia, Aidinis and Drazek46 As a consequence, the local conductivity of the CPL is determined by the distribution and the connectivity of both of these phases. Types 1 and 2 patterns, in which no conductive marbling is connected to the metallic substrate, represent the case of nonconductive CPLs. On the contrary, a type 3 pattern, in which a large magnetite-rich area is in contact with the metallic substrate, represents the case of conductive CPLs.
First of all, for each of the three types of CPLs observed, the distribution of 18O is very local. This tends to prove that the transport of OH− species is limited due to the high reactivity with iron, thus confirming the direct link between the 18O enrichment and the place of oxygen reduction. Once the dissolved 18O2 is reduced, it forms 18OH−, which reacts with iron ions locally. Thus, any local enrichment of 18O is inevitably related to a reduction of oxygen at a specific location.
According to type 1 and type 2 profiles, the gaseous oxygen migrates in nonconductive layers through the entire corrosion layer via water-saturated pores and then precipitates at the metal/oxide interface. The reduction is coincidental to a phase precipitation site causing local enrichments in 18O. This result is in agreement with Chitty et al.,Reference Chitty, Berger, Dillmann and L’Hostis13 where this type of profile is by far the most frequently observed in saturated media. This colocation of anodic and cathodic reactions at the internal interface of nonconductive CPLs is of primary importance to elucidate the corrosion mechanisms. In this case, the transport of oxygen is a key parameter that has to be properly modeled for any simulation of the corrosion process. In particular, the transport properties of the layer are impacted by its morphology (porosity, tortuosity).
For a type 3 profile, in the presence of magnetite connected to the metallic substrate, the reduction sites of oxygen are delocalized through the whole CPL. This decoupling between the anodic and cathodic reaction can be explained by the fact that the magnetite observed in the layer is connected to the metal. Thus, because of its highly conductive characteristics,Reference Pascal43–Reference Chikazumi and Charap45 magnetite conducts the oxidized metal’s electrons to the outer part of the layer. This decoupling suggests that when numerous conductive marblings are present in the layer, the transport of oxygen is no longer a key factor and other mechanisms have to be considered. The corrosion kinetics could be controlled by the electronic conductivity or by a cationic transport (Fe2+) from the metal to the anodic sites.
In addition, these results illustrate a major difference between the atmospheric corrosion systemReference Monnier, Burger, Berger, Neff, Guillot and Dillmann25 and the depassivated concrete. According to Monnier et al.,Reference Monnier, Burger, Berger, Neff, Guillot and Dillmann25 the 18O precipitated in a nonconductive atmospheric corrosion layer is homogeneously distributed throughout the layer, rather than preferentially located at the metal/CPL interface. This difference of newly formed product location may be related to electrochemical reactivity.
In unsaturated aqueous media, the homogeneous distribution of 18O has been assigned to a cyclic reduction–reoxidation of a part of the CPL,Reference Stratmann17–Reference Strattmann and Streckel19, Reference Monnier, Burger, Berger, Neff, Guillot and Dillmann25, Reference Burger, Legrand, Neff, Faiz, Perrin, L’Hostis and Dillmann47 which could be incidental to dissolution/reprecipitation mechanism. Some ferric phases, which are unstable toward metallic iron, react during the wet stage to give ferrous (or ferrous–ferric) species and thus reoxidized during the drying.Reference Stratmann17–Reference Strattmann and Streckel19, Reference Monnier, Burger, Berger, Neff, Guillot and Dillmann25, Reference Burger, Legrand, Neff, Faiz, Perrin, L’Hostis and Dillmann47, Reference Gonzalez, Miranda, Otero and Feliu48 The efficiency of such a galvanic coupling between ferric product and iron depends on the reduction reactivity of the phase. Besides, the electrochemical reactivity of ferric phases is reaction-pathway dependant. By studying various reference ferric phases, Antony et al.Reference Antony, Perrin, Dillmann, Legrand and Chaussé27 showed that goethite reactivity depends on physicochemical properties (crystallinity, specific surface area, etc.), directly linked to their synthesis conditions.Reference Pourbaix49–Reference Dünnwald and Otto52 Thus, the difference of goethite reactivity between atmospheric corrosion systems and depassivated concrete may be the consequence of different thermodynamic conditions in the interstitial solution (pH, pO2, etc.), which lead to different properties of goethite.
One key parameter could be the doping of exogenous elements within the ferric phases. Indoor atmospheres and depassivated concretes induce different types of pollution (dust coming from the surrounding walls or hydraulic binders), which impact directly the nature and amount of exogenous compounds within the corrosion products. The atmospheric corrosion systemReference Monnier, Burger, Berger, Neff, Guillot and Dillmann25, Reference Monnier, Réguer, Vantelon, Dillmann, Neff and Guillot53 presented enrichments of chloride and sulfur (locally up to several percents), whereas the Onera corrosion system reveals exclusively calcium pollution (around 2 wt%). These minor elements could impact the reactivity (and solubility) of goethite and conduct, in atmospheric media, to highly reactive goethite that induce a galvanic coupling with iron substrate. On the contrary, when formed in cementitious materials, the formation of electrochemically stable variety of goethite would render the galvanic coupling negligible.
Finally, these results suggest that the parameters controlling corrosion kinetics fundamentally differ according to the microstructure of the thick corrosion layer: the physicochemical properties of the different phases (conductivity, electrochemical reactivity) and their distribution within the CPL. This change of rate-controlling step is of primary importance, as it could influence the corrosion rate of the object at macroscopic scales. This observation underlines the necessity of precisely evaluating over time the proportion, location, and nature of corrosion layer’s different phases. Not only is the magnetite highly conductive and frequently observed in CPLs developed in cementitious materials but other minor phases (maghemite, etc.) could contribute to this delocalization as well. In this context, it is therefore essential that probability laws describing the nature of corrosion layers be integrated into mechanistic models. A stochastic approach linked to statistical descriptions of potential layer variations may be the only means to perform a mechanistic modeling of long-term corrosion in a reliable way.
V. CONCLUSION
Thick corrosion layers developed in mild steel rebars after long periods consist of a mix of phases of various properties, which may influence macroscopic kinetics. In this article, the use of isotopic tracer methods demonstrates that the localization of 18O is directly impacted by the local structural distribution of the CPL. For nonconductive layers, gaseous oxygen dissolved in the pore water migrates through the porous network of the corrosion layer and is reduced at the metal/CPL interface. When a local conduction of electron is ensured, this enables a delocalization of the oxygen reduction at the external part of the layer, rendering the transport of oxygen much less limitative. Consequently, it is necessary to understand the variability of corrosion layer composition and structure to postulate a mechanism. A statistical description of corrosion product microstructure may be the only means to link these various possible local mechanisms to the global corrosion.
ACKNOWLEDGMENTS
This project has been carried out through the French national project ARCOR (ANR 06-BLAN-313-05). CEA, ANDRA, and EdF are gratefully acknowledged for the financial support.